
Flare Gas Recovery System Market Size and Share
Market Overview
| Study Period | 2021 - 2031 |
|---|---|
| Market Size (2026) | USD 3.97 Billion |
| Market Size (2031) | USD 5.84 Billion |
| Growth Rate (2026 - 2031) | 8.07 % |
| Fastest Growing Market | Asia Pacific |
| Largest Market | North America |
| Market Concentration | Medium |
Major Players *Disclaimer: Major Players sorted in no particular order Image © Mordor Intelligence. Reuse requires attribution under CC BY 4.0. | |
Flare Gas Recovery System Market Analysis by Mordor Intelligence
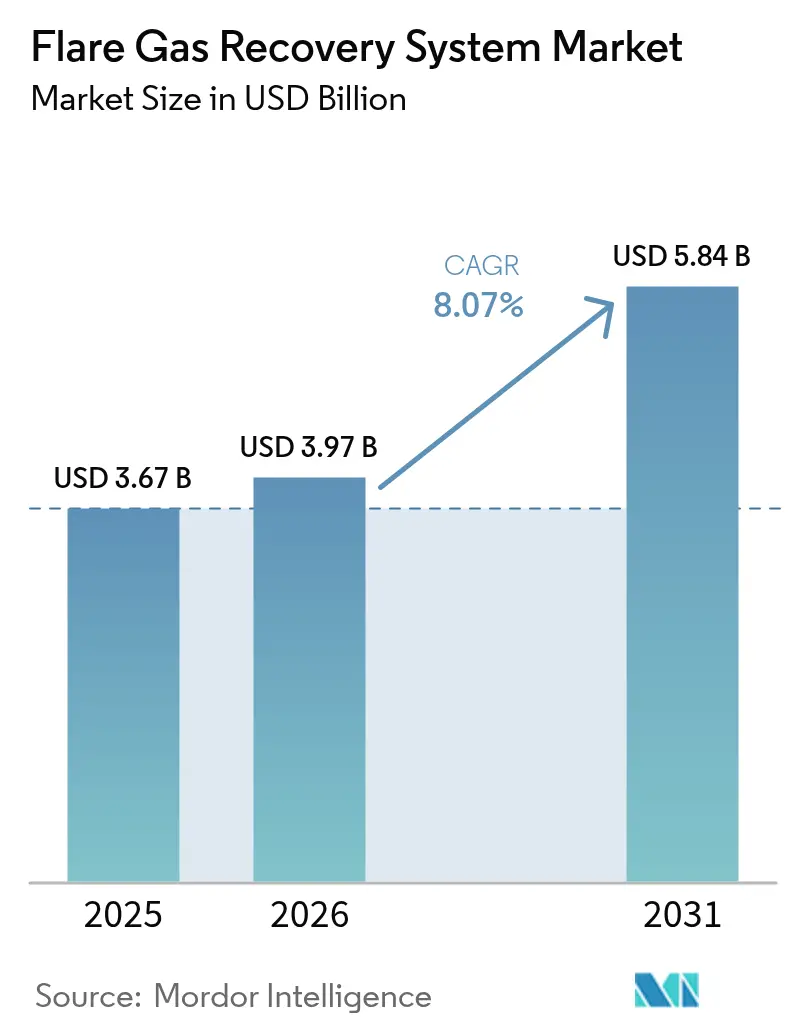
Flare Gas Recovery System market size in 2026 is estimated at USD 3.97 billion, growing from 2025 value of USD 3.67 billion with 2031 projections showing USD 5.84 billion, growing at 8.07% CAGR over 2026-2031.
The expansion is underpinned by regulatory penalties that can reach USD 40,000 per day for methane‐emission breaches in California, creating strong economic incentives for immediate investment.[1]California Air Resources Board, “Low Carbon Fuel Standard Regulation Amendments,” arb.ca.gov Operators no longer view recovery units as compliance add-ons. They treat them as revenue assets that generate carbon credits, fuel for blue-hydrogen production, and high-value natural gas liquids. Digitization, modular designs, and new membrane materials shorten payback periods across facility sizes, while national oil companies (NOCs) embed flare-reduction clauses in production contracts to accelerate technology deployment.
Key Report Takeaways
- By technology, compression-only units accounted for 45.60% of the flare gas recovery system market size in 2025, while membrane separation is progressing at a 12.18% CAGR to 2031.
- By component, compressors and blowers held 39.60% revenue share in 2025; instrumentation and control systems are advancing at 12.05% CAGR to 2031.
- By capacity, above-15 MMSCFD systems captured 42.60% of the flare gas recovery system market size in 2025; systems below 1 MMSCFD are expanding at a 9.85% CAGR between 2026-2031.
- By application, downstream refineries and petrochemicals contributed 39.70% of the flare gas recovery system market size in 2025, whereas LNG and gas-processing plants are forecast to expand at 10.95% CAGR through 2031.
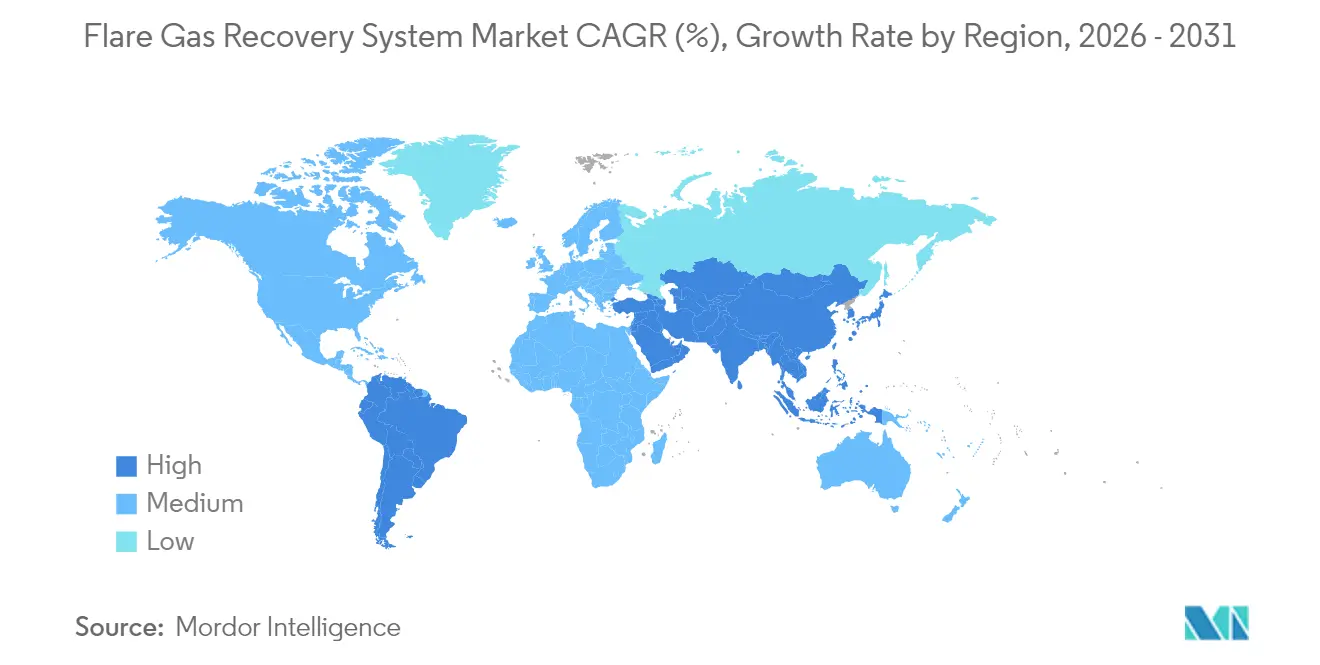
- By geography, North America led with 38.70% of the flare gas recovery system market share in 2025, whereas Asia-Pacific is forecast to register the fastest regional CAGR of 11.35% through 2031.
Note: Market size and forecast figures in this report are generated using Mordor Intelligence’s proprietary estimation framework, updated with the latest available data and insights as of 2026.
Market Trends and Insights
Drivers Impact Analysis of Flare Gas Recovery System Market*
| Driver | (~) % Impact on CAGR Forecast | Geographic Relevance | Impact Timeline |
|---|---|---|---|
| Stricter global methane-emission penalties | 1.80% | Global; early enforcement in North America & EU | Short term (≤ 2 years) |
| Rising LNG liquefaction & FLNG projects | 1.60% | Asia-Pacific core; spill-over to Middle East | Medium term (2-4 years) |
| Carbon-pricing schemes linking flare credits to ESG funding | 1.40% | Global; premium pricing in EU & California | Medium term (2-4 years) |
| Integration with small-scale blue-hydrogen units | 1.20% | North America & EU; expanding to Asia-Pacific | Long term (≥ 4 years) |
| Mandatory flare-reduction targets in NOC production-sharing contracts | 1.00% | Middle East & Africa; selective Latin America | Medium term (2-4 years) |
| AI-enabled predictive vent-gas routing | 0.80% | Global; early adoption in North America | Short term (≤ 2 years) |
| Source: Mordor Intelligence | |||
Stricter global methane-emission penalties
Regulators shifted from voluntary guidelines to binding rules with escalating fees. The US EPA’s NSPS OOOOb requires methane fees of USD 900-1,500 per metric ton, while the EU mandates quarterly leak-detection reports.[2] [3]US Environmental Protection Agency, “Final Rule: Standards of Performance for Crude Oil and Natural Gas,” epa.gov European Commission, “Regulation on Methane Emissions Reductions,” eur-lex.europa.eu California’s amendments add a USD 40,000-per-day liability for repeat infractions, ensuring that flare gas recovery system market uptake now occurs during project design rather than after violations. Investors use methane intensity metrics in equity valuations, making recovery units essential for capital access.
Rising LNG liquefaction & FLNG projects
Asia-Pacific LNG capacity is expanding rapidly. Qatar’s Joint Boil-Off Gas project integrates recovery units to reach 99.5% gas utilization.[4]QatarEnergy, “North Field Sustainability Project Overview,” qatareenergy.qa Modular “Fast LNG” plants from New Fortress Energy process 0.5-2.0 MMSCFD of waste gas, proving economically viable for small fields. Twelve FLNG vessels sanctioned in 2024 require compact, offshore-rated membranes and compressors, anchoring long-term demand.
Carbon-pricing schemes linking flare credits to ESG funding
Voluntary carbon markets crossed USD 1.4 billion in 2024; engineered methane credits trade at USD 15-25 per ton CO₂e, well above forestry offsets. New “core carbon principles” favor industrial abatement. Operators monetize credits upfront through carbon-backed loans, de-risking capital outlays. Price swings of 40-60% prompted insurers to launch floor contracts that stabilise project cash flows.
Integration with small-scale blue-hydrogen units
ExxonMobil’s Baytown complex converts recovered gas into 1,000 t/day of blue hydrogen with 90% CO₂ capture. Modular 1-10 MW reactors process flare streams as low as 0.5 MMSCFD. HNO International’s EcoFlare Power targets data centres that value low-carbon backup power. Projects tap three revenue lines, penalty avoidance, hydrogen sales, and carbon credits, yet require advanced process control and higher capital.
Restraints Impact Analysis of Flare Gas Recovery System Market*
| Restraint | (~) % Impact on CAGR Forecast | Geographic Relevance | Impact Timeline |
|---|---|---|---|
| High CAPEX vs. low associated-gas value in ultra-mature fields | -2.40% | Global; acute in North Sea & Gulf of Mexico | Short term (≤ 2 years) |
| Limited cryogenic-grade gas quality in shale plays | -1.80% | North America shale basins; select global plays | Medium term (2-4 years) |
| Uncertain carbon-credit price floors | -1.60% | Global; volatility in voluntary markets | Medium term (2-4 years) |
| Scarcity of retrofit space on ageing offshore platforms | -1.40% | North Sea, Gulf of Mexico | Long term (≥ 4 years) |
| Source: Mordor Intelligence | |||
High CAPEX vs. low associated-gas value in ultra-mature fields
Late-life offshore platforms face declining production and modest gas prices, making USD 2-5 million small-scale units hard to justify. Space constraints often double installation costs. Joint-platform sharing schemes ease the burden but rely on complex commercial agreements and short remaining asset lives.
Limited cryogenic-grade gas quality in shale plays
Permian gas can contain 5-15% nitrogen and elevated CO₂, challenging membrane selectivity and raising processing costs. Bakken streams vary widely, forcing customised designs that erode standardisation benefits.
*Our forecasts treat driver/restraint impacts as directional, not additive. The impact forecasts reflect baseline growth, mix effects, and variable interactions.
Flare Gas Recovery System Market Segment Analysis
By Technology:
Membrane innovation drives market evolutionCompression-only systems retained 45.60% of the flare gas recovery system market share in 2025, owing to proven reliability and lower upfront costs. Membrane separation, however, is estimated to record a 12.18% CAGR, the fastest among technologies. The shift stems from tighter pipeline specifications and the ability of next-generation polymers to withstand sour-gas streams. Cryogenic condensation is a niche in ultra-high-purity applications but suffers from elevated energy demand. Absorption and adsorption maintain steady uptake in H₂S-rich fields.
Hybrid solutions blending compression and membranes are gaining traction because operators optimize capex while achieving higher recovery yields. MTR’s FuelSep™ system, deployed in the Eagle Ford in 2024, demonstrated 20% lower energy use than legacy skids while capturing C₃+ liquids for resale. The flare gas recovery system market size for hybrid units is forecast to expand above the overall 8.07% baseline through 2031 as manufacturers introduce modular cartridges adaptable to changing gas quality.
By Component:
Digitization transforms control systemsCompressors and blowers dominated 39.60% of revenue in 2025, reflecting their indispensable role in creating suction and discharge pressure. Yet instrumentation and control systems will post the highest 12.05% CAGR to 2031 as facilities migrate from manual valves to autonomous loops governed by cloud analytics. Baker Hughes’ flare.IQ enables operators to verify 98% combustion efficiency in real time, a capability now mandatory in several jurisdictions. Vapour recovery towers and knock-out drums follow market growth, while heat exchangers face substitution by energy-efficient chiller packages in low-temperature climates.


By Capacity Range:
Scale polarization reflects market dynamicsAbove-15 MMSCFD plants held a 42.60% share in 2025 because integrated refineries and gas hubs favor economies of scale. Systems below 1 MMSCFD will grow at a 9.85% CAGR as skid-mounted packages let remote producers monetize gas previously vented. Operators appreciate plug-and-play modules that scale through parallel trains, though per-unit costs are higher. Mid-range 1-5 MMSCFD and 5-15 MMSCFD installations track the overall flare gas recovery system market.
By Application:
LNG expansion drives processing-plant growthDownstream refineries and petrochemicals accounted for 39.70% revenue in 2025, thanks to existing utilities and a steady waste-gas supply. LNG and gas-processing facilities are forecast to record an 10.95% CAGR as developers integrate recovery skids directly into main process trains. QatarEnergy’s North Field expansion and US Gulf Coast projects highlight how recovered gas feeds liquefaction or NGL extraction units, turning a liability into feedstock. Upstream operations still generate the largest volume of flare gas but face economic headwinds in mature basins.

Geography Analysis
North America Flare Gas Recovery System Market
North America holds 38.70% of the flare gas recovery system market size, supported by EPA rules, shale infrastructure, and readily available service networks. However, intermittent negative gas prices in the Permian Basin during 2024 prompted some operators to flare rather than sell, underlining the need for stricter enforcement. Canada’s Clean Electricity Regulations and Mexico’s emerging shale resources present incremental upside, though timelines diverge.
APAC Flare Gas Recovery System Market
Asia-Pacific is the fastest-growing region at 11.35% CAGR. China is retrofitting refineries with carbon-capture and flare-recovery units, while India invests in gasification and LNG terminals. Southeast Asian FLNG projects and Japan and South Korea’s compact-system innovations underpin sustained momentum. Government policies offering tax breaks for methane abatement further reduce payback times.
Europe Flare Gas Recovery System Market
Europe shows steady uptake driven by the EU methane strategy and carbon pricing. Operators in the North Sea weigh retrofit costs against decommissioning obligations, yet many proceed because EU ETS allowances now represent a significant revenue stream. Germany’s THG quota system for transport fuels creates another value pathway for recovered gas.
MEA Flare Gas Recovery System Market
Middle East & Africa record selective growth. Saudi Arabia and UAE bundle flare-recovery requirements into concession agreements, ensuring early-phase deployment. Nigeria’s updated commercialization programme and Iraq’s GGIP establish large capture volumes. Nevertheless, financing and local-content mandates can slow procurement.

Regulatory Landscape
Methane and routine-flaring controls are tightening through a mix of measurement mandates, phase-out deadlines, and prescriptive engineering requirements. In the European Union, Regulation (EU) 2024/1787 formalizes measurement, monitoring, reporting, and verification obligations for methane emissions in the energy sector, using an explicit hierarchy that prioritizes re-injection, on-site use, or dispatch over venting or flaring. In the United States, the Bureau of Land Management Waste Prevention rule took effect in 2024, adding a federal lever that can influence operator economics around flared volumes, alongside EPA performance standards for the oil and gas sector.
In 2026, regulatory implementation details continued to evolve rather than ease. The US EPA issued guidance around the May 7, 2026 routine-flaring phase-out deadline under the 2024 OOOOb/c framework, clarifying the limited circumstances under which routine flaring at new oil wells can continue. It also finalized revisions to certain aspects of the 2024 rule during a broader reconsideration. In Canada, Alberta Energy Regulator updates to Directive 060 (via a 2026 ministerial order) increased technical compliance expectations by adding requirements such as automatic or continuous ignition for certain flares installed, replaced, or relocated on or after January 1, 2030, plus preventive maintenance programs, which raises the baseline specification for new and retrofit flare systems and adjacent recovery solutions.
Competitive Landscape
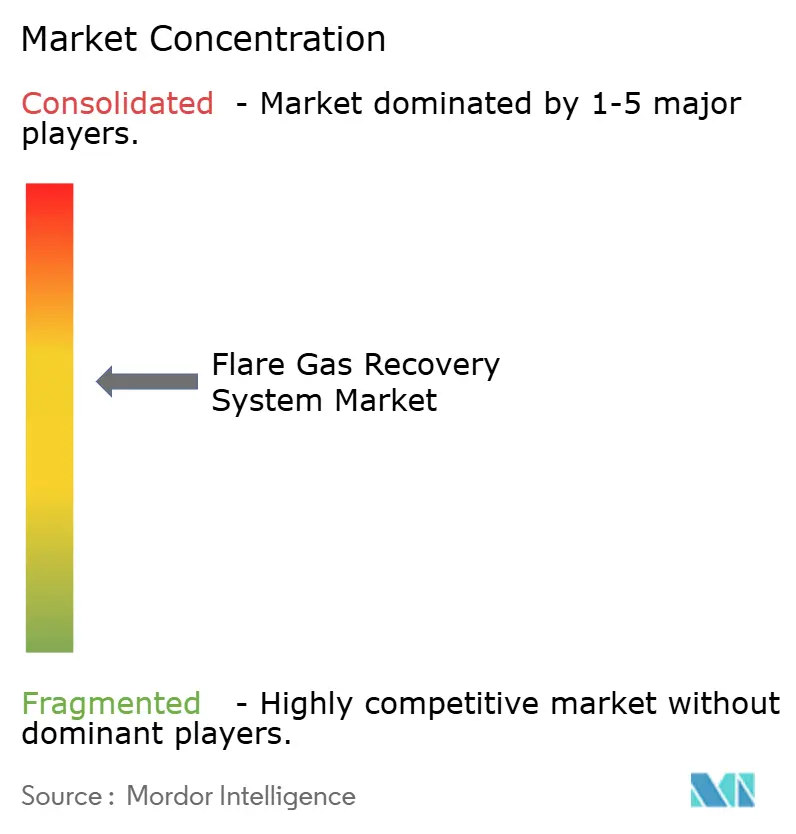
The flare gas recovery system market remains moderately fragmented. Legacy combustion specialists John Zink Hamworthy and Zeeco leverage decades of experience and global installed bases. Equipment majors such as Honeywell UOP and Baker Hughes are pivoting towards digital service models. Software-centric entrants offer AI optimisation overlays atop any vendor’s hardware, capturing high-margin analytics revenue.
Competition now centres on turnkey packages that pair skid equipment with remote monitoring, predictive maintenance, and carbon-credit advisory. Patent filings around high-selectivity membranes, low-bleed pneumatics, and machine-learning algorithms rose markedly in 2024. Strategic alliances, BP with Baker Hughes and SOCAR with Honeywell, illustrate how firms combine domain expertise to win multi-facility rollouts. Moderate M&A activity is expected as traditional mechanical firms acquire digital startups to fill capability gaps.
Flare Gas Recovery System Industry Leaders
John Zink Hamworthy Combustion LLC
Gardner Denver holdings Inc
Honeywell International Inc
Zeeco Inc.
Wärtsilä Oyj Abp
- *Disclaimer: Major Players sorted in no particular order
Flare Gas Recovery System Market Companies Covered in this Report
- John Zink Hamworthy Combustion LLC
- Zeeco Inc.
- Honeywell UOP
- Gardner Denver (Ingersoll Rand)
- Wärtsilä Oyj Abp
- Transvac Systems Ltd
- Aereon (ION Clean Air)
- Schlumberger Endura
- Air Liquide Global E&C
- MAN Energy Solutions
- Eisenmann Environmental
- SoEnergy International
- Zephyr Gas Recovery
- KPS Holdings
- Envent Corporation
- Cimarron Energy Inc.
- Cool Sorpt
- Sundyne LLC
- Ramesa Sistemas
- PetroGas Systems

Market Opportunities and Future Outlook
Near-term whitespace focuses on turning compliance-driven flare reduction into bankable utilization projects that can run in brownfield environments. This is most apparent where operators need modular, compact systems that can handle variable gas quality. Recent field activity highlights the range of monetization pathways. In March 2026, the Obiafu-Obrikom field in Rivers State, Nigeria, reported a flare-gas utilization project entering operation that integrates gas-to-power with NGL recovery, reflecting a combined capture-and-utilization model rather than simple disposal. In June 2026, Saipem 7000 completed installation of a large gas recovery module for the Bouri Gas Utilization Project offshore Libya (Mellitah Oil & Gas, an Eni-NOC JV), which points to sustained offshore demand for engineered heavy-module solutions where space, safety, and reliability constraints influence equipment selection.
Opportunities are also building in downstream and integrated gas-processing hubs where recovery is tied into plant balance-of-plant and product slates. In May 2026, the South Pars Gas Complex (Iran) commissioned a flare gas recovery pipeline at its ninth refinery, connecting captured flare gas to Petropalayesh Kangan Company, reinforcing demand for systems linked to stable offtake routes rather than intermittent local use. On the supplier side, integrated packages that bundle gas recovery with treating are being contracted for refinery environments, as seen in Baker Hughes work with SOCAR for an integrated gas recovery and H2S removal system at the Heydar Aliyev Oil Refinery in Baku (contract signed in November 2024). The pattern suggests a procurement preference for turnkey abatement and conditioning, supported by tighter methane measurement and verification requirements in major jurisdictions.
Recent Industry Developments in Flare Gas Recovery System Market
- June 2026: Saipem 7000 completed installation of a 5,200-tonne gas recovery module for the Bouri Gas Utilization Project offshore Libya for Mellitah Oil & Gas (Eni and NOC joint venture). The heavy-module execution highlights how offshore flare reduction is being packaged as large, integrated installations rather than small add-ons. It also increases demand for offshore-rated compressors, controls, and fit-for-purpose separation equipment that can operate within tight platform constraints.
- September 2025: Baker Hughes signed an agreement with Halfaya Gas Company for a flare gas recovery system at the Bin Umar gas processing plant in southeastern Iraq, targeting recovery of up to 300 MMSCFD of gas that would otherwise be flared. The agreement supports scaling centralized processing and recovery infrastructure in a region where associated gas capture is tied to both operational efficiency and emissions targets. It also signals continued preference for established OEMs able to deliver integrated equipment packages and project execution.
- November 2024: Bumi Armada UK Limited, a subsidiary of Bumi Armada, signed an EPCIM contract with EnQuest Heather Limited to deliver a flare gas recovery system on the Magnus platform in the UK North Sea, with an estimated contract value of GBP 50 million. The contract reflects ongoing investment in brownfield offshore upgrades where retrofits must be engineered around limited space and late-life asset economics. It also expands the set of contractors participating in flare recovery deployments beyond pure-play equipment vendors into offshore project delivery specialists.


Flare Gas Recovery System Market Report Scope and Research Methodology
Market Definition and Coverage
For this methodology, the flare gas recovery system market covers packaged and engineered systems that capture flare or relief header gas, condition it, and route it back for reuse, thereby reducing routine flaring at oil and gas, refining, petrochemical, and gas processing sites.
Scope exclusions: It excludes stand alone flare stacks and tips, general plant compressors not dedicated to flare recovery service, and fees for carbon credits or penalties that sit outside equipment and system supply.
Segments Covered in This Report
- By Technology
- Compression-only Systems
- Membrane Separation
- Cryogenic Condensation
- Absorption/Adsorption
- Hybrid (e.g., Compression + Membrane)
- By Component
- Compressors and Blowers
- Vapour Recovery Towers
- Knock-Out Drums and Separators
- Heat Exchangers/Chillers
- Instrumentation and Control Systems
- By Capacity Range
- Below 1 MMSCFD
- 1 to 5 MMSCFD
- 5 to 15 MMSCFD
- Above 15 MMSCFD
- By Application
- Upstream (Onshore and Offshore)
- Downstream (Refineries and Petrochemicals)
- LNG and Gas-processing Plants
- Others (Gas Storage, Terminals)
- By Geography
- North America
- United States
- Canada
- Mexico
- Europe
- Germany
- United Kingdom
- France
- Italy
- NORDIC Countries
- Russia
- Rest of Europe
- Asia-Pacific
- China
- India
- Japan
- South Korea
- ASEAN Countries
- Rest of Asia-Pacific
- South America
- Brazil
- Argentina
- Rest of South America
- Middle East and Africa
- Saudi Arabia
- United Arab Emirates
- Qatar
- South Africa
- Egypt
- Nigeria
- Rest of Middle East and Africa
- North America
Data Sources, Market Sizing, and Validation
Desk Research
Desk work started by mapping the demand pool where flare gas recovery is technically relevant, then linking it to publicly available flaring and hydrocarbon processing activity. We referred to open sources such as the World Bank Global Gas Flaring Reduction data, IEA oil and gas indicators, US EPA air emissions guidance, and EIA upstream and refining statistics, plus energy regulator publications in major producing regions.
To translate activity into equipment value, we reviewed public company filings, project announcements, EPC bid notes, and credible trade press for typical system configurations and order patterns. Where needed, paid subscriptions for company financials and news, patent databases, and global contracts and tenders were used to cross-check timing and completeness of announced projects. The desk sources listed are illustrative only, and we used other public and paid references to validate figures and clarify assumptions.
Primary Interviews and Surveys
Primary inputs were collected through interviews and surveys with plant engineering teams, operations and maintenance roles, EPC contacts, and component suppliers who handle system sizing at the site level. Coverage spanned the main oil and gas and downstream hubs across APAC, EMEA, and the Americas so we could reconcile differences in flare regulations, retrofit intensity, and typical capacity bands.
Distribution of primary research fieldwork respondents
| Company type | Respondent position | Region |
|---|---|---|
| Top tier: 31% | CXOs: 18% | APAC: 46% |
| Mid tier: 51% | Functional/Unit leaders: 37% | EMEA: 29% |
| Smaller Players: 18% | Managers: 45% | Americas: 25% |
Market-Sizing & Forecasting
The core sizing uses a top-down build that reconstructs demand from flaring intensity, installed oil and gas and downstream capacity, and the share of sites where recovery is technically and economically viable. Those demand pools are translated into annual system value using typical capacity ranges (in MMSCFD), configuration splits (compression only versus membrane or cryogenic plus hybrids), and observed price bands for the main equipment blocks.
The totals are then checked with selective bottom-up approximations, including sampling recent project awards, applying sampled ASPs by capacity band, and rolling up supplier and channel feedback in key regions. When project detail is missing, gaps are handled with proxy indicators such as announced debottlenecking programs, refinery turnaround cycles, and regional methane and flaring enforcement momentum, then stress-tested in calls.
For forecasting, scenario analysis is used to flex outcomes based on upstream activity, gas price-linked reuse economics, and regulatory enforcement strength. Assumptions are anchored to expert consensus on retrofit timing, new build additions, and ASP progression by capacity band, then applied consistently across regions and end uses.
Data Validation & Update Cycle
Model outputs are validated through multiple checks, including variance testing against public flaring series, major project counts, and the implied installation pace by region. Any outliers are reviewed, followed by a second analyst review of key assumptions such as capacity mix, reuse routing, and typical system pricing before sign-off.
Reports are refreshed annually, with interim updates when material events occur, such as new flaring limits, major upstream capex shifts, or a visible change in project award cadence. Before delivery, a fresh review pass is completed so clients receive an updated view that aligns with the latest public signals and interview feedback.
Mordor Intelligence's Flare Gas Recovery System Market Size Compared With Other Published Estimates
Published market sizes for flare gas recovery systems can look far apart because the boundary is not always consistent, and the inputs are chosen differently. Common differences come from whether figures count only dedicated recovery packages versus broader vapor recovery equipment, how retrofit timing is treated, and which year is used for currency conversion.
World Bank flaring volumes and visible project award activity are the evidence checks that keep Mordor Intelligence's 2026 estimate tied to recoverable gas handling needs at upstream and downstream sites, rather than counting adjacent emissions control hardware. In addition, differences show up when a study uses catalog pricing without installed-system adjustments, or when it assumes aggressive adoption in regions where enforcement and payback expectations are still uneven.
Benchmark comparison
| Source | Market Size | Gaps in Research Methodology |
|---|---|---|
| Mordor Intelligence | USD 3.97 B (2026) | |
| Trade Data Publisher A | USD 2.80 B (2024) | Uses 2024 as base year and appears to rely heavily on reported shipment and production tables, which can undercount retrofit projects and engineering scope that lift installed value. |
| Industry Research Outlet B | USD 5.69 B (2025) | Likely applies a broader equipment boundary and a higher penetration assumption for adoption, which can pull in non flare dedicated vapor recovery or adjacent emissions solutions. |
Taken together, the spread is mainly explained by year selection and how narrowly the system boundary is drawn around flare header recovery versus neighboring vapor recovery equipment. By keeping the demand pool traceable to flaring intensity, capacity bands, and realistic adoption timing, the estimate stays repeatable and easier to audit during internal planning.


Key Questions Answered in the Report
What is driving the flare gas recovery system market growth?
Stricter methane regulations, expanding LNG capacity, and monetisation opportunities such as carbon credits and blue hydrogen sales are pushing an 8.07% CAGR through 2031.
Which region will grow the fastest?
Asia-Pacific is forecast to post an 11.35% CAGR to 2031, powered by LNG projects and supportive emission-reduction policies.
How large is the flare gas recovery system market size today?
The market reached USD 3.97 billion in 2026 and is projected to rise to USD 5.84 billion by 2031.
Which technology segment leads the market?
Compression-only systems held 45.60% of 2025 revenue, but membrane separation is the fastest-growing at 12.18% CAGR.
What share do compressors and blowers command?
They accounted for 39.60% of 2025 component revenue, reflecting their critical role in any recovery skid.
Are small-scale recovery units viable?
Yes. Systems below 1 MMSCFD are forecast to grow at 9.85% CAGR owing to modular designs that suit remote or marginal fields.
Page last updated on:


 Your data is secure and never sold or shared.


