
Flame Detectors Market Size and Share
Market Overview
| Study Period | 2020 - 2031 |
|---|---|
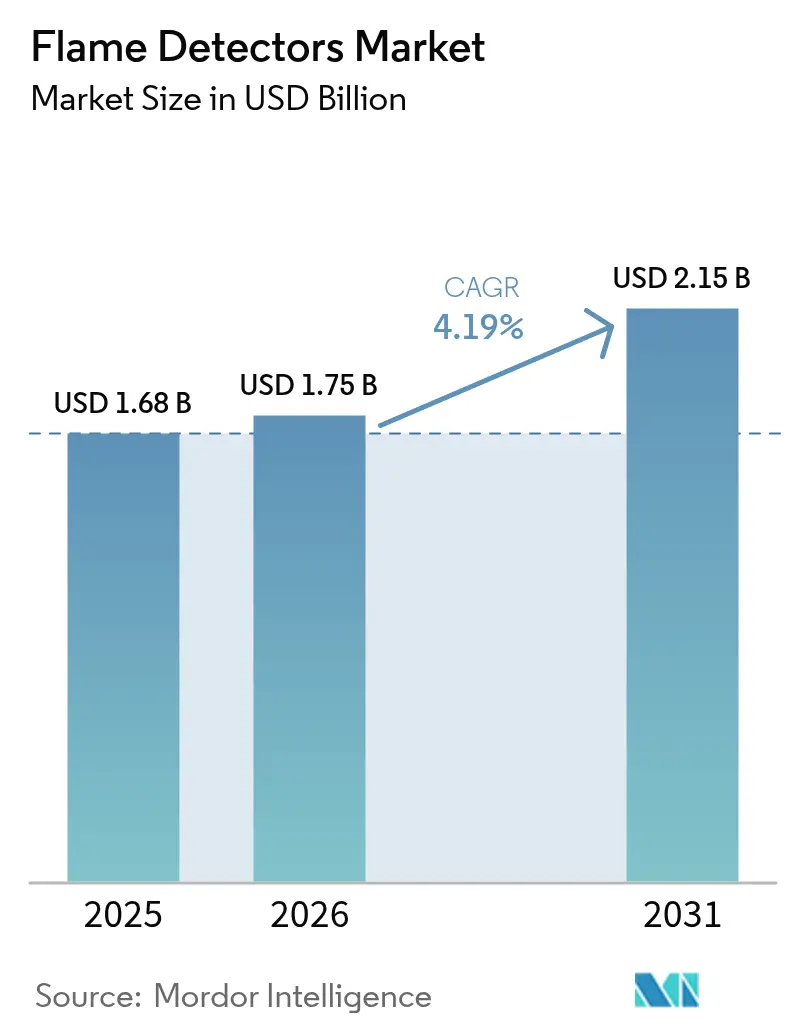
| Market Size (2026) | USD 1.75 Billion |
| Market Size (2031) | USD 2.15 Billion |
| Growth Rate (2026 - 2031) | 4.19 % |
| Fastest Growing Market | Middle East |
| Largest Market | North America |
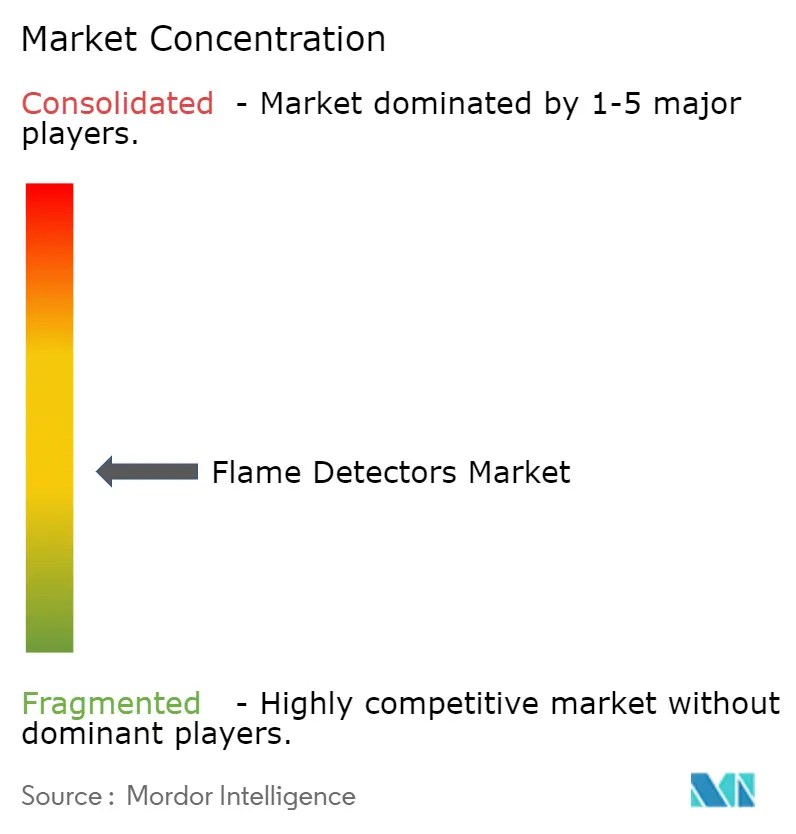
| Market Concentration | Medium |
Major Players *Disclaimer: Major Players sorted in no particular order Image © Mordor Intelligence. Reuse requires attribution under CC BY 4.0. | |
Flame Detectors Market Analysis by Mordor Intelligence
Flame detector market size in 2026 is estimated at USD 1.75 billion, growing from 2025 value of USD 1.68 billion with 2031 projections showing USD 2.15 billion, growing at 4.19% CAGR over 2026-2031. A sizable installed base across hydrocarbon facilities will keep replacement demand steady, while new installations are shifting toward lithium-ion battery warehouses, data centers and green-hydrogen electrolyser plants where hydrogen flames create novel sensing challenges. Stricter global safety rules-most notably the latest ATEX Zone-0 update that elevates SIL-2 certification to a baseline requirement-are nudging buyers toward multi-spectrum infrared (IR) and AI-equipped visual imaging detectors that minimise nuisance alarms and downtime. LNG mega-train construction in Qatar and Saudi Arabia is broadening project pipelines and setting higher performance benchmarks that favour premium solutions. In parallel, North American insurance carriers are linking coverage terms to ultra-low false-alarm specifications, effectively steering procurement toward advanced, diagnostics-rich devices that lower both operational risk and total cost of ownership.
Key Report Takeaways
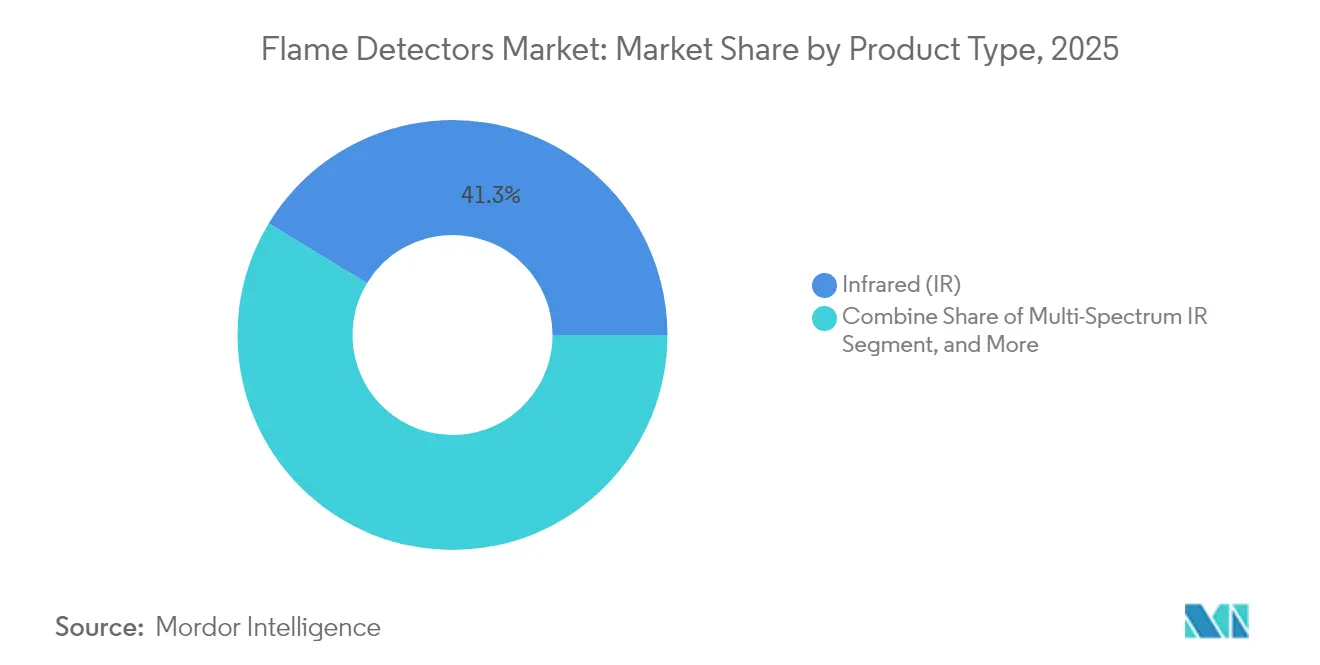
- By product type, infrared detectors led with 41.32% flame detector market share in 2025, while multi-spectrum IR units are forecast to post the fastest 5.02% CAGR through 2031.
- By mounting type, fixed devices commanded 86.05% revenue share in 2025; portable detectors are projected to expand at a 5.84% CAGR to 2031.
- By service, inspection, testing and maintenance captured 51.12% of the flame detector market size in 2025, whereas retrofit and replacement services show the highest 4.34% CAGR to 2031.
- By end-user industry, oil and gas held 36.64% revenue share in 2025, but warehousing and data centers are advancing at a 6.05% CAGR through 2031.
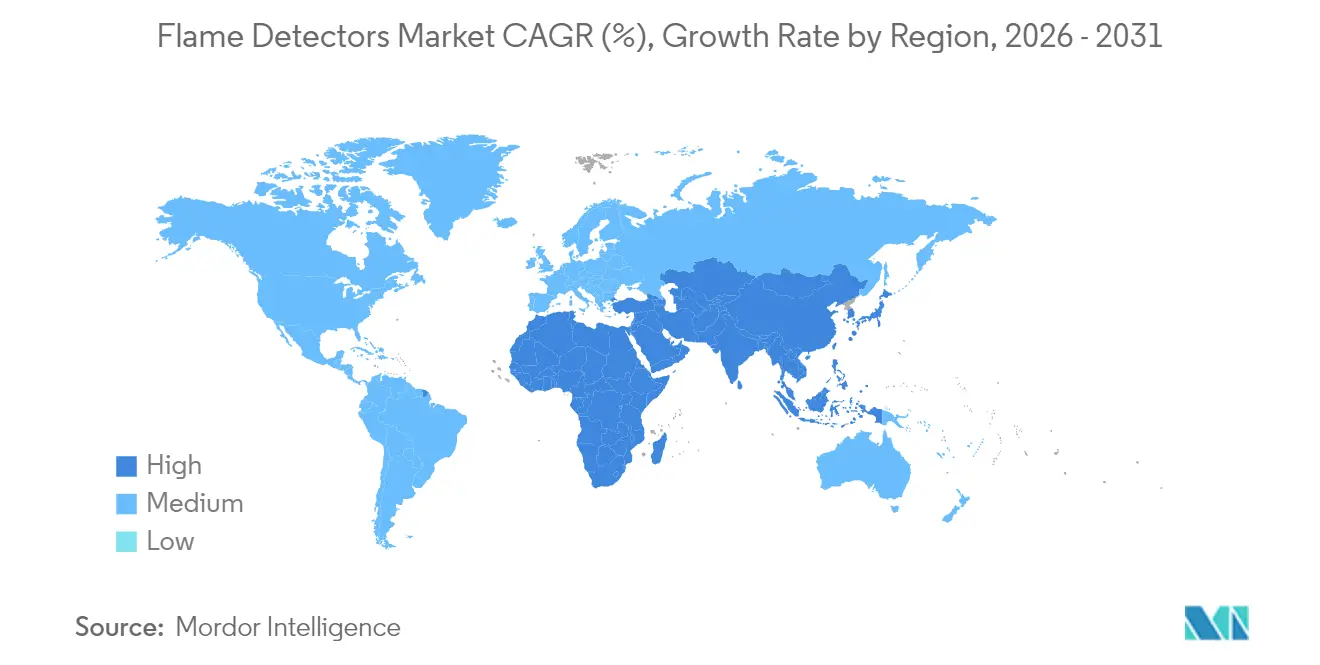
- By geography, North America represented 31.88% of 2025 revenues, while the Middle East is poised for the fastest 5.96% CAGR through 2031.
Note: Market size and forecast figures in this report are generated using Mordor Intelligence’s proprietary estimation framework, updated with the latest available data and insights as of 2026.
Market Trends and Insights
Drivers Impact Analysis of Flame Detectors Market*
| Driver | (≈) % Impact on CAGR Forecast | Geographic Relevance | Impact Timeline |
|---|---|---|---|
| LNG mega-train construction boosting multi-spectrum IR adoption | +0.80% | Middle East & North Africa with spillover to Asia-Pacific | Medium term (2-4 years) |
| Lithium-ion battery data-center demand under FM 5560 | +0.60% | North America & Europe, expanding to Asia-Pacific | Short term (≤ 2 years) |
| ATEX and IECEx Zone-0 revisions mandating SIL-2 detectors | +0.50% | Europe with global replication | Long term (≥ 4 years) |
| Offshore FPSO retrofits adopting AI-enabled visual imaging | +0.40% | Brazil and North Sea, expanding to West Africa | Medium term (2-4 years) |
| Green-hydrogen electrolyser installations lifting UV/IR sales | +0.30% | Asia-Pacific core, early uptake in Japan and South Korea | Long term (≥ 4 years) |
| Insurance underwriting standards for ultra-low false alarms | +0.20% | North America with global influence | Medium term (2-4 years) |
| Source: Mordor Intelligence | |||
LNG mega-train construction boosting multi-spectrum IR adoption
Middle Eastern LNG projects such as the North Field expansion and Jafurah gas development require detectors that can track hydrocarbon fires across wide separators and storage tanks. Plant owners are specifying multi-spectrum IR units to overcome solar radiation interference, a mandate that is elevating premium vendors with multi-band optical arrays and built-in diagnostics. Unmanned process areas reinforce the need for 99.9% device availability, and asset-integrity teams are migrating from time-based to condition-based maintenance models that rely on embedded health monitoring.
Lithium-ion battery data-center demand under FM 5560
FM 5560 now sets detection rules for energy-storage arrays, prompting hyperscale operators to retrofit existing sites with multi-criteria flame detectors that recognise electrolyte off-gas signatures before thermal runaway escalates. The 2024 International Fire Code adds NFPA 855 obligations, tightening compliance timelines for facilities exceeding 50 kWh of installed storage. System integrators are embedding AI classifiers that learn normal battery-module heat profiles to avoid spurious trips that may sideline revenue-critical compute clusters.
ATEX and IECEx Zone-0 revisions mandating SIL-2 detectors
The 2025 revision of the ATEX Directive 2014/34/EU removes legacy exemptions and requires SIL-2 certification in Zone-0 hazardous areas. Certification windows approach 36 months, tipping procurement toward established brands that already possess approved designs and creating an attractive retrofit backlog across European petrochemical and pharmaceutical complexes.
Offshore FPSO retrofits adopting AI-enabled visual imaging
Visual flame imaging paired with deep-learning analytics is cutting nuisance alarm rates by up to 60% on floating production, storage and offloading vessels operated by Petrobras and Equinor. Algorithms evaluate flame morphology and colour to distinguish flare stack activity from uncontrolled events, a vital capability in harsh North Atlantic and Brazilian environments where salt spray impairs UV/IR optics.
Restraints Impact Analysis of Flame Detectors Market*
| Restraint | (≈) % Impact on CAGR Forecast | Geographic Relevance | Impact Timeline |
|---|---|---|---|
| Low-cost Chinese IR cameras eroding premium revenue | -0.70% | Price-sensitive global markets | Short term (≤ 2 years) |
| Dirty-optics downtime limiting underground-mining uptake | -0.40% | Australia, South Africa, Chile | Medium term (2-4 years) |
| Lengthy FM & EN54-10 approval cycles delaying launches | -0.30% | Global | Long term (≥ 4 years) |
| Cybersecurity concerns over networked detectors | -0.20% | North America & Europe | Medium term (2-4 years) |
| Source: Mordor Intelligence | |||
Low-cost Chinese IR cameras eroding premium revenue
Thermal-imaging vendors from China are releasing IR flame detectors priced 40-60% lower than Western equivalents, gaining traction in mid-tier industrial sites that do not mandate SIL-2 ratings . [3] Western manufacturers are countering with lifecycle cost models that monetise false-alarm reductions and longer service intervals.
Dirty-optics downtime limiting underground-mining uptake
In coal and hard-rock mines, dust accumulation on detector lenses demands weekly cleaning, lowering effective availability and raising labour costs. Operators often default to suppression-only strategies rather than installing optical detectors, limiting revenue upside in a sector otherwise prone to conveyor-belt and equipment fires.
*Our forecasts treat driver/restraint impacts as directional, not additive. The impact forecasts reflect baseline growth, mix effects, and variable interactions.
Flame Detectors Market Segment Analysis
By Product Type:
Multi-Spectrum IR Drives Premium Segment GrowthInfrared devices captured 41.32% of 2025 revenue, underpinning the flame detector market with a long record of hydrocarbon-fire reliability. Adoption persists in refineries, terminals and petrochemical plants where users value proven single-channel optics. Yet the multi-spectrum IR sub-category is forecast to expand at 5.02% CAGR because it blends three or more wavelength bands to reject solar glare and hot-surface reflections. Operators in unmanned LNG trains see the higher capital spend as justifiable insurance against costly process shutdowns. Visual flame imaging is growing fastest as algorithms mature and price points fall, allowing simultaneous detection and root-cause analytics. UV detectors remain the niche solution for hydrogen or metal-combustion risks, while combined UV/IR units balance performance and cost in mixed-fuel installations.
In tandem, AI-ready sensor firmware is turning detectors into edge-computing nodes that self-diagnose lens obscuration and optical degradation. Remote firmware upgrades further shorten maintenance cycles. This trend is nudging engineering, procurement and construction (EPC) teams to specify cloud-connected devices despite cybersecurity reservations. The flame detector market benefits because predictive analytics underpin value-added service agreements that stretch beyond warranty periods, boosting aftermarket margins for manufacturers with integrated software roadmaps.

By Mounting Type:
Portable Growth Reflects Inspection IntensificationFixed detectors delivered 86.05% of 2025 billings and remain the backbone for continuous zone coverage in process areas, jetty off-loading points and compressor stations. Layouts rarely change over asset lifecycles, keeping demand tied to replacement and regulatory upgrades rather than greenfield projects. Portable detectors, however, are accelerating at a 5.84% CAGR as operators adopt test-before-touch safety procedures. Inspection teams validate fixed-system integrity during turnarounds without halting production, and first responders carry handheld units to quickly assess unknown scenes.
Battery density improvements have doubled mission time for portable devices while maintaining sensitivity parity with fixed platforms. Rugged enclosures and intrinsically safe ratings now enable safe use in Zone-1 locations. The result is a complementary relationship rather than a competitive one: rising portable uptake does not cannibalise fixed demand but instead banks additional revenue on every maintenance cycle. The flame detector market therefore gains two revenue streams from the same installed base: capital expenditure on fixed points and operational expenditure on portable verification equipment.
By Service:
Retrofit Segment Accelerates Amid Aging InfrastructureInspection, testing and maintenance accounted for 51.12% of 2025 service revenue, illustrating the market’s pivot from hardware supply to lifecycle support. Regulatory bodies increasingly require proof of detector performance integrity, and operators are outsourcing verification to OEM-trained technicians. Retrofits—spanning optical upgrades, smarter communication cards and SIL-2 certification replacements—are forecast for a 4.34% CAGR as industrial clients chase compliance deadlines under ATEX, IECEx and FM. Service providers are bundling cloud dashboards that log calibration drift, alarm events and environmental conditions, allowing predictive maintenance scheduling.
Design, installation and commissioning work retains a stable footing thanks to record LNG, data-center and green-hydrogen capacity additions. Yet the greatest margin upside now lies in five-year support contracts that guarantee mean-time-between-failures and embed consumables such as lens heaters and weather shields. The flame detector market is therefore evolving toward an annuity model where services may overtake hardware revenues near the end of the decade.
By Communication/Loop:
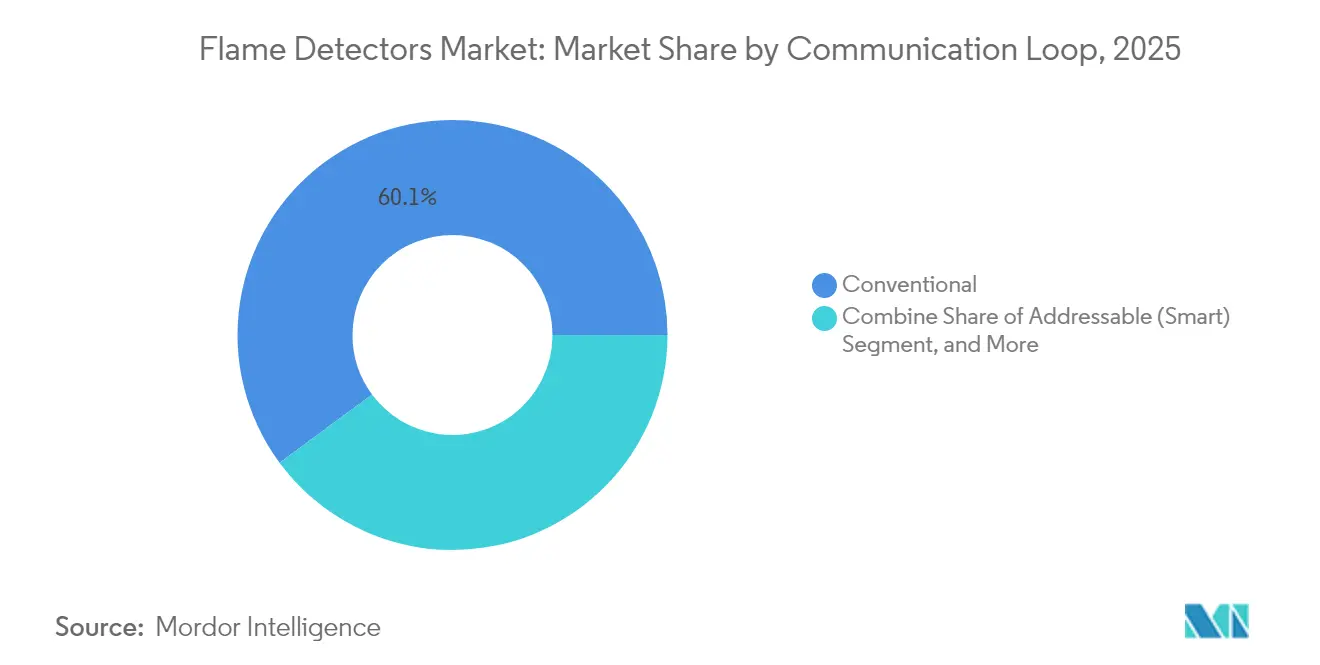
Smart Detectors Gain Despite Cybersecurity ConcernsConventional detectors still represented 60.12% of 2025 shipments because analog loops are rugged and easy to troubleshoot. Addressable smart detectors, with a forecast 6.74% CAGR, promise serialised device identification, continuous health polling and remote firmware updates. These capabilities reduce field visits and keep safety systems online. Facility owners weigh those benefits against new cyber-attack surfaces introduced by Ethernet or wireless protocols. Mitigation strategies include dedicated, air-gapped safety LANs and encryption under IEC 62443 guidelines.
Vendors now pre-install secure bootloaders and signed firmware, making tampering evident to control-room operators. Asset owners can then lock software versions through change-management processes. Successful deployments in North American chemical plants demonstrate that cybersecurity is a manageable variable rather than a deal-breaker, keeping smart devices on a growth trajectory that outpaces the overall flame detector market.
By End-User Industry:
Data Centers Challenge Oil & Gas DominanceOil and gas preserved a 36.64% revenue share in 2025 as flaring, loading and compressor facilities present sustained thermal-hazard density. Yet data centers and automated warehouses are advancing at 6.05% CAGR, propelled by lithium-ion battery racks that introduce fast-spreading fire dynamics. Hyperscale operators are reallocating capex from legacy smoke-only arrays to integrated flame and gas detection suites that recognise battery off-gas well before visible flame. Chemicals and petrochemicals maintain stable demand, driven by greenfield complexes in East Asia and mandatory upgrades in the European Union.
Manufacturing segments benefit from sensors that protect robotic lines where human vigilance is no longer the primary safety control. Aerospace and defense, while small in absolute size, require Class-A reliability ratings that command premium prices. Mining remains constrained by dust-management challenges, but field trials of sealed optical windows and air-purge systems could unlock latent demand by mid-decade.
Geography Analysis
North America Flame Detectors Market
North America led the flame detector market with 31.88% of 2025 revenue, supported by insurance mandates that link policy premiums to ultra-low false-alarm rates. Mature refining and chemical assets drive steady replacement cycles, and new rules under FM 5560 are expanding detector counts per facility. The region also pioneers addressable smart loops, backed by cybersecurity frameworks that assure underwriters and regulators of network resilience.
GCC Flame Detectors Market
The Middle East shows the highest 5.96% CAGR forecast to 2031 thanks to USD 200 billion in LNG expansions that require stringent flame supervision across train, storage and jetty areas. Harsh desert conditions favour stainless-steel housings, window heaters and optical diagnostics that predict sand abrasion. Successful deployments in Qatar are migrating to neighbouring GCC states, creating a technology lighthouse effect that shapes global specifications.
Europe, APAC and South America Flame Detectors Market
Europe continues to invest in detector retrofits to comply with the updated ATEX Zone-0 and SIL-2 mandates. Multinational petrochemical operators are standardising on the same certified model across global sites, amplifying replacement demand beyond the continent. Asia-Pacific’s growth rests on industrial electrification agendas, notably Japan and South Korea’s hydrogen roadmaps that elevate UV/IR detector counts in electrolyser halls.. South America’s offshore pre-salt finds need AI-enabled visual imaging to discriminate flare bundles from deep-sea production decks.
Regulatory Landscape
Flame detectors are governed by performance and system-integration standards, notably ISO 7240-10 and EN 54-10 for flame detector performance, and NFPA 72 for fire alarm and signaling system application in the United States. In hazardous locations, devices also have to comply with explosion-protection frameworks such as the IEC 60079 series and the ATEX Directive 2014/34/EU in Europe, with market access commonly anchored on third-party certificates from bodies such as FM Approvals, LPCB (including LPS 1976 for video-based detection), and SGS Baseefa for Ex-rated equipment.
The compliance environment is being refreshed through region-specific updates that affect qualification timelines and documentation. China issued GB 12791-2025 for point-type flame detectors on October 31, 2025 (superseding older national standards) with implementation scheduled for November 1, 2026, which is prompting portfolio re-testing and re-certification for suppliers active in China. In Europe, Implementing Regulation (EU) 2025/625 supports certification requirements linked to stationary fire protection equipment and personnel handling certain fluorinated greenhouse gases, adding another layer of conformity management alongside ATEX and construction-related declarations in relevant installations.
Value Chain Analysis
The flame detector value chain begins with optical and electronic inputs (IR sensors, UV tubes/photodiodes, multi-band filters, lenses/windows, housings, PCB assemblies, and firmware) that feed OEM design and certification workstreams. Certification and test houses (for example FM Approvals for industrial listings, LPCB for schemes such as LPS 1976 where applicable, and notified bodies for ATEX/IECEx) act as gatekeepers between product engineering and commercialization, while system integrators and EPC contractors translate detector selection into complete fire-and-gas architectures that connect to controllers, notification, and suppression layers.
Downstream, distribution and commissioning depend on regional partner networks, site-specific hazardous-area classification, and aftersales service capacity (inspection, testing, maintenance, and retrofit). Recent localization moves in the Middle East show how manufacturing footprints and approved-vendor status shape supply access: Teledyne Gas and Flame Detection opened a 699 square meter manufacturing facility in Dammam, Saudi Arabia on June 19, 2025 with Industrial Detection Solutions to produce sensors locally, and vendor approvals such as Saudi Aramco and ADNOC (reported for Fire & Gas Detection Technologies, Inc. in July 2025) influence which brands are specified on large energy projects. Standards updates also ripple through the chain by triggering requalification and documentation cycles, including China’s GB 12791-2025 (effective November 2026) and evolving EN/IEC hazardous-location requirements that extend lead times for compliant SKUs.
Competitive Landscape
Leading manufacturers Honeywell, Emerson and MSA Safety anchor the moderate-fragmentation profile through integrated fire-and-gas platforms that combine detectors, controllers and suppression systems. Continuous R&D investment is funnelled into multi-spectrum optics, AI classifiers and cyber-hardened firmware, translating into premium‐priced offerings that meet SIL-2 and FM certification without long approval lags. Honeywell’s earlier acquisition of Fire Sentry broadened its IR and UV/IR range, allowing cross-portfolio bundling in EPC bids. [2]
Chinese firms such as Hikvision and Jade Bird Fire are pushing commoditised IR solutions into price-sensitive markets. Their stepped-up pursuit of FM and ATEX approvals suggests future competition in higher-spec segments. Western incumbents respond with outcome-based service contracts that guarantee detector availability and tie penalties to unwanted trips, thereby reinforcing customer stickiness. White-space opportunities in hydrogen production and data-center energy storage are spurring niche specialists to design purpose-built optics and filters.
Lifecycle services are turning into the core battleground. Vendors now offer five-year inspection bundles with cloud dashboards that flag optical contamination and spectral-filter decay. The flame detector market is thus tilting toward solutions that wrap hardware, analytics and support into a single procurement line. This integrative approach poses a barrier to new entrants who can offer sensors but not the full spectrum of compliance and maintenance capabilities.
Flame Detectors Industry Leaders
-
Honeywell International Inc.
-
Emerson Electric Co. (Det-Tronics and Spectrex)
-
Johnson Controls plc (Tyco/Kidde)
-
MSA Safety Incorporated
-
Siemens AG
- *Disclaimer: Major Players sorted in no particular order
Flame Detectors Market Companies Covered in this Report
- Honeywell International Inc.
- Emerson Electric Co. (Det-Tronics, Spectrex)
- Johnson Controls plc (Tyco)
- MSA Safety Inc.
- Siemens AG
- Bosch Security Systems B.V.
- Drägerwerk AG and Co. KGaA
- Teledyne Gas and Flame (Simtronics, Oldham)
- 3M Co. (Scott Safety)
- Micropack Engineering Ltd.
- FLIR Systems (Teledyne)
- Hochiki Corporation
- Crowcon Detection Instruments Ltd.
- Fike Corporation
- Minimax Viking GmbH
- Firefly AB
- Sense-WARE Fire and Gas Detection B.V.
- Omniguard Flame Detectors
- General Monitors (now part of MSA)
- Kidde Fire Safety (Carrier)
Market Opportunities and Future Outlook
Opportunity is expanding in applications that require higher selectivity and longer-range coverage, where operators focus on reducing nuisance alarms and extending maintenance intervals in large, unmanned, or harsh environments (LNG trains, jetties, tank farms, and offshore assets). Product introductions in 2026 reinforce active differentiation in extreme-range IR3 performance: Micropack Safety introduced FDS303 Ultra Mode with an FM-witnessed 160 meter detection range for a 1 ft square n-heptane pan fire (March 2026), and Patol announced the Optect LR16 with long-range performance claims, including single-flame detection at 100 meters (April 2026). These launches feed procurement discussions around fewer devices per protected area, simplified layouts for wide perimeters, and higher-value service bundles tied to diagnostics.
Hydrogen and electrified infrastructure also create whitespace for detectors tuned to low-radiance or hard-to-see flames and mixed-fuel risks, especially in electrolyser halls, battery energy storage rooms, and data-center or warehouse environments where expectations for detection are tightening. Teledyne Gas and Flame Detection’s Spyglass Xtend triple-infrared detector launch (February 2025) positioned a single device for both hydrogen and hydrocarbon fires, which aligns with sites managing blended hazards and seeking to standardize spares and maintenance procedures. Alongside technology, compliance and certification capacity remains a practical lever for market expansion; long approval cycles (FM and EN 54-10) and the effective date of China’s GB 12791-2025 in November 2026 continue to raise the value of vendors and partners that can navigate multi-region certification and sustain lifecycle support at scale.
Recent Industry Developments in Flame Detectors Market
- July 2026: MSA Safety completed its acquisition of Autronica Fire and Security for approximately USD 555 million. The deal expands MSA Safety’s fixed fire and gas detection and integrated alarm system capabilities, which strengthens its position in end markets such as energy, critical infrastructure, and marine where flame detection is specified as part of larger safety systems.
- January 2025: Warringtonfire opened a USD 30 million fire-resistance test laboratory at Birchwood Park. The added certification and testing capacity helps shorten approval bottlenecks that can delay launches and retrofits tied to standards and third-party listings for flame detection equipment.
- June 2024: Sentinel Capital Partners carved out Carrier’s industrial fire unit to form Spectrum Safety Solutions, bringing Autronica’s detector portfolio under a focused industrial safety platform. The carve-out sharpened competitive dynamics by creating a standalone organization centered on industrial fire detection and lifecycle service delivery.
Flame Detectors Market Report Scope and Research Methodology
Market Definition and Coverage
The flame detectors market is defined as the revenue generated from dedicated devices that detect flames using optical sensing and are sold for use in industrial and commercial safety systems. This includes fixed installations and related detector accessories.
Scope exclusions: We exclude flame sensing modules that are only embedded inside larger OEM equipment and are not sold as a standalone flame detection product.
Segments Covered in This Report
- By Product Type
- Ultraviolet (UV)
- Infrared (IR)
- Ultraviolet/Infrared (UV/IR)
- Multi-Spectrum IR (Triple/Quad)
- Visual Flame Imaging
- Combined Gas and Flame Detectors
- By Mounting Type
- Fixed Flame Detectors
- Portable/Hand-held Flame Detectors
- By Service
- Design, Installation and Commissioning
- Inspection, Testing and Maintenance
- Retrofit and Replacement
- By Communication/Loop
- Addressable (Smart) Detectors
- Conventional Detectors
- By End-User Industry
- Oil and Gas (Up-, Mid-, Down-stream)
- Chemicals and Petrochemicals
- Energy and Power Generation
- Manufacturing and Process Industries
- Mining and Metals
- Aerospace and Defense
- Warehousing, Logistics and Data-Centers
- Marine and Offshore
- Commercial and Public Infrastructure
- By Geography
- North America
- United States
- Canada
- Mexico
- Europe
- Germany
- United Kingdom
- France
- Nordics
- Rest of Europe
- South America
- Brazil
- Rest of South America
- Asia-Pacific
- China
- Japan
- India
- South-East Asia
- Rest of Asia-Pacific
- Middle East and Africa
- Middle East
- Gulf Cooperation Council Countries
- Turkey
- Rest of Middle East
- Africa
- South Africa
- Rest of Africa
- Middle East
- North America
Data Sources, Market Sizing, and Validation
Desk Research
For desk research, we start by building a fact base around fire incidents, industrial activity, and safety compliance needs that typically pull flame detectors into projects. Public sources used for this step include OSHA guidance and enforcement updates, NFPA codes and handbooks, NIST fire research publications, U.S. EIA energy statistics, and the U.S. Census Bureau for industrial output signals.
We also review company annual reports, investor presentations, product catalogs, and technical datasheets, along with credible press coverage, to understand typical detector types, replacement cycles, and where adoption is expanding (for example, new energy facilities and hazardous process plants). Where needed, paid database subscriptions are used for company financials and intelligence, patent lookups, and shipment-level import and export checks to sanity test regional supply patterns. The specific list above is not exhaustive, and many other sources were used for data collection, cross-checking, and clarification.
Primary Interviews and Surveys
Primary work is used to pressure test our assumptions on where detectors are actually specified, how pricing moves by technology, and what replacement and retrofit demand looks like in the field. We spoke with stakeholders across the value chain, including manufacturers, distributors, system integrators, and end users in process industries, and we covered the major regions so regional code enforcement and project cycles were not treated as identical everywhere.
Distribution of primary research fieldwork respondents
| Company type | Respondent position | Region |
|---|---|---|
| Top tier: 36% | CXOs: 13% | APAC: 42% |
| Mid tier: 49% | Functional/Unit leaders: 42% | EMEA: 34% |
| Smaller Players: 15% | Managers: 45% | Americas: 24% |
Market-Sizing & Forecasting
Sizing is built using a top-down and bottom-up approach where global and regional demand pools are reconstructed from industrial activity and safety spending signals, then checked using selective supplier and channel math. In practice, we map the installed base and new project creation in high-risk sites first, and then translate that into detector unit demand and value using realistic average selling price bands by detector technology.
Key model inputs include oil and gas and petrochemical project activity, LNG and midstream capacity additions, industrial capex cycles, fire and safety code enforcement intensity, detector replacement intervals, and the mix shift across UV, IR, UV/IR, and multi spectrum IR systems. For forecasting, scenario analysis reflects how project delays, energy price swings, and plant utilization changes can move annual demand, and the outlook is refined using expert views on bidding pipelines and specification trends. Where bottom-up visibility is weaker in smaller regions, we fill gaps through proxy indicators such as facility counts and hazardous area expansion, and we keep assumptions conservative until validated in calls.
Data Validation & Update Cycle
Outputs are validated through multiple checks, where computed totals are compared against independent signals such as regional industrial investment, safety system deployment trends, and trade flow directionality. If a region or technology shows a sharp jump, we review the drivers, revisit assumptions, and trigger follow-up conversations to confirm whether the change is real or a data artifact.
Before sign-off, the model goes through analyst review steps that include variance checks by region, cross-year consistency tests, and logic checks on price and volume movement. Reports are refreshed annually, and interim updates are made when material events occur, such as regulation changes or major project cycle shifts. Before delivery, a fresh pass is done so clients receive the latest updated view available at that time.
Mordor Intelligence's Flame Detectors Market Size Compared With Other Published Estimates
Published market sizes for flame detectors often differ because the scope line is drawn differently and because pricing and adoption assumptions are updated on different schedules. Differences can also come from whether a study counts only standalone detector products or includes adjacent safety system content that is priced and bought in a different way.
The main gap comes from what gets counted as a sellable flame detector, where Mordor Intelligence includes factory-calibrated optical detectors sold as discrete products (UV, IR, UV/IR, multi spectrum IR, and visual imaging types) and leaves out sensing elements that are only embedded inside larger OEM machinery. Other estimates may also apply faster ASP escalation or assume a higher share of premium multi spectrum detectors across all regions, even when field feedback indicates slower mix shifts outside heavy process industries.
Benchmark comparison
| Source | Market Size | Gaps in Research Methodology |
|---|---|---|
| Mordor Intelligence | USD 1.75 B (2026) | |
| Global Consultancy A | USD 1.56 B (2026) | Uses a narrower product scope that appears to undercount visual imaging and some multi spectrum detector revenues, and it leans more on manufacturer-side definitions without sufficient adjustment for system-integrator channels. |
| Trade Publisher B | USD 2.01 B (2025) | Reports a factory-gate style value for a different base year, which can lift totals if related services are bundled and if currency timing and price updates are not aligned to a single reference year. |
Across the table, most of the spread can be traced back to scope choices, base-year alignment, and how pricing and mix change are handled. By keeping inclusions tied to standalone detector sales and sanity checking assumptions with real project and replacement signals, we keep the final number traceable to clear variables and repeatable steps.
Key Questions Answered in the Report
What is the current size of the flame detector market?
The flame detector market size reached USD 1.75 billion in 2026 and is projected to grow to USD 2.15 billion by 2031.
Which region will grow fastest through 2031?
The Middle East leads with a forecast 5.96% CAGR thanks to USD 200 billion in LNG mega-train investments that require advanced flame monitoring.
Why are multi-spectrum IR detectors gaining traction?
Multi-spectrum IR devices analyse several wavelength bands simultaneously, cutting false-alarm rates in sunny or hot industrial environments and meeting new insurance and ATEX Zone-0 requirements.
How are lithium-ion battery installations affecting market demand?
Data centers and warehouses with energy-storage systems must comply with FM 5560 and NFPA 855, driving adoption of smart flame detectors capable of detecting electrolyte off-gas before thermal runaway escalates.