
Fixed Wireless Access Market Size and Share
Market Overview
| Study Period | 2020 - 2031 |
|---|---|
| Market Size (2026) | USD 43.47 Billion |
| Market Size (2031) | USD 84.37 Billion |
| Growth Rate (2026 - 2031) | 14.18 % |
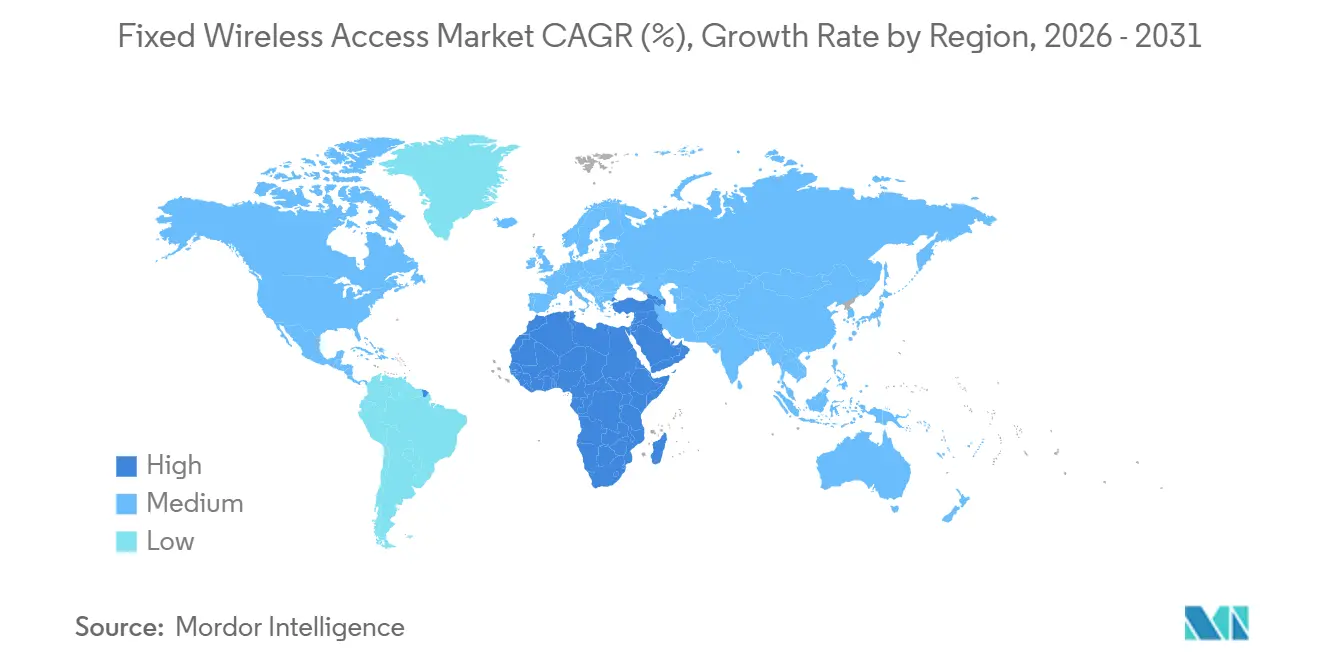
| Fastest Growing Market | Africa |
| Largest Market | North America |
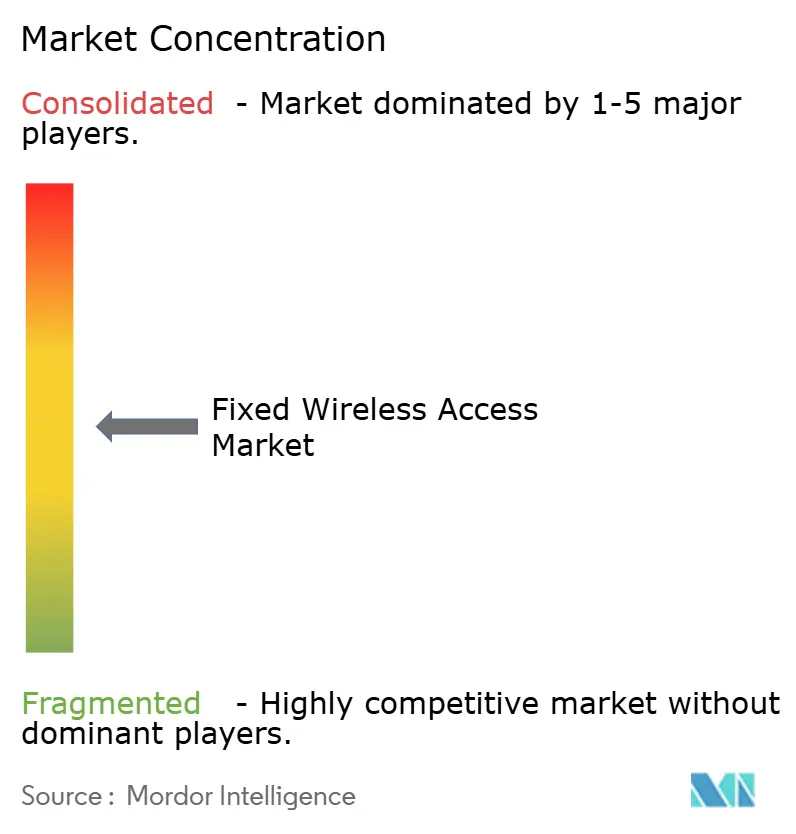
| Market Concentration | Medium |
Major Players *Disclaimer: Major Players sorted in no particular order Image © Mordor Intelligence. Reuse requires attribution under CC BY 4.0. | |
Fixed Wireless Access Market Analysis by Mordor Intelligence
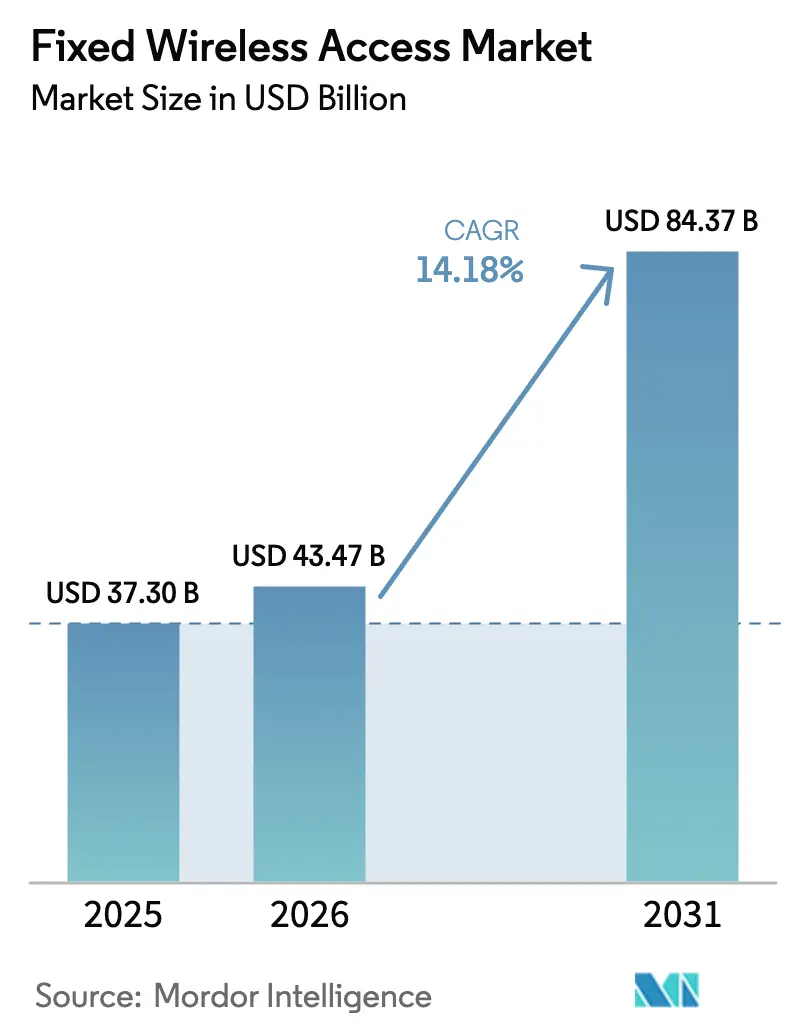
The Fixed Wireless Access Market size is expected to increase from USD 37.30 billion in 2025 to USD 43.47 billion in 2026 and reach USD 84.37 billion by 2031, growing at a CAGR of 14.18% over 2026-2031.
Ongoing 5G mid-band rollouts, nationwide spectrum allocations, and AI-enabled customer-premise equipment are tipping the economics of last-mile connectivity in favor of wireless, especially in suburban and rural zones. Operators are leaning on fixed wireless because trench-and-conduit fiber builds remain expensive, while policy makers have declared FWA an eligible technology under multiple broadband stimulus programs. Hardware still generates most revenue, yet services are expanding faster as carriers pivot toward recurring subscriptions, managed security, and SD-WAN backup packages. Residential demand dominated in 2025, but government, public-safety, and enterprise users are now adopting FWA for rapid disaster recovery and branch resilience. Across bands, sub-6 GHz spectrum supplies the core coverage footprint, whereas mmWave supports multi-gigabit speeds in high-rise districts where population density justifies dense small-cell grids.
Key Report Takeaways
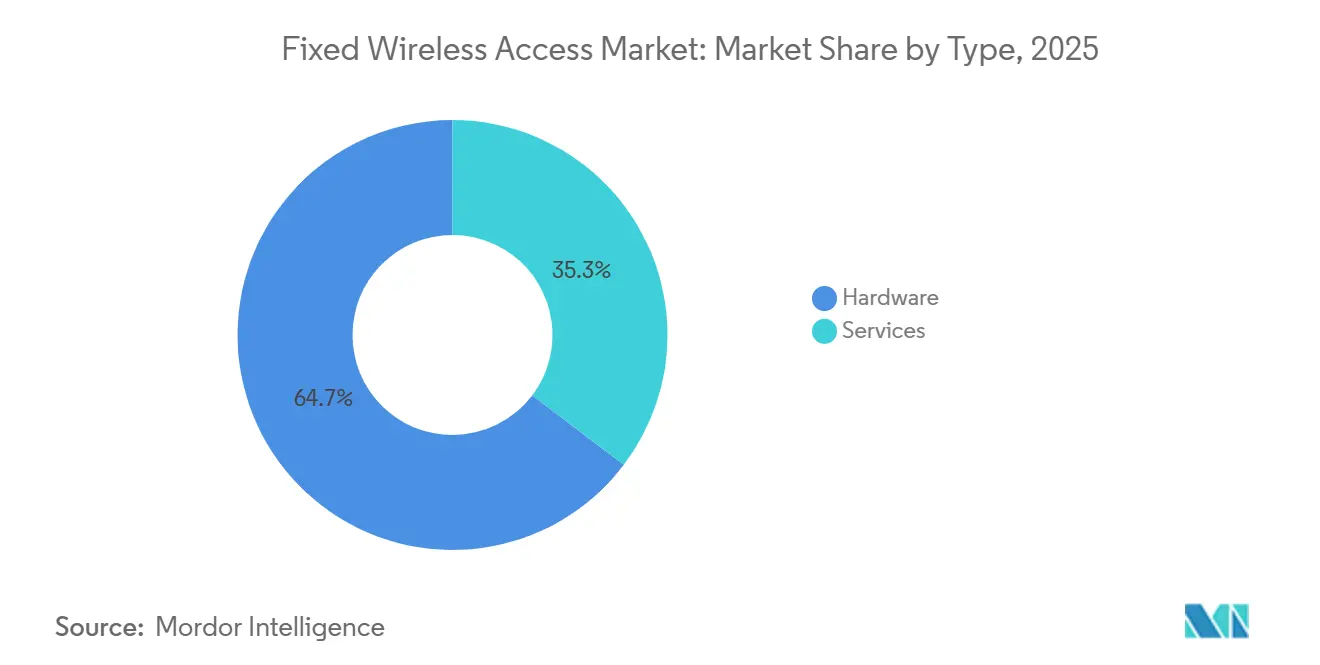
- By type, hardware led with 64.68% revenue share in 2025, while services are forecast to advance at a 15.36% CAGR through 2031.
- By application, residential connections captured 71.91% share in 2025, whereas government and public safety usage is predicted to grow at 14.77% CAGR to 2031.
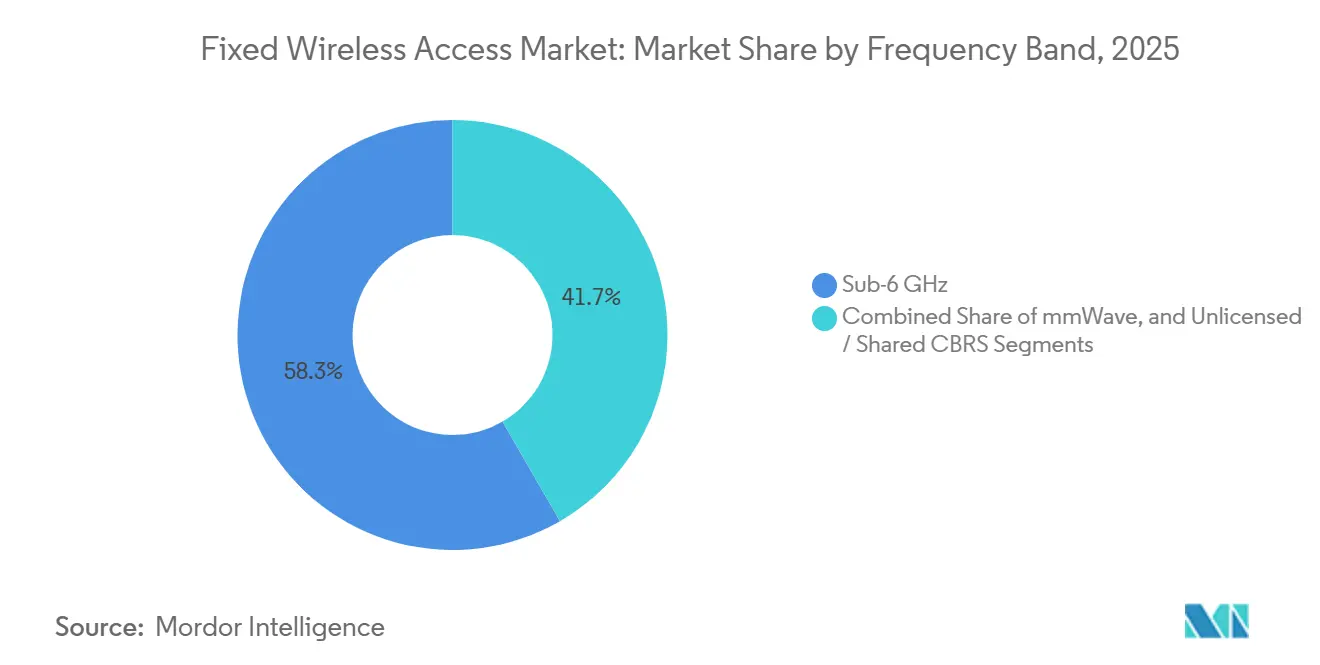
- By frequency band, sub-6 GHz held 58.33% of the Fixed Wireless Access market share in 2025, while mmWave deployments are set to expand at 14.47% CAGR over the outlook.
- By deployment mode, indoor CPE commanded a 67.47% share of the Fixed Wireless Access market size in 2025, yet self-install window-mount units are on track to rise at 14.53% CAGR to 2031.
- By geography, North America generated 33.56% of 2025 revenue, whereas Africa is expected to post the fastest regional CAGR at 15.06% through 2031.
Note: Market size and forecast figures in this report are generated using Mordor Intelligence’s proprietary estimation framework, updated with the latest available data and insights as of January 2026.
Market Trends and Insights
Drivers Impact Analysis of Fixed Wireless Access Market*
| Driver | ( ~ ) % Impact on CAGR Forecast | Geographic Relevance | Impact Timeline |
|---|---|---|---|
| 5G roll-out accelerating gigabit-class FWA | +3.2% | North America and Asia-Pacific first movers | Medium term (2-4 years) |
| Rural broadband stimulus programmes | +2.8% | North America, Europe, select Asia-Pacific markets | Medium term (2-4 years) |
| FWA as cost-effective last-mile alternative to fiber | +2.5% | Global suburban and rural zones | Long term (≥ 4 years) |
| Enterprise SD-WAN backup connectivity demand | +1.9% | Enterprise hubs worldwide | Short term (≤ 2 years) |
| Spectrum auction design favoring mid-band sharing | +1.6% | North America, Europe, Middle East | Medium term (2-4 years) |
| AI-optimized CPE self-install reducing truck rolls | +1.4% | Highest uptake in North America | Short term (≤ 2 years) |
| Rise of corporate net-zero targets driving wireless power-efficient access | +1.2% | North America and Europe | Long term (≥ 4 years) |
| Source: Mordor Intelligence | |||
5G Rollout Accelerating Gigabit-Class FWA
Mid-band 5G between 3.3 GHz and 4.2 GHz combines coverage and capacity, making gigabit-class FWA commercially viable. U.S. operators launched 5G home internet in more than 70 metropolitan areas during 2024, delivering median download speeds above 300 Mbps and peaks above 1 Gbps. Carriers in Japan, South Korea, and India mirrored this push, using existing mobile sites to avoid long fiber build-outs. Per-bit delivery cost falls by roughly 40% when operators shift from LTE to 5G New Radio, allowing competitive pricing against cable incumbents. Industry forecasts show global FWA connections exceeding 330 million by 2029, with 5G accounting for nearly all net additions after 2026.
Rural Broadband Stimulus Programmes
The United States BEAD initiative earmarked USD 42.45 billion in 2024 for unserved locations and explicitly labeled FWA as an acceptable solution.[1] States such as Texas and Montana are directing funds toward wireless builds where fiber costs exceed USD 10,000 per passing. Europe’s Digital Decade policy takes a similar stance, permitting FWA in areas where fiber economics are unfavorable, provided symmetrical 100 Mbps is guaranteed. India’s BharatNet Phase III and Australia’s Regional Broadband Scheme also include FWA eligibility, anchoring multi-year demand pipelines.
FWA as Cost-Effective Last-Mile Alternative to Fiber
Fiber-to-the-home construction averages USD 2,500-USD 5,000 per passing in U.S. suburbs, whereas FWA capex runs USD 300-USD 800 per subscriber, including radio and CPE.[2] This 5-to-10x cost edge shortens payback to less than two years when neighborhood penetration tops 20%. Operators bypass trenching, permitting, and right-of-way delays, reducing time to market from more than a year for fiber to fewer than six months for FWA. South African, Mexican, and Brazilian carriers apply the same model to leapfrog copper loops and reach underserved households.
Enterprise SD-WAN Backup Connectivity Demand
Businesses adopt FWA as a secondary link that kicks in instantly when terrestrial fiber goes down. SD-WAN orchestration from leading router vendors automates failover, ensuring video meetings and cloud workflows stay live. Carriers bundle gigabit-class FWA with managed security and monitoring, creating high-margin service tiers. Financial, healthcare, and retail chains cite resilience mandates and hybrid work as purchase drivers. Enterprises also subsidize FWA for remote employees who face unreliable cable connections.
Restraints Impact Analysis of Fixed Wireless Access Market*
| Restraint | ( ~ ) % Impact on CAGR Forecast | Geographic Relevance | Impact Timeline |
|---|---|---|---|
| Spectrum scarcity and regulatory uncertainty | -1.8% | Asia-Pacific and Europe hot spots | Medium term (2-4 years) |
| High mmWave densification capex | -1.5% | Urban cores worldwide | Long term (≥ 4 years) |
| Fiber price erosion compressing FWA ARPU | -1.3% | Americas, Europe, parts of Asia-Pacific | Medium term (2-4 years) |
| Weather-induced signal degradation in mmWave bands | -0.9% | Tropical and monsoon climates | Short term (≤ 2 years) |
| State-aid rules limiting subsidised FWA deployments | -0.3% | European Union (EU) Member States | Medium term (2-4 years) |
| Source: Mordor Intelligence | |||
Fiber Price Erosion Compressing FWA ARPU
Cable and fiber incumbents lowered gigabit tariffs by up to 20% during 2024-2025, squeezing average revenue per user for wireless competitors. Some carriers now bundle FWA with mobile unlimited plans, discounting combined service by USD 10-USD 25 to sustain subscriber growth. The strategic pivot shifts competition from pure price to experiential factors such as rapid self-installation, month-to-month contracts, and responsive customer support.
Weather-Induced Signal Degradation in mmWave Bands
Millimeter-wave signals above 24 GHz attenuate sharply in heavy rain, losing more than 10 dB per kilometer at precipitation rates above 25 mm per hour.[3] Operators counter by adopting dual-band CPE that falls back to sub-6 GHz during storms, yet this design raises device costs. In tropical zones, carriers limit mmWave to short-range links or indoor mesh deployments, restricting its market footprint.
*Our forecasts treat driver/restraint impacts as directional, not additive. The impact forecasts reflect baseline growth, mix effects, and variable interactions.
Fixed Wireless Access Market Segment Analysis
By Type Hardware and Services
Hardware accounted for 64.68% of 2025 revenue, mirroring the installed base of indoor gateways, outdoor units, and small-cell radios. Despite this lead, services revenue is set to outpace hardware at 15.36% CAGR through 2031, as operators lean on subscription models for stable cash flow. The Fixed Wireless Access market size for services is projected to rise from USD 15.4 billion in 2026 to nearly USD 32 billion by 2031. Subsidized or zero-cost CPE tactics accelerate subscriber onboarding, letting carriers recoup device spend over 24- or 36-month plans.
Managed-service offerings span network monitoring, cloud-hosted security, and real-time quality analytics. Deutsche Telekom’s machine-learning engine predicts device failure and dispatches replacements before outages occur, cutting churn and service calls. Access-unit shipments are also shifting toward multi-role devices that double as mesh nodes, reducing backhaul costs and expanding indoor reach.
By Application Residential and Government Leadership
Residential demand captured 71.91% of 2025 connections, underpinning FWA’s original value proposition as a cable and DSL substitute. Yet government and public-safety users now represent the fastest-growing slice, advancing at 14.77% CAGR on resilience mandates. First responder agencies in the United States gained 5G-certified FWA gear for mobile command posts in 2024, while Japan’s prefectural governments must equip backup wireless links by 2026.
Commercial chains favor FWA for rapid store openings when leased lines are unavailable on short notice. Coffee shops, logistics warehouses, and hospitality venues report lower total connectivity cost and faster provisioning than legacy DSL. Industrial campuses see value in private 5G slices that support robotics and low-latency automation, expanding the Fixed Wireless Access market beyond pure broadband.
By Frequency Band Sub-6 GHz and mmWave
Sub-6 GHz frequencies delivered 58.33% of 2025 revenue due to their wide coverage radius and better building penetration. The Fixed Wireless Access market size tied to these bands remains dominant, yet mmWave is rising at 14.47% CAGR, unlocking 2-4 Gbps speeds in skyscraper clusters. U.S. carriers demonstrated peaks above 4 Gbps in dense cores, while Korean operators achieved 2 Gbps service in Seoul’s Gangnam district.
Concurrent growth is visible in shared CBRS bands, which allow enterprises and regional ISPs to deploy wireless broadband without buying spectrum licenses. Neutral-host campus networks running in 3.55-3.7 GHz slots serve stadiums and airports, widening the addressable customer base.

By Deployment Mode Indoor, Outdoor, and Self-Install
Indoor gateways made up 67.47% of deployment share in 2025, but self-install window-mount devices will rise at 14.53% CAGR as AI-driven beam-forming cuts set-up time from hours to minutes. One national carrier reports 90% self-install success, eliminating costly truck rolls that historically consumed up to 30% of first-year revenue.
Outdoor CPE remains vital in low-density areas where stronger signal is mandatory. Hybrid designs featuring detachable antennas are gaining traction, combining the simplicity of indoor units with the reach of rooftop gear. Vendors are converging toward integrated Wi-Fi 7 and 6 GHz support, preparing for bandwidth-intensive applications such as cloud gaming and VR streaming.
Geography Analysis
North America Fixed Wireless Access Market
North America generated 33.56% of 2025 revenue, buoyed by aggressive U.S. and Canadian rollouts that leverage mid-band spectrum cleared in recent auctions. The Fixed Wireless Access market share in the region is stabilizing as household penetration tops 15%, prompting carriers to chase incremental growth in rural clusters. Federal programs continue to reimburse capital spend, although competition from discounted fiber is intensifying.
Africa Fixed Wireless Access Market
Africa is set to deliver the fastest growth at 15.06% CAGR through 2031. Operators in South Africa, Kenya, Nigeria, and Egypt build on existing LTE towers, vaulting over copper and limited fiber grids.[4] Price points often undercut wired alternatives by 30%-40%, prompting rapid subscriber adoption among mobile-first households.
Europe, APAC and Middle East Fixed Wireless Access Market
Asia-Pacific remains a scale engine where India, China, and Japan deploy FWA to close digital gaps in remote regions. India’s flagship 5G FWA service targets 100 million households at pricing roughly 40% below cable. In the Middle East, sovereign spectrum allocations allow carriers in Saudi Arabia and the United Arab Emirates to ship multi-gigabit residential and enterprise packages, while Europe’s growth trails due to state-aid rules that still prioritize fiber builds.
Mordor Intelligence provides coverage of the fixed wireless access market across other key regional markets, including Middle East, South America, Africa, North America, and Asia, each with their regulatory frameworks and demand patterns. Detailed country-level analysis extends to France and Germany incorporating local coverage and market participation, as required.
Regulatory Landscape
Regulation for fixed wireless access is shaped by spectrum policy, broadband subsidy rules, and measurement and reporting obligations. Internationally, the ITU Radio Regulations (2024 edition) entered into force on January 1, 2025, setting the cross-border framework for spectrum use, while ITU-R Recommendation F.1763-2 (February 2026) updated guidance for broadband wireless access systems in the fixed service. In the United Kingdom, Ofcom continues to publish FWA-specific licensing guidance and notes license-exempt operation for equipment in the 5725-5850 MHz band, supporting certain unlicensed last-mile and backhaul configurations alongside licensed 4G/5G deployments.
In the United States, the FCC is tightening the link between public funding, performance validation, and network security, which affects how FWA networks are planned, documented, and operated. Public Law 119-89 directs the FCC to evaluate broadband funding proposals against established technical standards used in its data-collection framework, and it establishes minimum penalties for pre-authorization defaults of USD 9,000 per violation, reinforcing compliance and documentation discipline for subsidized builds. Separately, FCC 24-89A1 ties the 5G Fund for Rural America to cybersecurity and supply chain risk management plans, with incentives around Open RAN. A June 2026 Federal Register action also highlights ongoing efforts to streamline fixed wireless data reporting requirements, with comment deadlines extending into late July and August 2026.
Competitive Landscape
The vendor ecosystem shows moderate concentration. Five radio access suppliers account for roughly 60% of equipment shipments, yet more than a dozen CPE makers serve operators, preventing one-sided pricing power. Carriers diversify their supply chains by awarding parallel contracts to at least two radio vendors, balancing risk and bargaining leverage. Mobile operators are the chief disruptors, taking broadband market share from cable and fiber incumbents by bundling mobile plans with home internet.
Start-ups such as Tarana Wireless and Cambium Networks fill performance gaps where legacy LTE falters, offering proprietary waveforms or ruggedized outdoor units for industrial and rural deployments. Chipset competition remains intense, with Qualcomm, MediaTek, and Samsung vying to embed AI accelerators that predict network congestion and steer traffic accordingly. Release 18 specifications promise lower-cost devices and flexible network slicing, raising the stakes for all suppliers.
Price competition is moving beyond consumer tiers. Enterprises and public agencies issue tenders for managed FWA links that guarantee throughput under congestion, often packaged with SD-WAN and security services. The emerging field of private 5G over shared bands creates white-space opportunity for integrators and cloud providers eager to tack edge-compute workloads onto wireless backbones.
Fixed Wireless Access Industry Leaders
-
Huawei Technologies Co. Ltd.
-
Nokia Corporation
-
Ericsson AB
-
Qualcomm Technologies Inc.
-
Samsung Electronics Co. Ltd.
- *Disclaimer: Major Players sorted in no particular order
Fixed Wireless Access Market Companies Covered in this Report
- Huawei Technologies Co. Ltd.
- Nokia Corporation
- Ericsson AB
- Qualcomm Technologies Inc.
- Samsung Electronics Co. Ltd.
- Verizon Communications Inc.
- AT&T Inc.
- T-Mobile US Inc.
- United States Cellular Corporation
- ZTE Corporation
- Deutsche Telekom AG
- Vodafone Group Plc
- Orange S.A.
- Telstra Corporation Limited
- Globe Telecom Inc.
- Inseego Corp.
- Airspan Networks Holdings Inc.
- Siklu Communication Ltd.
- Starry Group Holdings Inc.
- Tarana Wireless Inc.
- Cambium Networks Corporation
- Casa Systems Inc.
- NETGEAR Inc.
Market Opportunities and Future Outlook
Near-term whitespace is emerging where regulators and program administrators are explicitly treating FWA as an eligible broadband remedy, while mid-band and shared spectrum options expand feasible deployment models. In the United States, BEAD-linked activity provides a concrete example: Nextlink Internet brought a BEAD-funded tower live in May 2026 in Bienville Parish, Louisiana, using 3.5 GHz CBRS and 6 GHz spectrum. This points to a pathway for smaller providers to combine subsidy dollars with shared-spectrum economics. Spectrum policy is also widening the deployment options for managed FWA services across dense and rural zones, and in May 2026 the FCC formalized a decision that permits shared commercial 5G FWA operations in 550 MHz of 4.9 GHz mid-band spectrum.
Service-layer opportunities are also expanding as operators monetize FWA beyond best-effort home broadband through managed offerings and wholesale models. In Mexico, Telcel commercially launched its Internet Gestionado 5G FWA platform in March 2026, and by July 2026, Veea reported revenue generation tied to SecureConnect sales through that service, showing demand for integrated security and managed connectivity bundles. In emerging, data-centric markets, infrastructure-light entry models are also visible, including ntel's July 2026 relaunch in Nigeria under a "Next Frontier" strategy that includes FWA via its NOVA platform for wholesale partnerships. At the same time, standardization work in 3GPP Release 19 includes FWA-oriented enhancements for coverage and capacity, supporting product and network differentiation around higher-capacity fixed links.
Recent Industry Developments in Fixed Wireless Access Market
- May 2026: Inseego agreed to acquire Nokia's fixed wireless access (FWA) CPE business in a transaction structured as USD 20 million in stock and warrants, alongside a USD 10 million equity investment from Nokia, with closing targeted for Q4 2026. The deal realigns Nokia further toward core network and infrastructure priorities while adding scale for Inseego in operator-grade FWA devices and expanding the installed base to support service-led upsell.
- March 2025: Ericsson, NBN Co, and Qualcomm completed a live 5G mmWave FWA field trial in Australia, extending range to 14 km while exceeding 1 Gbps speeds. The outcome supports the business case for mmWave FWA in sparsely served areas, where fewer sites can cover longer distances, and it aligns with operator plans for gigabit-class fixed broadband without extensive fiber builds.
- December 2024: Nokia and EOLO signed a four-year agreement to deploy Europe's first 5G standalone mmWave FWA network in Italy. The project provides a reference deployment for 5G SA-based fixed broadband in a fiber-challenged access context, creating a template for pairing dense-capacity spectrum with FWA service bundles for residential and enterprise connectivity.
Fixed Wireless Access Market Report Scope and Research Methodology
Market Definition and Coverage
For this study, the fixed wireless access market is counted as revenue from last mile broadband delivered over licensed or lightly licensed cellular spectrum, where a fixed customer premises device connects homes or businesses and then distributes internet through Wi-Fi or Ethernet.
Scope exclusions: Satellite broadband links and pure unlicensed Wi-Fi backhaul based access are excluded from this coverage.
Segments Covered in This Report
- By Type
- Hardware
- Consumer Premise Equipment (CPE)
- Access Units (Femto and Picocells)
- Services
- Hardware
- By Application
- Residential
- Commercial
- Industrial
- Government and Public Safety
- By Frequency Band
- Sub-6 GHz
- mmWave (Above 24 GHz)
- Unlicensed / Shared CBRS
- By Deployment Mode
- Indoor CPE
- Outdoor CPE
- Self-Install Window-Mount CPE
- By Geography
- North America
- United States
- Canada
- Mexico
- South America
- Brazil
- Argentina
- Rest of South America
- Europe
- United Kingdom
- Germany
- France
- Italy
- Rest of Europe
- Asia-Pacific
- China
- Japan
- India
- South Korea
- Rest of Asia
- Middle East and Africa
- Middle East
- Israel
- Saudi Arabia
- United Arab Emirates
- Turkey
- Rest of Middle East
- Africa
- South Africa
- Egypt
- Rest of Africa
- Middle East
- North America
Data Sources, Market Sizing, and Validation
Desk Research
Desk work starts by building the demand setting for fixed wireless access, and we focus on public reference series that are stable year to year. Sources used include telecom indicators and broadband coverage series from the ITU, national regulators such as the FCC, and spectrum and licensing information from agencies such as the FCC and Ofcom.
We also refer to operator and network vendor public materials such as annual reports, investor presentations, and press releases to understand rollout timing, offer structure, and monetization patterns. Where it helps quantify deployment pace, patents databases, reputable technical journals, and select import and export trade statistics are reviewed for directional checks on radio and CPE activity. The sources listed here are illustrative, and many other public sources were also used for collection, cross-checks, and clarification during the research process.
Primary Interviews and Surveys
Primary work is used to test what desk signals cannot fully confirm, especially around adoption, pricing, and the split between hardware and service revenue. We spoke with ecosystem participants such as network operators, equipment and CPE suppliers, integrators, and enterprise users across APAC, EMEA, and the Americas, and we adjusted assumptions when multiple respondents pointed to the same gap.
Distribution of primary research fieldwork respondents
| Company type | Respondent position | Region |
|---|---|---|
| Top tier: 28% | CXOs: 12% | APAC: 46% |
| Mid tier: 58% | Functional/Unit leaders: 29% | EMEA: 29% |
| Smaller Players: 14% | Managers: 59% | Americas: 25% |
Market-Sizing & Forecasting
Sizing is built using a top-down demand pool reconstruction that ties telecom access lines and broadband coverage to the realistic addressable set for fixed wireless access in each region, and then converts that into revenue using adoption and pricing logic. The main inputs include fixed wireless access subscriber additions, share of households with limited wireline options, 4G LTE versus 5G readiness, spectrum availability by band, and CPE attach and replacement cycles, which influence hardware revenue timing.
To keep totals grounded, we corroborate the result with selective bottom-up approximations, such as sampled operator plan pricing multiplied by installed base, plus channel checks on CPE volumes where public disclosures and trade signals are available. When gaps appear, which can happen in countries with limited disclosures, we use proxy indicators like population covered by mobile broadband and urban versus rural mix, and then validate those proxies with interview feedback before the final numbers are locked.
For forecasting, scenario analysis is applied around the pace of 5G rollouts, spectrum releases, and the speed of fiber expansion because these factors change how quickly fixed wireless access can be adopted and sustained. The final forecast path is then reviewed against the range of expectations shared by industry respondents so it stays realistic and repeatable.
Data Validation & Update Cycle
Validation is done through triangulation across demand signals, supply indicators, and pricing checks so outliers can be caught early. If a region shows growth that does not align with coverage expansion, known spectrum constraints, or typical plan pricing movements, we pause and recheck assumptions and, where needed, reconnect with respondents for clarification.
Before sign-off, the model is reviewed in steps, first for arithmetic consistency, then for regional logic, and finally for whether the narrative matches the numbers. Reports are refreshed annually, and interim updates are made when there are material events like large spectrum auctions, major policy shifts, or unusually large rollout announcements. Before delivery, a final analyst pass is completed so the output reflects the most current public signals.
Mordor Intelligence's Fixed Wireless Access Market Estimate Compared With Other Published Estimates
Published fixed wireless access market numbers can look far apart even when they all seem to refer to the same topic, since each publisher draws the lines around what counts as revenue and which access technologies qualify. Differences in the starting year, the way pricing is moved forward, and how fast the market is assumed to shift from 4G to 5G can widen the spread.
Key gaps usually come from scope choices like whether satellite and unlicensed fixed wireless are counted, and whether the value includes only service revenue or also includes CPE hardware shipments and related fees. Currency timing and how blended pricing is handled also matter, especially when markets with high inflation or sharp exchange rate movement are included without a consistent conversion approach.
Benchmark comparison
| Source | Market Size | Gaps in Research Methodology |
|---|---|---|
| Mordor Intelligence | USD 43.47 B (2026) | |
| Industry Publisher A | USD 49.73 B (2026) | Uses a broader revenue build that can lift totals when adjacent fixed wireless connectivity revenues are grouped together, and the pricing path to the forecast is typically carried forward more aggressively from the base year. |
| Global Advisory B | USD 30.92 B (2025) | Anchors the estimate on an earlier base year, and the model can undercount where service revenues are prioritized while hardware and managed fees are not consistently treated across regions. |
The table shows that the spread is mainly driven by what gets counted and the year each model anchors on. In Mordor Intelligence's model, the totals are tied to licensed or lightly licensed cellular based last mile access with static CPE, while excluding satellite and pure unlicensed Wi-Fi access. Once the scope lines and the pricing carry-forward rules are made explicit, the final values become easier to replicate and compare across regions using the same set of demand and deployment signals.
Key Questions Answered in the Report
What is the expected revenue for the global Fixed Wireless Access market in 2031?
The market is projected to reach USD 84.37 billion by 2031, up from USD 43.47 billion in 2026.
How fast is the Fixed Wireless Access market expected to grow?
The market is forecast to post a 14.18% CAGR between 2026 and 2031.
Which region is projected to grow fastest in Fixed Wireless Access?
Africa is set to record the highest regional CAGR at 15.06% through 2031, driven by mobile-first economies.
Why are operators choosing FWA over fiber in rural areas?
FWA capital expenditure per subscriber ranges from USD 300-USD 800, far below the USD 2,500-USD 5,000 per-passing costs typical for fiber-to-the-home builds.
What technology shift is enabling gigabit-class Fixed Wireless service?
Mid-band 5G spectrum between 3.3 GHz and 4.2 GHz delivers better capacity-coverage balance, reducing per-bit cost by roughly 40% compared with LTE.
How are enterprises using Fixed Wireless Access?
Firms deploy FWA as an SD-WAN backup link, ensuring immediate failover during fiber outages and supporting hybrid work connectivity.