
Fixed Asset Management Software Market Size and Share
Market Overview
| Study Period | 2020 - 2031 |
|---|---|
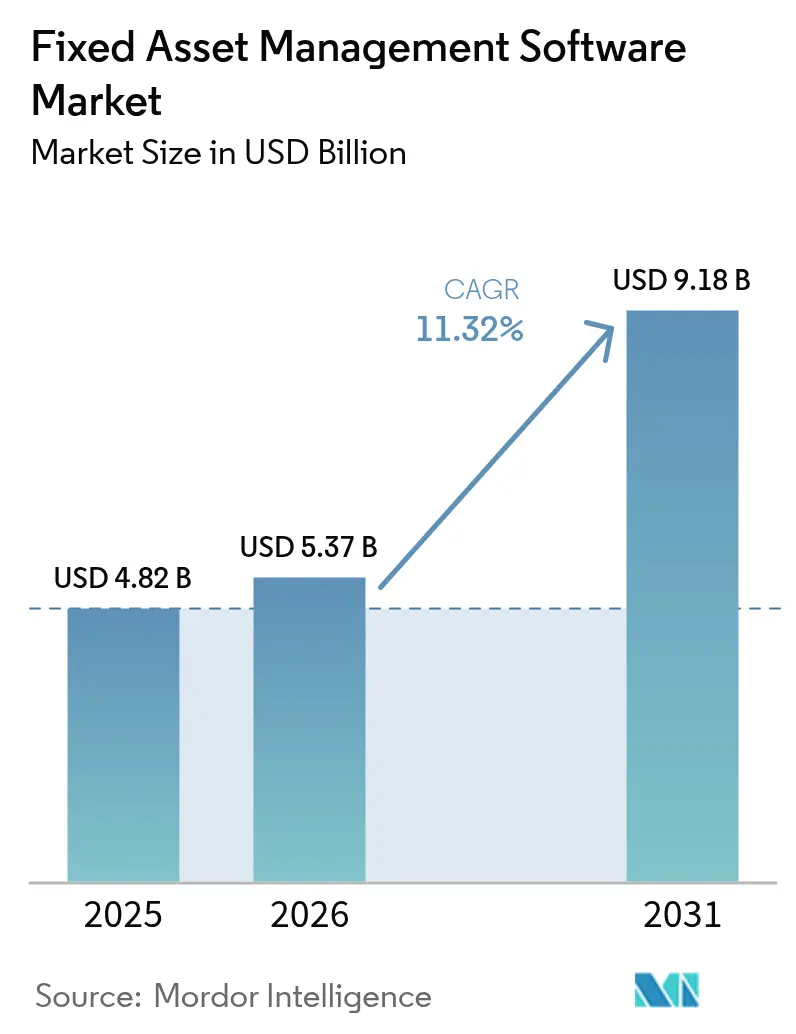
| Market Size (2026) | USD 5.37 Billion |
| Market Size (2031) | USD 9.18 Billion |
| Growth Rate (2026 - 2031) | 11.32 % |
| Fastest Growing Market | Asia Pacific |
| Largest Market | North America |
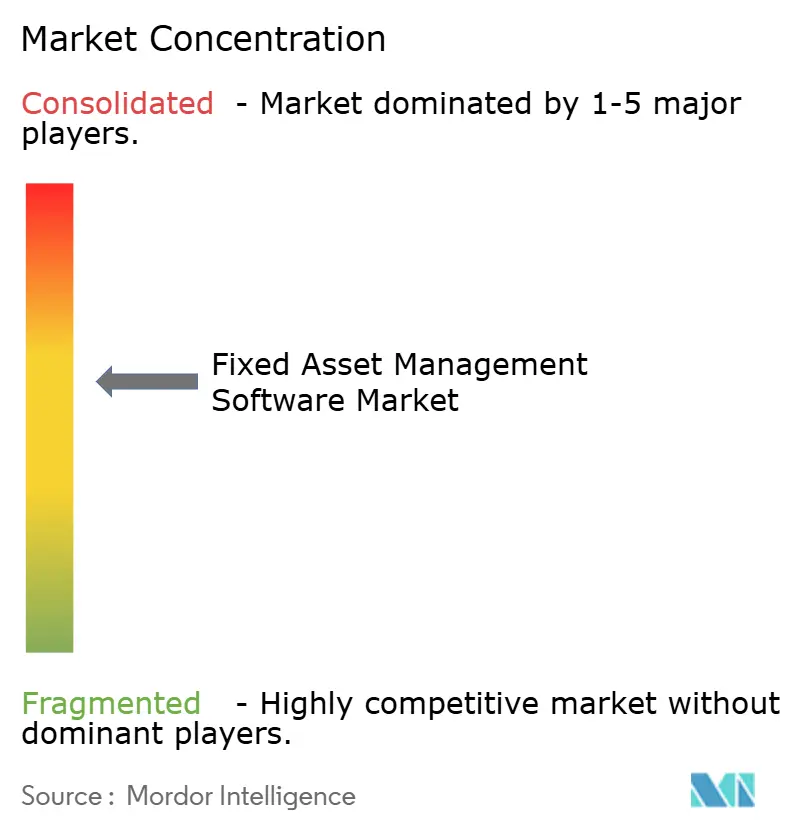
| Market Concentration | Medium |
Major Players *Disclaimer: Major Players sorted in no particular order Image © Mordor Intelligence. Reuse requires attribution under CC BY 4.0. | |
Fixed Asset Management Software Market Analysis by Mordor Intelligence
The fixed asset management software market size was valued at USD 4.82 billion in 2025 and estimated to grow from USD 5.37 billion in 2026 to reach USD 9.18 billion by 2031, at a CAGR of 11.32% during the forecast period (2026-2031). Surging investment in real-time tracking, predictive maintenance, and cloud-native architectures is elevating software from a record-keeping tool to a strategic operations platform, especially in manufacturing, transportation, and healthcare. North America continues to anchor global demand, yet sustained double-digit growth in Asia-Pacific is shifting the competitive focus toward localized regulatory support and lower-cost SaaS deployments. Vendors are sharpening value propositions around ESG reporting, AI-driven cost savings, and risk-based maintenance, while acquisitions by Siemens and Prometheus Group demonstrate rising consolidation momentum among platform providers. Despite persistent concerns over multi-tenant cloud security and SME budget constraints, low-code configuration, subscription pricing, and government digitalization incentives are expanding addressable demand and tightening payback cycles for buyers.
Key Report Takeaways
- By component, the software category led with 64.78% of fixed asset management software market share in 2025, while services are advancing at a 13.22% CAGR through 2031.
- By deployment model, on-premise systems held 62.95% of the fixed asset management software market size in 2025, yet cloud solutions are projected to grow at a 13.26% CAGR.
- By enterprise size, large enterprises commanded 71.25% of fixed asset management software market size in 2025; SMEs represent the fastest growth at 12.57% CAGR.
- By asset class, IT and digital assets held 43.85% share of the fixed asset management software market size in 2025, while fleet and mobile equipment is projected to expand at a 12.34% CAGR through 2031.
- By end-user industry, industrial manufacturing accounted for 21.72% fixed asset management software market share in 2025, whereas transportation and logistics are expanding at an 11.63% CAGR.
- By geography, North America led with 36.88% revenue share in 2025; Asia-Pacific is poised for a 12.05% CAGR through 2031.
Note: Market size and forecast figures in this report are generated using Mordor Intelligence’s proprietary estimation framework, updated with the latest available data and insights as of 2026.
Market Trends and Insights
Drivers Impact Analysis of Fixed Asset Management Software Market*
| Restraint | (~) % Impact on CAGR Forecast | Geographic Relevance | Impact Timeline |
|---|---|---|---|
| High upfront cost barrier for SMEs | −0.8% | Global, acute in developing economies | Short term (≤ 2 years) |
| Data-security and privacy concerns | −0.6% | EU and North America, expanding globally | Medium term (2-4 years) |
| Legacy-equipment integration complexity | −0.5% | North America & Europe | Medium term (2-4 years) |
| Vendor-lock and limited interoperability | −0.4% | Global | Long term (≥ 4 years) |
| Source: Mordor Intelligence | |||
Increasing Focus on Optimizing Operational Cost
Cost containment tops CIO agendas as inflation and supply chain volatility pressure margins. IFS recorded a 33% surge in software revenue and a 46% jump in cloud revenue during 2024, evidence that buyers prioritize rapid payback and operating-expense models over capital-heavy deployments[1]. AI-enhanced modules identify underutilized equipment, predict part failures, and rebalance maintenance schedules to lower unplanned downtime. Manufacturing SMEs illustrate the benefit: peer-reviewed studies confirm Industrial IoT systems deliver statistically significant cost reductions that exceed installation spend, accelerating adoption beyond large multinationals. Vendors now embed ROI dashboards and savings guarantees in proposals to shorten decision cycles and neutralize budget objections.
Growing Adoption of IoT-enabled Real-time Asset Tracking
Sensor miniaturization and affordable connectivity underpin a dramatic leap in asset visibility. Hospitals deploy RFID and Bluetooth tags to slash equipment search time, curbing rental fees and asset loss. The hospital asset tracking market itself is advancing at 16.8% CAGR, reinforcing healthcare’s status as an early adopter. Transportation platforms integrate telematics, route optimization, and condition monitoring, propelling sector software revenue to USD 72 billion at an expected 19.8% CAGR. Real-time datasets also enhance regulatory audits, producing immutable trails that satisfy ISO and safety mandates while feeding predictive models that shift maintenance from reactive to proactive.
Regulatory and Financial-audit Compliance Pressures
Governments are tightening asset stewardship rules that mandate detailed lifecycle documentation. The U.S. General Services Administration requires executive agencies to operate Joint Financial Management Improvement Program-compliant systems, converting compliance into a non-discretionary budget line[2]. The IRS formalized IT asset controls in 2024, signaling an enterprise-grade discipline now expected across federal departments. Healthcare providers confront FDA equipment tracking mandates that feed demand for specialized modules integrating with hospital information systems. These directives insulate the fixed asset management software market from macro-economic cycles by codifying asset management into governance frameworks.
Rapid Shift Toward Cloud-native SaaS EAM Suites
Cloud uptake has moved past lift-and-shift toward composable, AI-ready architectures. GE Vernova’s migration to a cloud-based Asset Performance Management environment documented faster upgrade cycles and enhanced cybersecurity versus on-premise estates. PwC reported that 92% of high-performing firms will lift cloud spending in 2025 to gain elastic compute for AI workloads. Subscription models lower entry barriers for SMEs, while zero-touch updates cut overhead for large enterprises. Cloud platforms also enable digital twin visualizations and augmented-reality workflows that field technicians access via tablets and smart glasses.
Restraints Impact Analysis of Fixed Asset Management Software Market*
| Restraint | (~) % Impact on CAGR Forecast | Geographic Relevance | Impact Timeline |
|---|---|---|---|
| High upfront cost barrier for SMEs | −0.8% | Global, acute in developing economies | Short term (≤ 2 years) |
| Data-security and privacy concerns | −0.6% | EU and North America, expanding globally | Medium term (2-4 years) |
| Legacy-equipment integration complexity | −0.5% | North America and Europe | Medium term (2-4 years) |
| Vendor-lock and limited interoperability | −0.4% | Global | Long term (≥ 4 years) |
| Source: Mordor Intelligence | |||
High Upfront Cost Barrier for SMEs
Comprehensive platforms can require USD 200,000–250,000 for custom deployments in healthcare, sums that deter smaller firms. Surveys of 4,500 SMEs confirm financial limitations and skills shortages remain the largest drag on digital uptake. OECD analyses underscore that SMEs lag larger rivals in advanced software adoption, widening productivity gaps. Vendors counter with tiered SaaS packages, phased rollouts, and government-backed grants that distribute expenditure over subscription cycles, although budget hesitancy persists in emerging economies.
Data-security and Privacy Concerns in Multi-tenant Clouds
Critical asset telemetry traverses public clouds, raising fears of industrial espionage and non-compliance with data sovereignty laws. The U.S. Chief Information Officers Council cautions that agencies remain responsible for security even when workloads sit on third-party infrastructure. Manufacturers guarding intellectual property often favor hybrid architectures that keep sensitive analytics on-premise, yet hyperscalers now tout zero-trust frameworks, customer-managed keys, and sector-specific certifications to mitigate risk perception. Progress is steady but the trust gap still subtracts from the overall growth rate.
*Our forecasts treat driver/restraint impacts as directional, not additive. The impact forecasts reflect baseline growth, mix effects, and variable interactions.
Fixed Asset Management Software Market Segment Analysis
By Component:
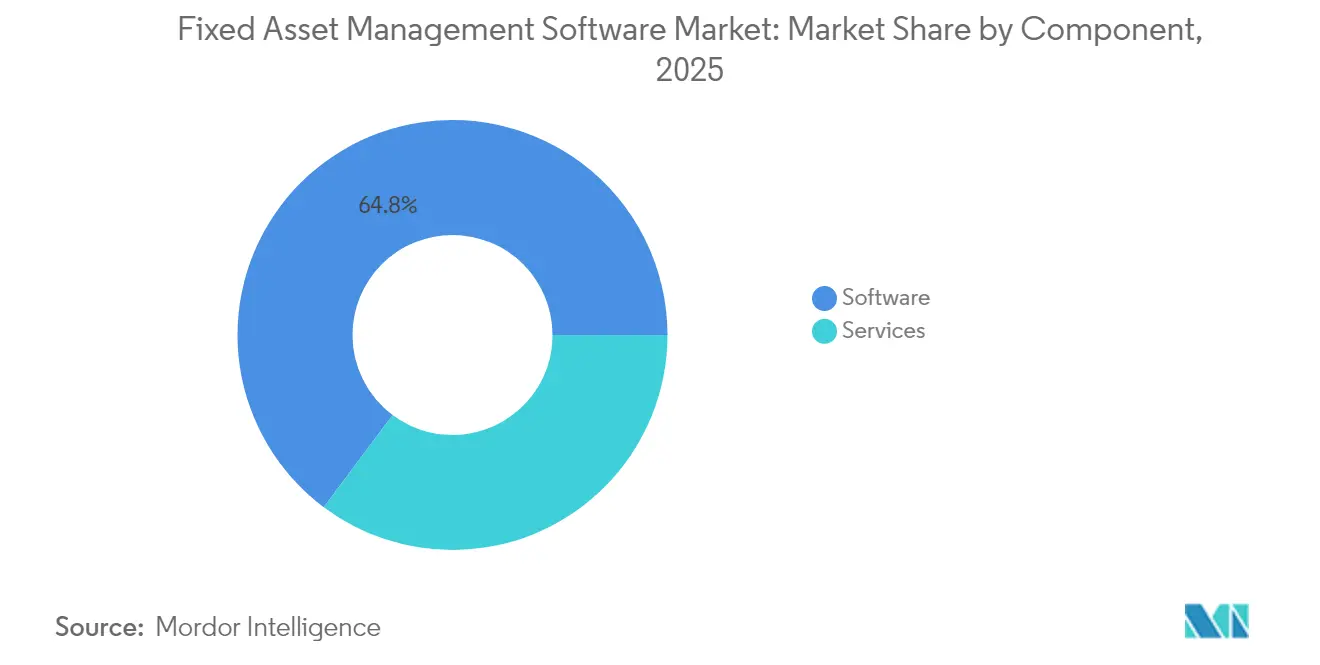
Services Accelerate Implementation SuccessSoftware modules retained 64.78% of the fixed asset management software market share in 2025 as enterprises demanded integrated tracking, depreciation, and compliance functionality. Growth now centers on services, which are expanding at 13.22% CAGR through 2031 because migrations from legacy databases, data cleansing, and change-management programs require external expertise. Implementation partners design IoT sensor layouts, map maintenance hierarchies, and train users in predictive workflows, activities that internal teams struggle to resource. Managed services appeal to SMEs lacking 24/7 IT support, offering end-to-end monitoring, patching, and reporting under pay-as-you-go terms.
The asset tracking and bar-coding sub-segment benefits directly from the IoT surge, while AI-infused predictive maintenance modules help organizations avoid catastrophic downtime. Accounting teams rely on depreciation calculators to align with evolving tax schedules, especially in jurisdictions rolling out accelerated write-off rules. Compliance modules now embed ESG metrics such as energy intensity and emissions intensity, allowing automated export into sustainability reports. Collectively, the breadth of functionality reinforces the fixed asset management software market as the foundational layer for enterprise performance data.

By Deployment Model:
Cloud Transformation AcceleratesOn-premise systems commanded 62.95% of the fixed asset management software market size in 2025, a legacy function of earlier capital-expense cycles and tight security postures in sectors like defense. Yet cloud platforms are scaling at 13.26% CAGR as CIOs pursue elastic resources that handle sensor streams and AI workloads. Early adopters cite automatic versioning, lower hardware refresh outlays, and anytime mobile access for distributed technicians. Hybrid patterns persist: sensitive process controls remain on-site while analytics dashboards reside in regional clouds for latency-tolerant use cases.
Edge computing augments both models by pre-processing vibration or thermal imagery at gateways before sending summaries to the cloud, reducing bandwidth and cost. Vendors such as IFS indicated cloud revenue rising 46% in 2024 as license customers transition to usage-based contracts. The direction is unequivocal. By 2030, the fixed asset management software market narrative will center on SaaS consumption, AI copilots, and click-configured workflows rather than server counts.
By Enterprise Size:
SME Adoption Democratizes TechnologyLarge corporations still dominate spending, with a 71.25% fixed asset management software market size in 2025, because they manage extensive plant footprints, aircraft fleets, or national logistics networks. These firms integrate asset suites with ERP, supply chain, and financial consolidation tools to produce a single system of record. However, SMEs represent the fastest expansion at 12.57% CAGR. Subscription pricing, template libraries, and low-code configurators eliminate many historical barriers. Mobile-first interfaces empower frontline workers without lengthy classroom sessions, which is critical for firms lacking dedicated IT trainers.
Government subsidies and fintech leasing programs further soften upfront costs. The OECD credits pandemic-era remote work mandates with accelerating cloud adoption among smaller factories and field-service businesses. As SMEs scale digital maturity, they unlock predictive scheduling, inventory rationalization, and warranty recovery benefits once reserved for Fortune 500 peers. This democratization widens the overall fixed asset management software industry revenue stream and diversifies vendor go-to-market channels.
By Asset Class:
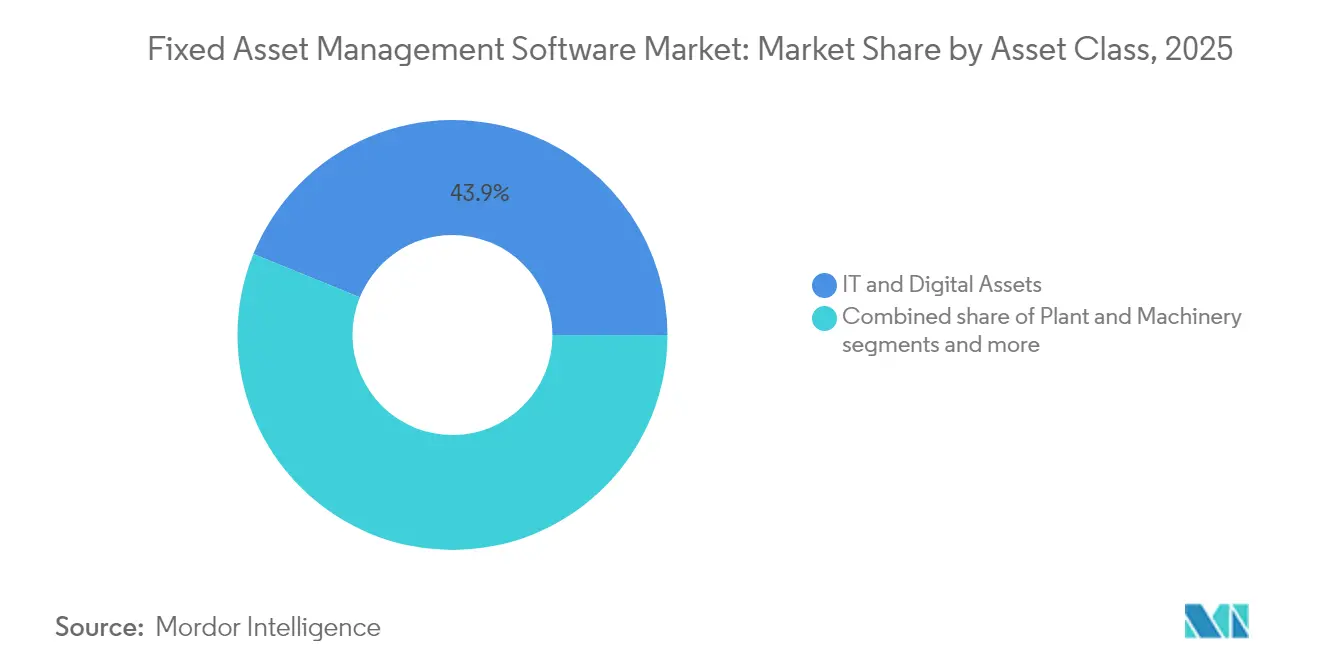
Digital Assets Lead Enterprise PriorityIT and digital assets formed the largest share at 43.85% in 2025. Cybersecurity regulations, software-license audits, and remote work flexibility forced organizations to inventory servers, network gear, and SaaS seats with granular precision. Plant and machinery assets follow closely, reflecting the continual drive for throughput and energy efficiency on production lines. Fleet equipment is the breakout category, recording a 12.34% CAGR, as telematics-enabled vehicles deliver data that feeds into consolidated dashboards for dispatchers and finance teams.
Real-estate and infrastructure assets add momentum thanks to smart-building retrofits and corporate sustainability targets. As asset classes converge in dashboards, management teams gain a panoramic view that supports cross-asset investment decisions. Interdependency mapping flags how an HVAC failure could jeopardize a data center or how poor truck maintenance inflates carbon footprints, weaving ESG priorities back into everyday operations inside the fixed asset management software market.
By End-user Industry:
Manufacturing Leads While Transportation AcceleratesIndustrial manufacturing commanded 21.72% of fixed asset management software market share in 2025, propelled by Industry 4.0 programs that combine condition sensors with MES and ERP data for closed-loop optimization. Predictive analytics minimize stoppages on high-cost machinery, and quality modules link asset performance to final product defects. Transportation and logistics achieve the swiftest growth at 11.63% CAGR through 2031. E-commerce demand, last-mile delivery complexity, and green fleet regulations drive carriers to instrument vehicles, warehouses, and containers.
Healthcare institutions deploy specialized systems for surgical instrument tracking, infusion pump utilization, and FDA reporting requirements, matching the hospital asset tracking surge documented earlier. Utilities digitize substations and meters to coordinate renewable inputs with aging infrastructure. Construction and real estate players track heavy equipment across multiple sites while complying with BIM mandates. The breadth of vertical use cases underscores why the fixed asset management software market maintains double-digit expansion even as individual segments mature.
Geography Analysis
North America Fixed Asset Management Software Market
North America maintained a 36.88% revenue share in 2025, fueled by early enterprise adoption, federal compliance mandates, and robust partner ecosystems. United States agencies must operate JFMIP-aligned asset systems, embedding stable funding into annual budgets. Canada scales investment in energy and healthcare modernization, while Mexican maquiladora plants adopt SaaS asset suites to support export supply chains. Market maturity does temper growth, yet vendor competition intensifies around AI add-ons and subscription renewals.
APAC Fixed Asset Management Software Market
Asia-Pacific delivers the fastest trajectory at 12.05% CAGR through 2031, reflecting aggressive manufacturing upgrades, infrastructure build-outs, and SME cloud adoption across China, India, and ASEAN. Beijing’s Industry 4.0 incentives, New Delhi’s digital-SEZ expansion, and cross-border e-commerce logistics all demand unified asset visibility. Oracle’s localized language packs, multi-currency billing, and region-specific compliance templates accelerate rollouts. Japan and South Korea leverage advanced robotics integration, while Indonesia and Vietnam install fleet telematics to manage archipelagic logistics.
Europe Fixed Asset Management Software Market
Europe combines stable growth with differentiated demand drivers. The EU Corporate Sustainability Reporting Directive obligates more than 50,000 firms to disclose asset performance and climate impact, reinforcing software conversions. Germany’s Mittelstand manufacturers deploy AI maintenance to hedge energy costs, the United Kingdom expands NHS equipment tracking, and France integrates asset tools into nuclear and rail modernization. Data-sovereignty laws open space for regional cloud providers to challenge hyperscalers, framing compliance as a competitive advantage.

Regulatory Landscape
Regulation affecting fixed asset management software is increasingly tied to auditable, lifecycle-based control of physical equipment and digital infrastructure. In July 2024, ISO issued updated editions of ISO 55000 and ISO 55001 and added related guidance standards (ISO 55011/55012/55013), reinforcing common requirements around asset registers, governance, competency, and data quality that vendors increasingly map into compliance and reporting modules.
Sector- and jurisdiction-specific rules are also tightening around cybersecurity, auditability, and ownership disclosure. In April 2026, the US Federal Communications Commission adopted attestation rules on foreign-adversary ownership/control for certain license, authorization, or approval holders (effective June 9, 2026), increasing compliance demand for traceable asset and supplier records in telecom environments. In July 2026, the UK Government updated the Telecommunications Security Code of Practice (version 1.1), explicitly calling for asset management controls such as recording equipment that is out of mainline support and maintaining risk management plans aligned with NCSC guidance. Regional adoption continues as well, including the GCC Standardization Organization approving GSO ISO 55001:2025 (October 14, 2025), which supports standard-driven procurement and internal audit alignment across GCC markets.
Value Chain Analysis
The fixed asset management software value chain starts with foundational platforms and infrastructure (cloud, databases, and security tooling) and runs through application vendors, implementation partners, and ongoing managed services. Core suppliers include major enterprise application ecosystems (SAP, Oracle, Microsoft Dynamics 365) that provide the financial fixed-asset backbone, along with specialist enterprise asset and operations platforms (for example, IBM Maximo and telecom-focused inventory platforms such as Amdocs) that expand operational and network asset coverage. Differentiation is increasingly tied to packaged capabilities such as mobile-first workflows, IoT ingestion, and AI-driven anomaly detection that turn asset registers into operational decision systems.
Midstream, integration and data services are a key step because most deployments must connect maintenance, procurement, and inventory events to financial fixed-asset ledgers, including automated record creation from receipts and linking work orders to depreciation and capitalization processes. System integrators and ISV partners handle data cleansing, hierarchy modeling, sensor onboarding, and ERP-to-EAM/ITAM integrations, which are often the longest pole in time-to-value for buyers. Downstream, distribution is led by direct enterprise sales and cloud marketplace-led procurement, while customer success, managed support, and continuous configuration drive recurring revenue as organizations broaden coverage from plant equipment into IT and digital assets (43.85% share in 2025) and into fleet and mobile equipment workflows.
Competitive Landscape
The fixed asset management software market shows moderate fragmentation yet clear consolidation vectors. Enterprise heavyweights IBM, SAP, and Oracle leverage entrenched ERP installs to upsell integrated asset modules, reinforcing stickiness via single-vendor roadmaps. Siemens’ USD 1.6 billion pickup of Brightly Software in 2022 signaled entry by industrial automation giants eager to fuse operational technology with maintenance workflows. Hexagon’s 2025 acquisition of CAD Service bolsters 3D visualization, enabling augmented-reality maintenance guides in high-complexity environments.
IFS, AssetWorks, and Prometheus Group differentiate through industry-specific depth and rapid cloud innovation. IFS portrays itself as an AI-first industrial suite, evidenced by 46% cloud revenue growth in 2024. Prometheus Group’s six acquisitions since 2019 sharpen mobile EAM capabilities and Oracle integration. UpKeep, MaintainX, and Fleetio disrupt from below with mobile-first interfaces and subscription contracts that resonate with resource-tight SMEs. Patent filings proliferate around machine-learning anomaly detection and digital-twin syncing, while open APIs become decisive for ecosystem partnerships.
Strategic alliances expand platform scope. Fleetio’s 2024 partnership with Razor Tracking integrates agricultural telematics, courting heavy-equipment OEMs. GE Vernova collaborates with utilities to embed predictive modules into renewable assets. Insurance carriers pilot risk-based maintenance bundles with software vendors, offering premium discounts that reinforce a value chain spanning operations and finance. Competitive intensity nudges pricing toward tiered bundles rather than monolithic licenses, further democratizing access across enterprise sizes.
Fixed Asset Management Software Industry Leaders
-
Infor Inc.
-
IBM Corporation
-
SAP SE
-
FMIS Ltd.
-
Asset Panda, LLC
- *Disclaimer: Major Players sorted in no particular order
Fixed Asset Management Software Market Companies Covered in this Report
- IBM Corporation
- SAP SE
- Infor Inc.
- Oracle Corporation
- Hexagon AB (HxGN EAM)
- IFS AB
- AssetWorks LLC
- Asset Panda LLC
- FMIS Ltd.
- Ramco Systems
- UpKeep Technologies
- Sage Group plc
- MRI Software LLC
- Fiix Software
- Wasp Barcode Technologies (AssetCloud)
- Tracet (Adaequare Info Pvt Ltd.)
- RCS Technologies
- Mynd Integrated Solutions
- Osource Global
- EZ Web Enterprises
- InfoFort LLC
Market Opportunities and Future Outlook
A key opportunity is converged management of financial fixed assets with operational, IT, and telecom network inventories, where buyers are consolidating fragmented registers and closing audit gaps. This direction is supported by the 2024 refresh of the ISO 55000/55001 family and by cybersecurity-driven requirements that elevate lifecycle status (for example, out-of-support equipment) as part of risk management. That emphasis is increasing demand for asset data models that connect hardware, software, firmware, and contract attributes in a single view. Vendors with strong connectors into ERP suites (SAP, Oracle, Microsoft Dynamics 365) and into telecom-specific inventory environments can capture consolidation budgets tied to governance and audit readiness, rather than discretionary automation.
Product-led whitespace also shows up in media and production environments that need asset intelligence beyond generic depreciation, including license tracking and OEM-sourced technical metadata. In April 2026, Advanced Systems Group partnered with Beam Dynamics to offer the Beam Asset and License Intelligence Platform to global media clients, reflecting pull for specialized asset and license intelligence that links inventory to lifecycle economics. At the same time, AI-assisted explanations of fixed-asset key figures and automated extraction of contract data (such as leases) are moving into mainstream enterprise suites, creating room for differentiated modules that reduce manual reconciliation between operations, finance, and compliance for multi-site organizations and SMEs adopting subscription pricing to manage the upfront-cost barrier.
Recent Industry Developments in Fixed Asset Management Software Market
- July 2026: IBM highlighted planned capabilities for IBM Maximo Application Suite 9.2, including AI agent integration and automated extraction of data from lease contracts. The update advances automation around unstructured documents that can slow fixed-asset and lease-related workflows, reinforcing Maximo’s position in compliance-heavy asset environments.
- April 2026: SAP released SAP Cloud ERP Private 2025 FPS1, adding AI-assisted explanation for fixed asset key figures and an AI-driven capitalization proposal capability. These additions move fixed-asset accounting toward assisted decision support inside core ERP, increasing competitive pressure on stand-alone tools to differentiate through deeper operational integrations and industry templates.
- June 2025: IBM announced general availability of Maximo Application Suite 9.1. The release supports continued platform modernization for asset-intensive enterprises and provides a newer baseline for customers moving from legacy EAM deployments toward suite-based, cloud-aligned operations and reporting.
Fixed Asset Management Software Market Report Scope and Research Methodology
Market Definition and Coverage
This market covers software products used to register, track, depreciate, and audit fixed assets across their lifecycle, including packaged and cloud-delivered deployments. Revenue is counted from software licensing or subscriptions that support fixed asset accounting, tracking, and reporting in business settings.
Scope exclusions: We exclude stand-alone RFID readers and tags, generic ERP suites where fixed asset is only a small module, and facilities maintenance platforms that do not run fixed asset accounting.
Segments Covered in This Report
- By Component
- Software
- Asset Tracking and Bar-coding Module
- Preventive and Predictive Maintenance Module
- Depreciation and Tax Management Module
- Risk and Compliance Module
- Services
- Professional and Implementation
- Managed Services
- Software
- By Deployment Model
- Cloud-based
- On-premise
- By Enterprise Size
- Large Enterprises
- Small and Medium Enterprises
- By Asset Class
- IT and Digital Assets
- Plant and Machinery
- Fleet and Mobile Equipment
- Real-Estate and Infrastructure
- By End-user Industry
- Industrial Manufacturing
- Transportation and Logistics
- Healthcare and Life Sciences
- Energy and Utilities
- Construction and Real Estate
- Government and Public Sector
- IT and Telecom
- Other Industries (Media, Education, BFSI, Retail)
- By Geography
- North America
- United States
- Canada
- Mexico
- Europe
- Germany
- United Kingdom
- France
- Italy
- Spain
- Russia
- Rest of Europe
- Asia-Pacific
- China
- Japan
- India
- South Korea
- ASEAN
- Australia and New Zealand
- Rest of Asia-Pacific
- South America
- Brazil
- Argentina
- Rest of South America
- Middle East and Africa
- Middle East
- Saudi Arabia
- UAE
- Turkey
- Rest of Middle East
- Africa
- South Africa
- Nigeria
- Rest of Africa
- Middle East
- North America
Data Sources, Market Sizing, and Validation
Desk Research
Desk work started with clarifying what buyers actually pay for in fixed asset management software, and how vendors describe modules such as depreciation, audit trails, and asset tracking. We relied on public sources such as US SEC filings, US Bureau of Labor Statistics series for employment and wage context in IT and finance functions, the US Census Bureau's ICT and business counts tables, and OECD and World Bank indicators for enterprise digitization and investment trends.
To avoid building the model on opinions, we also reviewed accounting and compliance guidance and adoption signals from sources such as IFRS material, government procurement portals, and association publications that discuss asset controls and audit readiness. In addition, we used general secondary sources like vendor annual reports, investor decks, product documentation, and reputable press coverage of pricing and deployment shifts. Paid database subscriptions were used selectively for company financials, patent look-ups, and contract or tender screening to validate where demand is active. These desk sources are illustrative only, and many other public references were used to collect, cross-check, and clarify data points.
Primary Interviews and Surveys
Primary work focused on verifying what gets purchased as a fixed asset management tool versus what is bundled into broader enterprise suites, and how pricing changes between on-premise licenses and cloud subscriptions. We spoke with a mix of software providers, implementation partners, and end users from asset-heavy functions (finance, IT, and operations) across major regions, so assumptions such as adoption rates, average contract values, and renewal behavior could be adjusted toward realistic ranges.
Distribution of primary research fieldwork respondents
| Company type | Respondent position | Region |
|---|---|---|
| Top tier: 30% | CXOs: 13% | APAC: 49% |
| Mid tier: 53% | Functional/Unit leaders: 31% | EMEA: 33% |
| Smaller Players: 17% | Managers: 56% | Americas: 18% |
Market-Sizing & Forecasting
Market sizing was built using a top-down and bottom-up approach, where enterprise software spending and digital adoption indicators were first used to reconstruct the demand pool, and then the total was tested using selective supplier and channel approximations. In practice, we started from the addressable set of organizations that need formal fixed asset books and audit trails, and then applied penetration and pricing logic by deployment type.
Key inputs used in the model included the split between on-premise and cloud deployments, typical subscription versus license patterns, renewal behavior, and the frequency with which fixed asset processes move from spreadsheets into dedicated tools. We also tracked practical buying signals such as audit and compliance readiness needs, modernization timelines for finance systems, and the share of asset-intensive industries in each region that typically carry larger fixed-asset registers. When bottom-up checks were needed, sampled average contract values were multiplied by estimated customer counts and then adjusted for gaps where vendors sell through partners or bundle modules in broader deals.
For forecasting, scenario analysis was used because adoption is shaped by steady drivers such as cloud migration and compliance, and event-led shifts such as budget cycles and policy changes. Growth assumptions were stress-tested using primary inputs on pricing progression, cloud conversion pace, and buyer expansion from large enterprises into mid-market firms.
Data Validation & Update Cycle
Before results are finalized, outputs are triangulated against independent checks such as vendor revenue direction, public contract activity, and the implied deployment mix trend over time. Outliers are investigated by revisiting assumptions, rechecking conversions, and, when needed, re-contacting interviewees to confirm whether a change is real or driven by timing, currency, or bundling.
Each model pass is reviewed in steps, with peer checks on inputs, math logic, and whether the totals match known market signals. Reports are refreshed annually, and interim updates are made when material events occur that can shift growth, such as major policy changes or meaningful product and pricing moves. Right before delivery, we complete a final review to ensure the latest available data has been reflected consistently across tables and narratives.
Mordor Intelligence's Fixed Asset Management Software Market Size Compared Against Other Published Estimates
Published market values for fixed asset management software often vary because different studies do not count the same revenue lines, and they also do not align on year cutoffs, currency timing, and what "software" means in practice. We typically see the biggest differences coming from whether services are included, how cloud subscriptions are annualized, and whether adjacent categories are rolled in.
The main gap comes from whether implementation and support services are added on top of the software value, where Mordor Intelligence counts services only when they are sold as part of the core software contract, and keeps stand-alone hardware trackers and generic ERP suites out of scope.
Benchmark comparison
| Source | Market Size | Gaps in Research Methodology |
|---|---|---|
| Mordor Intelligence | USD 4.82 B (2025) | |
| Industry Publisher A | USD 4.53 B (2025) | Uses a software-plus-services framing in some sections but applies conservative vendor coverage and limited adjustments for bundled suite deals, which can pull the 2025 total down. |
| Industry Publisher B | USD 4.06 B (2024) | Tracks a broader "fixed asset software" set with mixed deployment labels, but year alignment and conversion to a consistent software revenue basis are not always explicit, which can shift values when compared year-for-year. |
Looking at the spread, the biggest drivers are what gets counted as software revenue, how bundled contracts are treated, and whether the stated year matches the same currency timing. By tying assumptions to clear buying units like subscriptions, licenses, and contract-linked add-ons, the estimate stays traceable and easier to repeat when new data is released.
Key Questions Answered in the Report
What is the current size of the fixed asset management software market?
The market is valued at USD 5.37 billion in 2026 and is projected to reach USD 9.18 billion by 2031 at an 11.32% CAGR.
Which region is growing the fastest for fixed asset management solutions?
Asia-Pacific leads growth with a 12.05% CAGR through 2031, driven by manufacturing expansion, regulatory adoption, and cloud-native deployments.
How quickly are cloud deployments expanding compared with on-premise systems?
Cloud solutions are increasing at a 13.26% CAGR, outpacing on-premise growth as enterprises prioritize scalability, AI readiness, and reduced capital expenditure.
Which industry holds the largest share of market spending?
Industrial manufacturing controls 21.72% of 2025 revenue, reflecting complex equipment portfolios and high downtime-avoidance priorities.
What are the key drivers behind market expansion?
Cost optimization, IoT-enabled real-time tracking, compliance mandates, cloud adoption, ESG reporting, and insurtech-linked maintenance models collectively bolster demand.
How do SMEs overcome high implementation costs?
Subscription-based SaaS pricing, government grants, and phased rollouts reduce upfront expenditure, enabling SMEs to access the same predictive capabilities as large enterprises.