
Fitness Tracker Market Size and Share
Market Overview
| Study Period | 2020 - 2031 |
|---|---|
| Market Size (2026) | USD 72.61 Billion |
| Market Size (2031) | USD 154.47 Billion |
| Growth Rate (2026 - 2031) | 16.31 % |
| Fastest Growing Market | Asia-Pacific |
| Largest Market | North America |
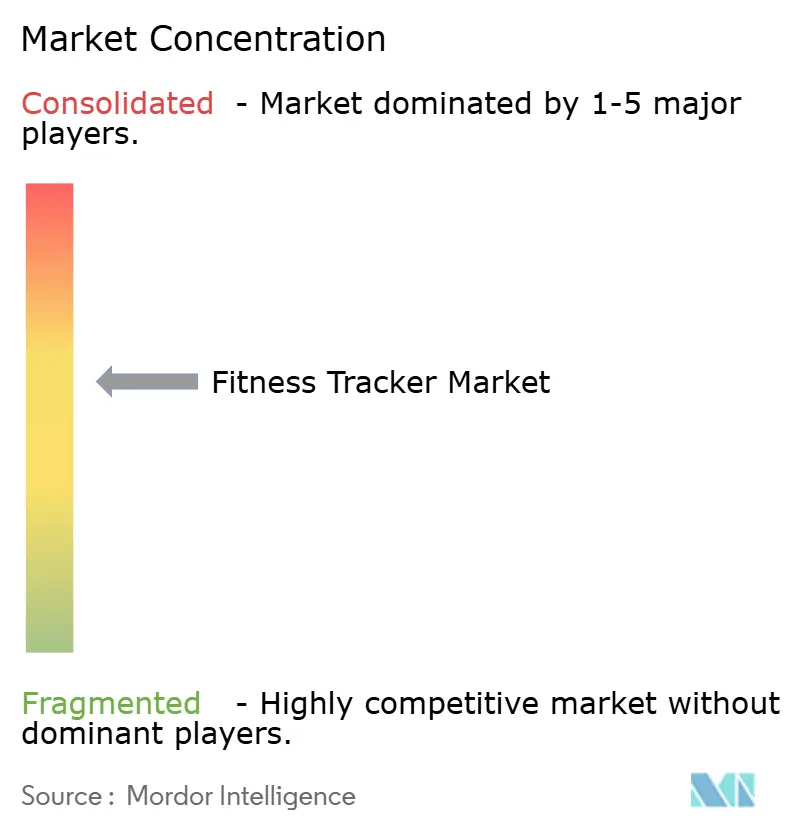
| Market Concentration | Medium |
Major Players *Disclaimer: Major Players sorted in no particular order Image © Mordor Intelligence. Reuse requires attribution under CC BY 4.0. | |
Fitness Tracker Market Analysis by Mordor Intelligence
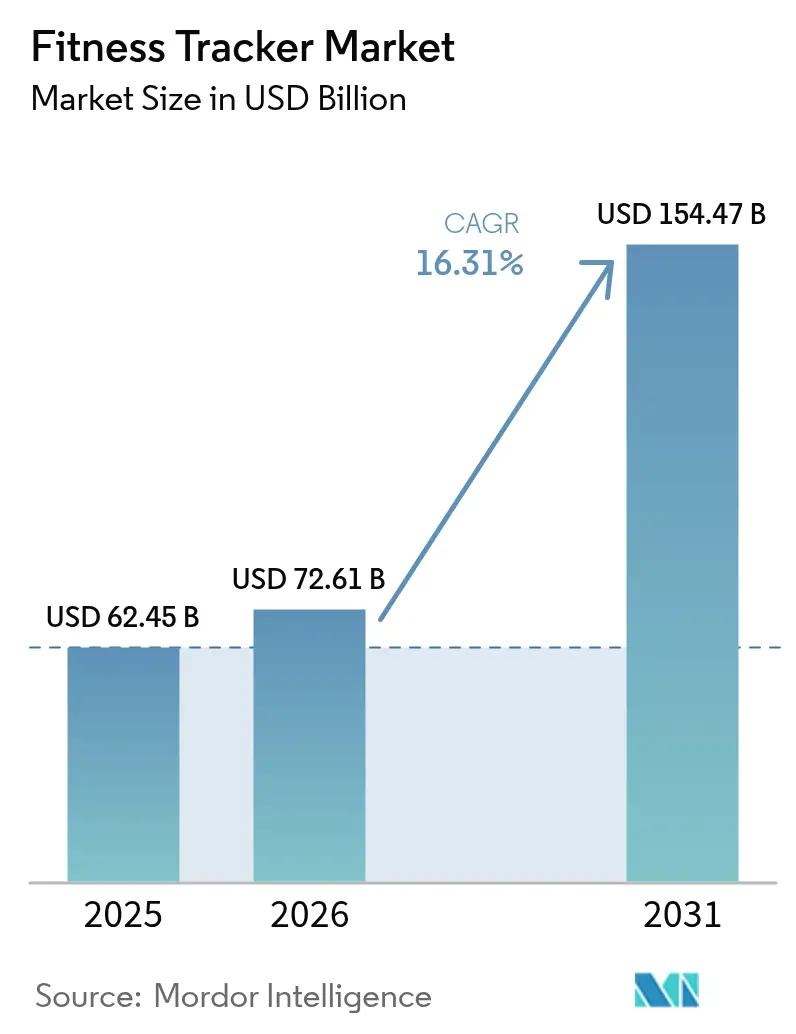
The fitness tracker market size was valued at USD 62.45 billion in 2025 and estimated to grow from USD 72.61 billion in 2026 to reach USD 154.47 billion by 2031, at a CAGR of 16.31% during the forecast period (2026-2031). Demand is shifting from simple step counters toward medical-grade platforms that combine continuous glucose sensing, AI-driven biometric analytics, and digital-therapeutics connectivity. Employer wellness incentives, payer reimbursement codes for digital health, and over-the-counter (OTC) clearances for continuous glucose monitors (CGMs) accelerate device adoption. Smartwatches remain the anchor form factor, yet distributed sensing in clothing, rings, and footwear broadens addressable use cases. Regulatory emphasis on cybersecurity and circular-economy design raises compliance costs but stimulates innovation in secure data architecture and recyclable materials.
Key Report Takeaways
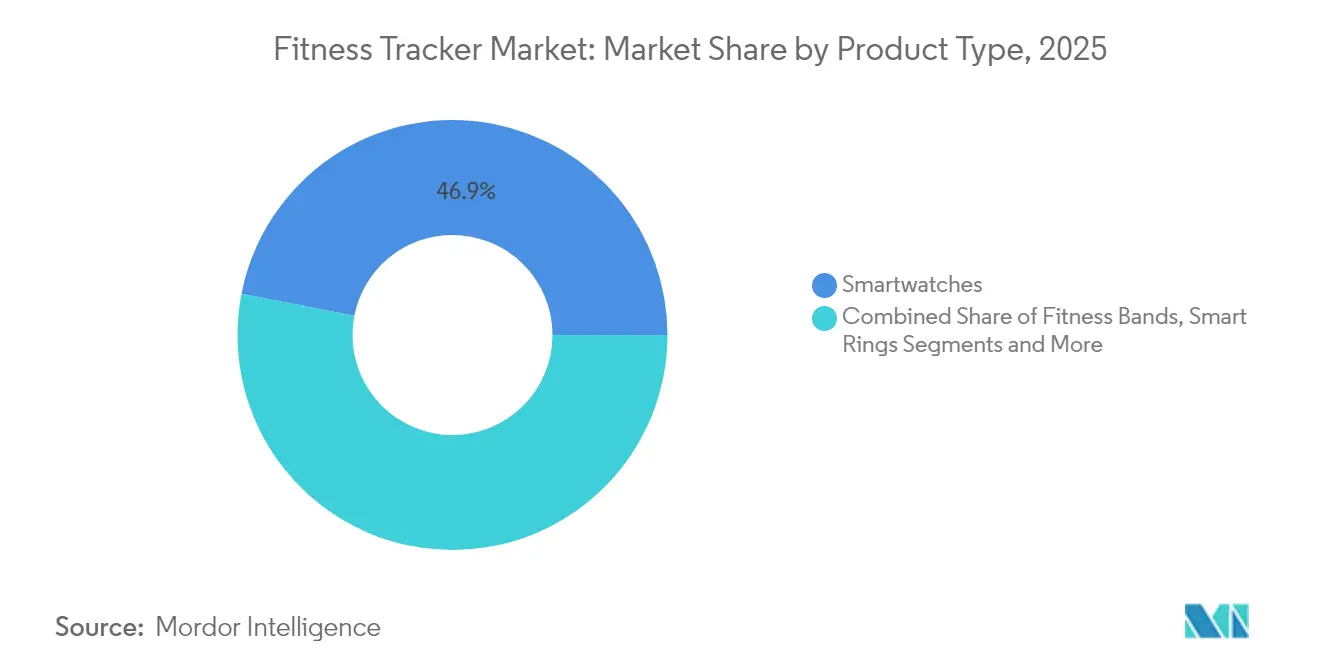
- By product type, smartwatches led with 46.92% revenue share in 2025; smart clothing and shoes are projected to expand at a 21.36% CAGR to 2031.
- By sales channel, the online segment held 63.93% of the fitness tracker market share in 2025, while it is also expected to post the highest 18.66% CAGR through 2031.
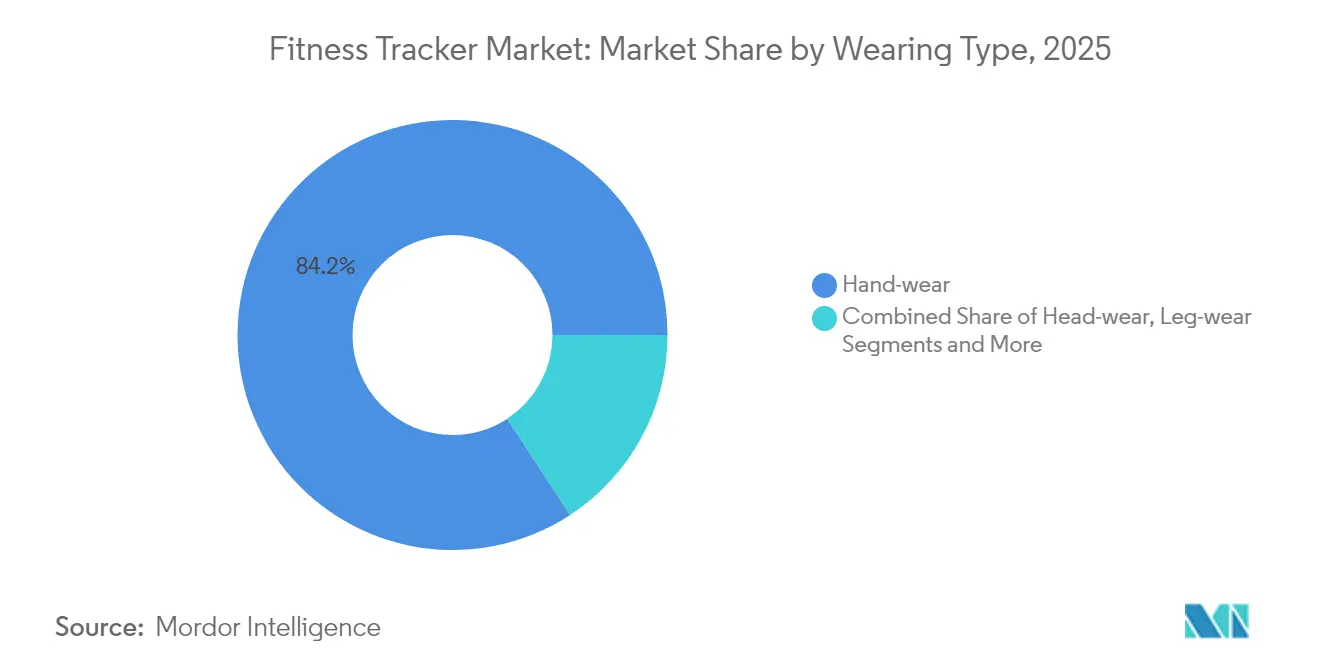
- By wearing type, hand-wear devices captured 84.22% share of the fitness tracker market size in 2025 and leg-wear is forecast to grow at 21.53% CAGR over the same period.
- By application, heart-rate and activity monitoring accounted for 39.23% share of the fitness tracker market size in 2025; glucose and metabolic tracking is advancing at a 19.97% CAGR through 2031.
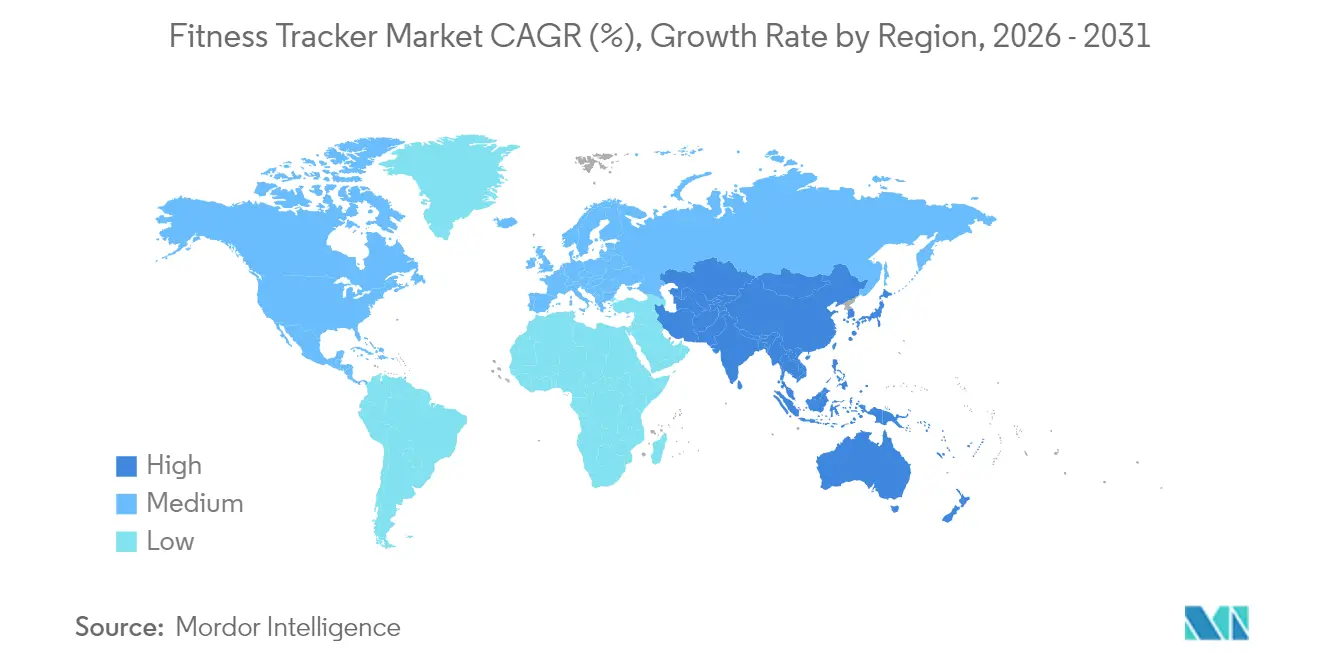
- By geography, North America dominated with 43.13% share in 2025, whereas Asia-Pacific is set to record the quickest 19.67% CAGR to 2031.
Note: Market size and forecast figures in this report are generated using Mordor Intelligence’s proprietary estimation framework, updated with the latest available data and insights as of 2026.
Market Trends and Insights
Drivers Impact Analysis of Fitness Tracker Market*
| Driver | (~) % Impact on CAGR Forecast | Geographic Relevance | Impact Timeline |
|---|---|---|---|
| Growing adoption of smartwatches as health hubs | +3.2% | Global; strongest in North America and EU | Medium term (2-4 years) |
| AI-powered biometric sensors in mass-market bands | +2.8% | APAC manufacturing, global diffusion | Short term (≤ 2 years) |
| Insurer and employer wellness incentives | +2.1% | North America and EU, emerging in APAC | Medium term (2-4 years) |
| Continuous non-invasive glucose sensing | +4.3% | Global; US regulatory leadership | Long term (≥ 4 years) |
| Expansion of women-specific analytics | +1.9% | Advanced economies | Medium term (2-4 years) |
| Digital-therapeutics reimbursement integration | +2.4% | North America primary, selective EU markets | Long term (≥ 4 years) |
| Source: Mordor Intelligence | |||
Growing Adoption of Smartwatches as All-in-One Health Hubs
Smartwatches now embed ECG, SpO₂, skin-temperature, and impending blood-pressure sensors, offering a consolidated monitoring package that reduces device fatigue. Apple plans to launch cuff-less blood-pressure alerts in its fall 2025 lineup, while Samsung introduced wrist-based glucose trend readings in 2024. Health systems view the single-device model as a cost-effective way to promote continuous patient compliance. Ecosystem lock-in through app stores, cloud back-ups, and family-sharing dashboards reinforces vendor stickiness, allowing premium brands to defend margin even as component prices decline. Corporate wellness contracts that subsidize devices drive volume in commercial channels and further validate smartwatches as essential rather than discretionary purchases.
Penetration of AI-Powered Biometric Sensors in Mass-Market Bands
Edge AI chips now ship inside sub-USD 100 wristbands, bringing medical-grade resolution to mid-tier price points. Textile-embedded processors from Cornell and MIT achieve over 93% activity-classification accuracy in laboratory trials, signaling broader migration from wrist to garment fabric. On-device inference reduces latency, avoids costly cloud calls, and satisfies data-sovereignty mandates in Europe and parts of Asia. Low-cost accuracy lifts replacement cycles in price-sensitive markets, directly expanding the fitness tracker market without cannibalizing premium categories. Component standardization also shortens design cycles, letting regional OEMs pivot products toward hyper-local health concerns such as air-quality alerts or dengue-fever symptom flags.
Shift To Continuous Non-Invasive Glucose Sensing Wearables
The U.S. FDA cleared the first over-the-counter continuous glucose monitor in March 2024, creating a consumer channel that no longer requires a prescription for Type 2 diabetics or wellness users. Dexcom’s Stelo led this shift, followed by Abbott’s Lingo and Libre Rio systems three months later, firmly positioning CGMs inside the broader fitness tracker market. Major smartwatch makers now race to embed optical glucose technology so users can see metabolic trends without a separate patch sensor; Samsung filed patents for a wrist-based approach in 2024 that aims to meet accuracy targets flagged by regulators. Hardware integration reduces daily friction, lets apps correlate activity and sleep against glucose curves, and expands preventive care programs that reward stable readings. As component costs fall, manufacturers plan sub-USD 200 wearables that bundle glucose insights with heart-rate, SpO₂, and temperature tracking, moving the device from lifestyle accessory to essential metabolic dashboard.
Integration With Digital Therapeutics Reimbursement Pathways
The Centers for Medicare & Medicaid Services proposed new CPT codes GMBT1-3 in 2024, allowing clinicians to bill for prescribing and managing software-based therapies that rely on wearable data streams. This formal pathway shifts revenue models from one-time device sales toward recurring fees tied to clinical outcomes captured by fitness trackers. The FDA’s enforcement-discretion policy for low-risk digital health products further accelerates market entry because companies can iterate software without a lengthy 510(k) cycle while still meeting safety expectations. Health-system pilots show that merging tracker data with electronic health records improves remote coaching efficiency and reduces readmissions for cardiometabolic patients, strengthening payer interest. Manufacturers now bundle subscription platforms that flag deteriorating vitals and trigger telehealth visits, creating a reimbursable loop that aligns patient engagement with insurer cost savings.
Restraints Impact Analysis of Fitness Tracker Market*
| Restraint | (~) % Impact on CAGR Forecast | Geographic Relevance | Impact Timeline |
|---|---|---|---|
| High average selling price of flagship smartwatches | -1.8% | Global premium segments | Short term (≤ 2 years) |
| Cyber-security and data-sovereignty compliance costs | -2.1% | EU first, expanding worldwide | Medium term (2-4 years) |
| Sensor-skin contact dermatitis | -0.9% | Humid markets | Short term (≤ 2 years) |
| Growing e-waste regulation | -1.4% | EU leadership, rolling into APAC | Long term (≥ 4 years) |
| Source: Mordor Intelligence | |||
Cyber-Security and Data-Sovereignty Compliance Costs
Europe’s Cyber Resilience Act obliges manufacturers to conduct vulnerability testing, issue five-year security patches, and disclose breaches within 24 hours. Mid-cap brands face higher certification costs and longer development cycles, slowing product refresh rates and constraining choice for consumers[1]. Parallel GDPR enforcement increases fines for data misuse, prompting firms to build region-specific data centers that raise operating expense. In North America, fragmented privacy statutes complicate a unified compliance roadmap, leading some vendors to adopt the strictest standard globally, raising BOM costs by an estimated 3% per unit. While robust security boosts consumer confidence, the near-term financial burden weighs on operating margins and may deter smaller entrants from scaling in multiple regions.
Growing E-Waste Regulation Elevating End-of-Life Costs
The EU Regulation 2024/1781 bans destruction of unsold stock, mandates digital product passports, and enforces durability benchmarks such as battery swapability[2]. Original-design manufacturers must re-engineer casings for disassembly, adding tooling investments and lengthening supply-chain lead times. Device buy-back schemes become obligatory, shifting logistics complexity onto brands that historically off-loaded inventory risk to retailers. Extended producer-responsibility fees could erode price competitiveness of low-margin fitness bands. Nonetheless, compliance can become a differentiator as sustainability metrics grow in purchasing criteria for corporate wellness buyers and public procurement tenders.
*Our forecasts treat driver/restraint impacts as directional, not additive. The impact forecasts reflect baseline growth, mix effects, and variable interactions.
Fitness Tracker Market Segment Analysis
By Product Type:
Smartwatches Drive Ecosystem IntegrationSmartwatches accounted for 46.92% of the fitness tracker market size in 2025, benefitting from tight linkage to smartphone operating systems and a deep bench of health apps. Sensor fusion inside flagship models elevates them to quasi-diagnostic devices that can export structured data straight into electronic health records. Entry-level smartwatches with pared-down displays capture value-conscious users while still feeding cloud algorithms that upsell premium analytics tiers.
Smart clothing and shoes post the fastest 21.36% CAGR to 2031 on the back of conductive fabrics that withstand machine washing and deliver 95% activity-recognition accuracy. Athletics brands bundle gait-analysis subscriptions with footwear to monetize beyond the initial sale. Smart rings fill a privacy-and-comfort niche, appealing to night-time wearers who dislike wrist straps. These alternative form factors collectively expand the fitness tracker market by addressing contexts where wrist-wear proves intrusive or imprecise.

By Sales Channel:
Online Dominance Accelerates Direct EngagementE-commerce captured 63.93% of the fitness tracker market share in 2025, propelled by livestreamed product demos, influencer unboxings, and integrated financing at checkout. Direct-to-consumer portals allow brands to push firmware updates, sell coaching plans, and harvest anonymized engagement metrics without retailer mark-ups. Return-rate friction drops as virtual-try-on tools mature.
Offline specialty chains retain relevance for premium positioning, experiential displays, and immediate fulfillment during holiday peaks, but their share erodes as logistics partners enable two-day doorstep delivery even in secondary cities. Hybrid click-and-collect models emerge in pharmacies, marrying the medical credibility of brick-and-mortar with digital convenience.
By Wearing Type:
Hand-wear Dominance Faces Emerging AlternativesHand-wear devices, including watches and rings, represented 84.22% of the fitness tracker market size in 2025. The wrist remains ideal for pulse, motion, and temperature capture, and finger-based photoplethysmography enhances nocturnal HRV precision.
Leg-wear grows fastest at 21.53% CAGR as embedded insoles quantify pronation, pressure distribution, and caloric expenditure. Sports-science insights from foot strikes unlock upsell paths for personalized training plans. Head-wear and torso-wear stay niche for now, serving sleep-lab substitutes and continuous vital-sign capture in home-care settings. Multisensor redundancy across body locations improves data fidelity and positions apparel brands as new health-data gatekeepers.
By Application:
Glucose Tracking Emerges as Growth DriverHeart-rate and activity monitoring kept 39.23% share of the fitness tracker market size in 2025, retaining mass appeal through real-time feedback loops that reinforce daily exercise habits. The segment underpins downstream services such as insurance premium reductions and workplace incentive programs.
Glucose and metabolic tracking is forecast to grow at 19.97% CAGR after FDA OTC CGM clearance opened the door to non-insulin Type 2 diabetics and wellness users. Correlating glucose curves with sleep and activity unlocks holistic metabolic-health dashboards. Sleep-quality, women’s-health, and senior-safety applications diversify revenue, assuring the fitness tracker market of sustained multi-segment momentum.
Geography Analysis
North America Fitness Tracker Market
North America commanded 43.13% share in 2025. Employer wellness programs that pay up to USD 1,000 annually for meeting device-verified goals demonstrate financial alignment between insurers and preventive care. CMS’s proposed CPT codes for digital therapeutics cement a reimbursement pathway, encouraging clinicians to prescribe tracker-based interventions. The litany of FDA 510(k) and OTC clearances for wearable sensors further legitimizes devices as front-line medical tools. Venture capital continues to flow into AI-driven analytics startups that plug into smartwatch APIs.
APAC Fitness Tracker Market
Asia-Pacific grows fastest at 19.67% CAGR, fueled by vertically integrated manufacturing clusters that compress production costs and enable rapid SKU proliferation. Local brands bundle vernacular language coaching and tailored diet insights, resonating with first-time buyers in India, Indonesia, and China. Rising middle-class disposable income aligns with government campaigns promoting active lifestyles to combat urban sedentary trends. Domestic tech giants leverage super-apps to cross-sell wearables, insurance, and telemedicine-consult packages.
Europe Fitness Tracker Market
Europe registers steady growth underpinned by robust consumer-data protections that build trust in cloud-synced biometrics. Compliance with the Cyber Resilience Act drives up-front R&D spend yet culls lower-quality imports, raising average selling prices. Public-sector procurement in Germany and the Nordics increasingly specifies EU-origin devices that meet recyclability quotas. Southern European markets lag slightly due to lower discretionary income but benefit from pan-EU e-commerce fulfillment.
MEA and South America Fitness Tracker Market
The Middle East, Africa, and South America illustrate leap-frog potential as mobile-first populations adopt affordable bands bundled with prepaid data plans. Government-sponsored chronic-disease screening in the Gulf states includes optional tracker distribution, and Brazilian digital-bank loyalty programs reward steps with cashback. Power-supply variability and broadband gaps remain barriers yet decline as infrastructure improves.
Regulatory Landscape
Regulation continues to hinge on intended use and marketing claims, with a practical split between low-risk wellness wearables and devices that make medical-grade claims. In the United States, the FDA General Wellness: Policy for Low Risk Devices (updated January 2026) reinforces enforcement discretion for certain wellness functions, while products that claim to diagnose, treat, or mitigate disease fall under medical device oversight (supported by the FDA Digital Health Center of Excellence framing for sensor-based digital health technologies).
In Europe, Regulation (EU) 2017/745 (MDR) remains the core pathway when a wearable is positioned as a medical device, and AI-enabled wearables face additional governance as the EU AI Act expands compliance scope for algorithm-driven functions. The EU’s UDI and EUDAMED device registration requirements, with mandatory milestones referenced for May 28, 2026, add operational compliance steps for manufacturers selling regulated devices across the bloc, alongside tighter expectations for documentation and traceability.
Competitive Landscape
Market concentration is moderate. Apple and Samsung leverage proprietary silicon, OS integration, and multi-device ecosystems, anchoring the high-end segment. Garmin focuses on endurance athletes, offering multi-band GPS and two-week battery life, while Dexcom and Abbott target medical CGM integration. Specialized entrants such as Oura, Whoop, and Ultrahuman carve out niches in sleep, recovery, and metabolic fitness, monetizing via subscription dashboards rather than hardware margin.
Patent litigation intensifies; Samsung’s preemptive suit against Oura over smart-ring IP illustrates defensive tactics to avoid injunctions that could derail new form factors. Partnerships bridge gaps between consumer electronics and regulated med-tech: Dexcom invested USD 75 million in Oura to co-develop ring-CGM data fusion, signaling cross-category synergies.
Players also race to comply with circular-economy mandates. Garmin introduced a refurbishment program that extends product life to six years, and Apple expanded self-service repair to its watch line. Regional challengers in India and China undercut on price using local supply chains, yet often struggle with international cybersecurity certifications, limiting export potential.
Fitness Tracker Industry Leaders
-
Apple, Inc.
-
Samsung Electronics Co. Ltd
-
Fossil Group Inc.
-
Huawei Technologies Co. Ltd
-
Google (Fitbit)
- *Disclaimer: Major Players sorted in no particular order
Fitness Tracker Market Companies Covered in this Report
- Apple
- Google (Fitbit)
- Samsung Group
- Xiaomi Corp.
- Huawei Technologies Co. Ltd.
- Garmin
- Amazfit (Zepp Health)
- Fossil Group
- Withings
- Polar Electro
- Suunto Oy
- Whoop Inc.
- Oura Health Oy
- Noise
- Realme
- Oppo
- Nike Inc.
Market Opportunities and Future Outlook
A key whitespace sits between consumer fitness tracking and regulated medical monitoring, where vendors can add features that estimate physiological parameters for wellness without crossing into medical claims. The FDA’s January 2026 update to its General Wellness policy provides a clearer lane for certain wellness-oriented estimations (such as blood pressure or oxygen saturation) when positioned for general health and not for diagnosis, supporting faster iteration cycles for mainstream smartwatch and band platforms.
Opportunities also concentrate in software-led monetization and ecosystem tie-ins that use wearable data for coaching, recovery, and condition-adjacent insights, aligning with the market’s ongoing shift toward AI-enabled biometric analytics. Apple’s move toward hypertension-related capabilities in its smartwatch roadmap and the broader shift by subscription players (for example, WHOOP and Withings) toward recurring recovery and monitoring services point to a market structure where differentiation increasingly comes from analytics, integrations, and longitudinal insights rather than step-count hardware alone.
Recent Industry Developments in Fitness Tracker Market
- June 2026: Huawei expands health and fitness ecosystem on HUAWEI WATCH FIT 5 Series with partners including Clue, Life: Period Tracker, and The Ginger Club. The integration adds new data sources and services inside the wearable platform, broadening health data and integration capabilities. This update strengthens user lock-in and expands the range of more data-driven services.
- June 2026: Apple launched watchOS 27 at WWDC 2026 with Siri AI, expanded Apple Intelligence fitness coaching, and redesigned user interface. The upgrade improves software-enabled fitness analytics and coaching capabilities. It reinforces Apple’s position in AI-assisted fitness features and the broader wearables data ecosystem.
- June 2026: Apple expanded GymKit functionality in iOS 27 to track heart rate and workout metrics via iPhone and AirPods without using Apple Watch. The capability reduces reliance on dedicated hardware for basic fitness tracking. It increases addressable market reach by enabling broader device ecosystem data capture and potential new revenue streams.
Fitness Tracker Market Report Scope and Research Methodology
Market Definition and Coverage
For this methodology, the fitness tracker market is the value of devices bought by end users to track activity, workout metrics, and basic health indicators. It covers bands, smartwatches used for fitness, and similar wearable form factors, with sales captured across both online and offline channels.
Scope exclusions: we exclude paid fitness apps and coaching subscriptions, stand-alone medical monitoring devices sold for clinical use, and service revenue linked to warranties or repairs.
Segments Covered in This Report
- By Product Type
- Fitness Bands
- Smartwatches
- Smart Rings
- Smart Clothing & Shoes
- Others
- By Sales Channel
- Online
- Offline (Specialty Retail, CE Stores)
- By Wearing Type
- Hand-wear (Wrist- & Finger-based)
- Head-wear
- Leg-wear (Smart Shoes, Straps)
- Torso-wear (Smart Shirts)
- Others
- By Application
- Heart-rate & Activity Monitoring
- Sleep & Recovery Analysis
- Glucose & Metabolic Tracking
- Women's Health & Fertility
- Occupational & Senior Safety
- Geography
- North America
- United States
- Canada
- Mexico
- Europe
- Germany
- United Kingdom
- France
- Italy
- Spain
- Rest of Europe
- Asia-Pacific
- China
- Japan
- India
- South Korea
- Australia
- Rest of Asia-Pacific
- Middle East and Africa
- GCC
- South Africa
- Rest of Middle East and Africa
- South America
- Brazil
- Argentina
- Rest of South America
- North America
Data Sources, Market Sizing, and Validation
Desk Research
Desk work started by mapping the device universe and the demand pool, then checking that all geographies followed one consistent definition for which wearables are treated as fitness trackers. To ground the model, we leaned on public references such as United Nations Comtrade trade flows for relevant device categories, US ITC tariff and import data, FCC equipment authorization guidance, and health and activity-related publications from the World Health Organization.
Next, the pricing and mix logic was shaped using signals visible in company annual reports, investor presentations, and earnings commentary. We then reviewed reputable press coverage of product launches and channel moves for additional direction on device refresh timing and distribution. When extra clarity was needed on shipment direction or the intensity of patented features, we used paid subscriptions for company financials and intelligence, news and financials, and patent databases. The sources listed here are illustrative, and additional public and paid references were used to collect data, validate it, and resolve open questions.
Primary Interviews and Surveys
Primary discussions were run with device and component stakeholders, distributors and retailers, and health and fitness-oriented product leaders who can describe sell-in and sell-through patterns by band and smartwatch. We also spoke with app ecosystem and channel experts to pressure-test replacement cycles, promotion intensity, and how premium features translate into willingness to pay across APAC, EMEA, and the Americas.
Distribution of primary research fieldwork respondents
| Company type | Respondent position | Region |
|---|---|---|
| Top tier: 28% | CXOs: 13% | APAC: 51% |
| Mid tier: 54% | Functional/Unit leaders: 28% | EMEA: 31% |
| Smaller Players: 18% | Managers: 59% | Americas: 18% |
Market-Sizing & Forecasting
Sizing was built using a combination of top-down and bottom-up logic. We used shipment direction and installed-base replacement cycles to reconstruct demand, then derived market value through an ASP-by-category view. While the model starts from macro signals like wearable shipments, trade flows, and category adoption, totals were corroborated through targeted bottom-up checks such as sampled online prices, channel promotions, and supplier and retailer sense-checks of unit volumes.
Key inputs included average selling price movement by form factor, replacement and upgrade timing, online versus offline mix, feature-driven premiumization (for example, heart-rate, SpO2, and GPS inclusion), and regional purchasing power differences that influence device mix. Where direct unit indicators were weak in smaller countries, we filled gaps using proxy ratios linked to smartphone penetration and wearable attach trends, then rechecked outputs with interview feedback.
Forecasts were produced using scenario analysis, anchored to expected refresh cycles, pricing bands, and region-level adoption curves that were validated in interviews. We used a conservative, base, and faster-upgrade case so the final forecast stays workable when launch timing, pricing, or macro demand shifts over the period.
Data Validation & Update Cycle
Outputs were cross-checked against independent signals, including shipment and trade direction, category mix shifts, and visible price movements across major channels, and then outliers were reviewed before sign-off. When a variance showed up, we revisited the driver, rechecked the calculation trail, and in some cases re-contacted experts to confirm whether the change was real or a data artifact.
The report is refreshed annually, and interim updates are made when material events occur, such as a major device cycle change, large pricing resets, or abrupt demand slowdowns. Before delivery, a final review pass is completed so clients receive current assumptions and the latest market view.
Mordor Intelligence's Fitness Tracker Market Size Compared Against Other Published Estimates
Published values for fitness trackers can differ because sources do not always count the same device set, they sometimes use different sales channel boundaries, and the year used for currency conversion can shift the final USD figure. Even when the same year is referenced, differences in how upgrade cycles and premium feature mix are treated can move the market number meaningfully.
A refresh-led gap often appears when ASPs are not re-leveled after major launch windows, promotions, or mix shifts between bands and watch-like trackers, and when shipment checks are not revisited as new quarterly signals arrive. By rechecking ASP bands and currency timing close to the publication cycle, and validating them with channel and expert feedback, Mordor Intelligence reduces drift in estimates that can build up from older price points or earlier-year exchange rates.
Benchmark comparison
| Source | Market Size | Gaps in Research Methodology |
|---|---|---|
| Mordor Intelligence | USD 72.61 B (2026) | |
| Trade Journal A | USD 40.00 B (2025) | Uses a wearable band framing with limited transparency on device inclusion, and it cites end-2025 value without a clear ASP-by-form-factor rebuild or consistent currency timing for the whole year. |
| Industry Data Provider B | USD 12.30 B (2025) | Quarterly snapshot value that is not annualized in a consistent way, and it reflects a specific period mix and promotional pricing, which can understate full-year demand when upgrade cycles peak in other quarters. |
The spread mainly comes from time alignment and what is being measured, whether it is an annual market value for the full fitness tracker category or a narrower wearable band view and even a single-quarter pulse. Our approach keeps the estimate traceable to observable units, mix, and pricing steps, so the number can be re-run and stress-tested when new shipment or pricing signals emerge.
Key Questions Answered in the Report
What is the current market size of the fitness tracker market?
The market reached USD 72.61 billion in 2026 and is projected to climb to USD 154.47 billion by 2031.
Which product segment holds the largest fitness tracker market share today?
Smartwatches lead, accounting for 46.92% of 2025 revenue.
Why is glucose monitoring considered the fastest-growing application?
OTC clearance for continuous glucose monitors in the United States and Europe opened the category to non-insulin users, spurring a 19.97% CAGR outlook through 2031.
Which region will grow the quickest over the forecast period?
Asia-Pacific is expected to post a 19.67% CAGR, driven by cost-efficient manufacturing and rising health awareness among expanding middle classes.