Fish Oil Omega-3 Market Size and Share
Market Overview
| Study Period | 2021 - 2031 |
|---|---|
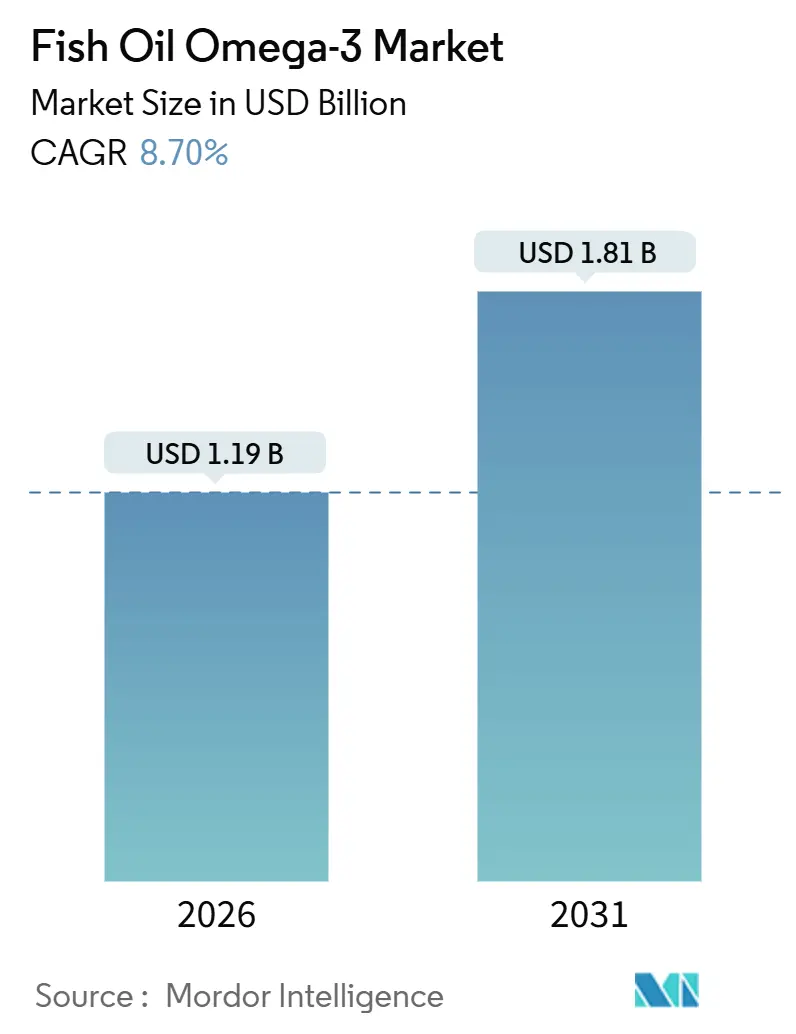
| Market Size (2026) | USD 1.19 Billion |
| Market Size (2031) | USD 1.81 Billion |
| Growth Rate (2026 - 2031) | 8.70% CAGR |
| Fastest Growing Market | Asia Pacific |
| Largest Market | North America |
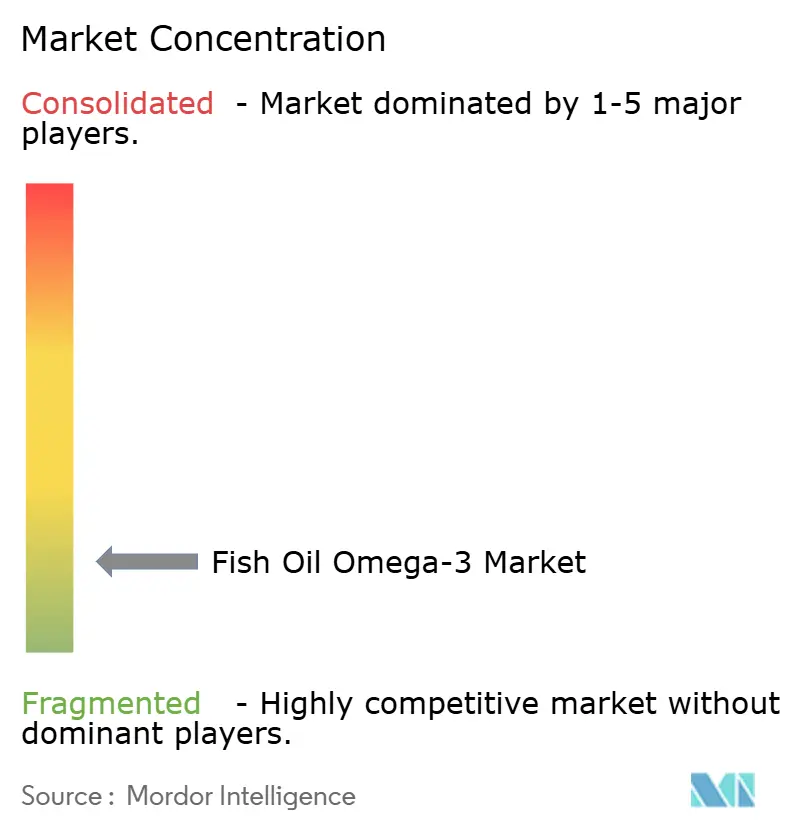
| Market Concentration | Low |
Major Players
*Disclaimer: Major Players sorted in no particular order Image © Mordor Intelligence. Reuse requires attribution under CC BY 4.0. |
|
Fish Oil Omega-3 Market Analysis by Mordor Intelligence
The fish oil omega-3 market size stands at USD 1.19 billion in 2026 and is projected to reach USD 1.81 billion by 2031, translating into an 8.7% CAGR over the forecast period. Surging prescription demand for high-dose eicosapentaenoic acid (EPA), a rebound in Peruvian anchoveta biomass, and the establishment of supercritical CO₂ purification hubs in Chile and Peru are expanding profit margins beyond the conventional dietary supplement arena. In November 2025, cardiology guidelines endorsed a daily intake of ≥2 g EPA for managing residual triglycerides, leading to a significant increase in volumes covered by insurance, as healthcare providers and patients increasingly adopt these recommendations. Concurrently, Norway's reformulations in aquafeed are ensuring elevated levels of EPA/DHA in salmon muscle, which is critical for maintaining the nutritional value of farmed salmon and supporting consumer demand. This, in turn, bolsters upstream crude oil demand, creating a ripple effect across the supply chain. Collectively, these dynamics signal a shift from basic oils to premium concentrates, reinforcing the optimistic long-term growth trajectory of the fish oil omega-3 market.
Key Report Takeaways
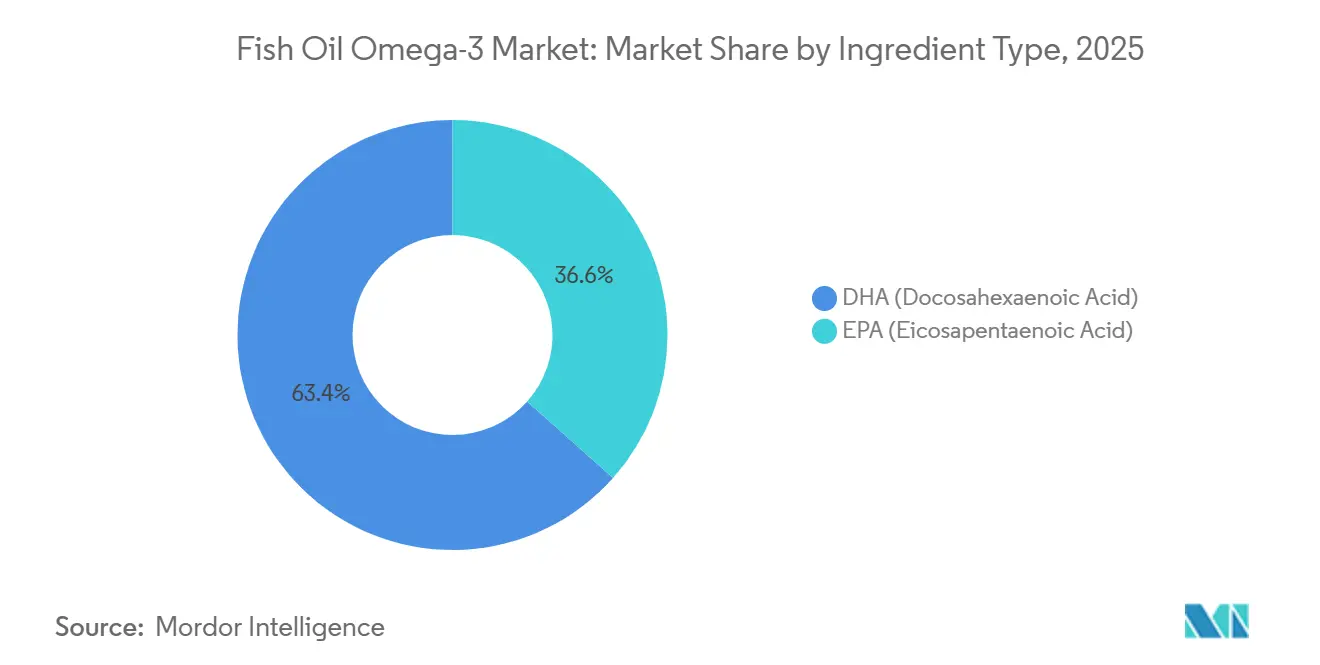
- By ingredient type, docosahexaenoic acid (DHA) led with a 63.42% fish oil omega-3 market share in 2025, whereas EPA is forecast to record a 10.04% CAGR through 2031
- By species, anchovy accounted for 27.03% share of the fish oil omega-3 market size in 2025, while salmon-derived oils are poised to expand at 9.51% CAGR to 2031
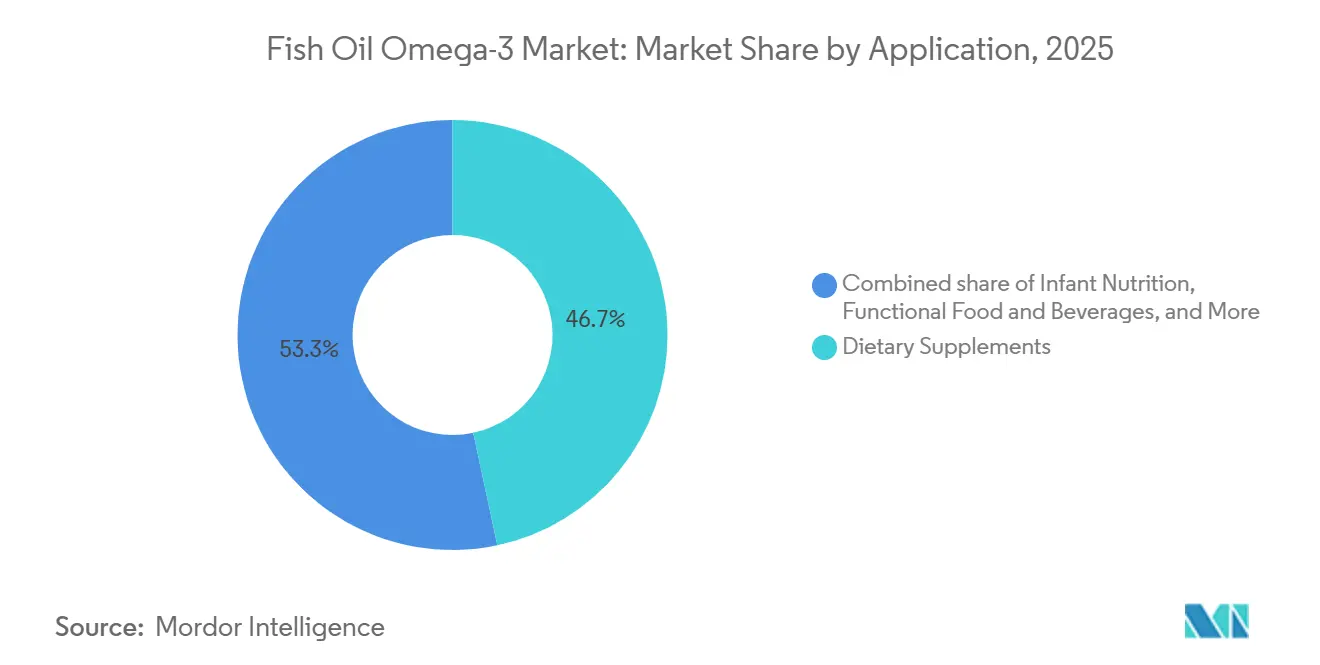
- By application, dietary supplements held 46.66% revenue share in 2025; infant nutrition represents the fastest-growing application, advancing at a 10.44% CAGR through 2031
- By end user, adults represented 78.44% of 2025 revenue, but geriatric cohorts will rise at 6.52% CAGR between 2026-2031
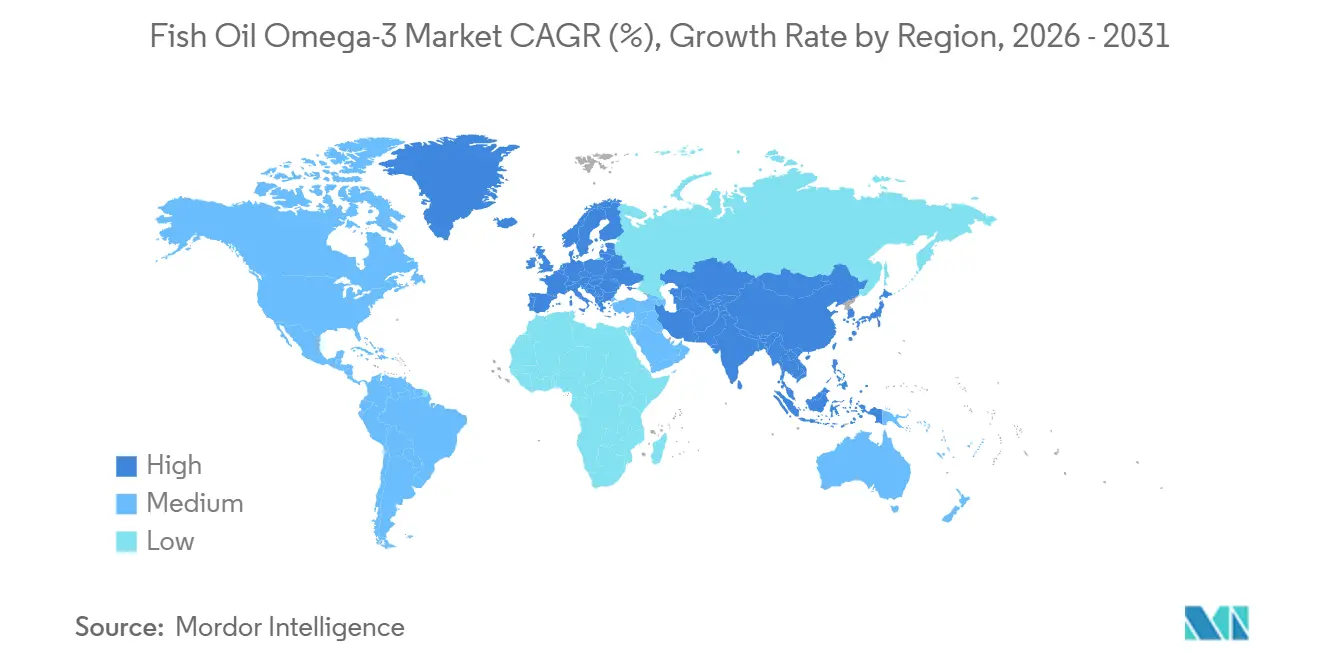
- By geography, North America captured 34.10% revenue in 2025, yet Asia-Pacific is projected to grow at 10.80% CAGR through 2031
Global Fish Oil Omega-3 Market Trends and Insights
Drivers Impact Analysis
| Driver | (~) % Impact on CAGR Forecast | Geographic Relevance | Impact Timeline |
|---|---|---|---|
| Functional-food boom in EPA/DHA-fortified beverages | +1.8% | North America, Europe, Asia-Pacific urban centers | Medium term (2-4 years) |
| Prescription-grade EPA gaining cardiology guideline support | +1.5% | Global, early adoption in the United States, Germany, Japan | Short term (≤2 years) |
| Emergence of supercritical CO₂ purification hubs in South America | +0.9% | Chile, Peru | Long term (≥4 years) |
| Aquafeed reformulations to preserve omega-3 levels in salmon | +0.8% | Norway, Canada, Chile | Medium term (2-4 years) |
| GOED-led quality-seal adoption across Asia e-commerce | +0.7% | China, Japan, South Korea, India | Short term (≤2 years) |
| MSC-certified small-pelagic quotas unlocking premium pricing | +0.6% | Peru, Norway, Iceland | Medium term (2-4 years) |
| Source: Mordor Intelligence | |||
Functional-food boom in EPA/DHA-fortified beverages
In a bid to navigate "softgel fatigue," global beverage giants are infusing EPA and DHA concentrates into their ready-to-drink dairy and plant-based offerings. These liquid formats not only boost bioavailability but also allow for smaller dosages without compromising on label claims, making them a convenient and efficient alternative to traditional supplements. Unilever's 2024 micro-encapsulation patents underscore a strategic push towards taste-masking, effectively eliminating the fishy aftertaste that has hindered widespread acceptance and paving the way for broader consumer adoption. By strategically placing these products in convenience retail outlets, brands are capitalizing on impulse buys, extending their reach beyond traditional pharmacy aisles, and tapping into a wider audience. With a focus on cognitive and cardiovascular benefits, these brands are successfully attracting non-supplement users, broadening the consumer base for the fish oil omega-3 market and driving growth in this segment.The U.S. Food and Drug Administration's approval of qualified health claims for Eicosapentaenoic acid (EPA) and Decosahexanoic acid (DHA) consumption about reduced risk of hypertension and coronary heart disease represents a pivotal shift in regulatory stance[1]U.S. Food and Drug Administration, “FDA Announces Qualified Health Claims for EPA and DHA,” fda.gov.
Prescription-grade epa gaining cardiology guideline support
The American Heart Association recommended high-dose EPA for patients with triglycerides, even if they're on statins[2]American Heart Association, “Prescription Omega-3 Fatty Acids for Triglyceride Management,” heart.org. This endorsement paves the way for icosapent ethyl to be recognized as a reimbursable therapy, leading to a notable shift of volumes from over-the-counter shelves directly into hospital formularies. When insurers make bulk purchases, it not only enhances price visibility for refiners but also prompts upgrades at refineries, focusing on achieving concentrates with ≥96% purity. With the European Society of Cardiology's endorsement anticipated in 2026, a similar trajectory is expected in Germany, France, and Italy, mirroring the U.S. trend. All these developments underscore the strengthening of prescription adoption, bolstering the clinical revenue stream for the fish oil omega-3 market.
Emergence of supercritical co₂ purification hubs in South America
Chile’s Golden Omega and Peru’s TASA have set up supercritical CO₂ plants, ensuring compliance with European Pharmacopoeia monographs and eliminating solvent residues. These advanced facilities enable the production of high-purity pharmaceutical-grade fish oil omega-3, which commands 3-4 times the price of crude oil. This significant price premium supports capital-intensive expansions, allowing the companies to enhance and consolidate regional production capacity. By forging direct supply agreements with Japanese and South Korean pharmaceutical firms, they bypass European toll refiners, thereby capturing additional margins and improving profitability. Furthermore, financial support from multilateral lenders reduces their cost of capital, strengthening South America's competitive position in the global market. These strategic initiatives collectively embed long-term supply security and resilience into the fish oil omega-3 market.
Aquafeed reformulations to preserve omega-3 levels in salmon
Norwegian formulators Skretting and BioMar have re-engineered diets to ensure farmed salmon fillets contain 2-2.5 g of EPA/DHA per 100 g, restoring the fish's nutritional appeal and addressing consumer demand for healthier food options. By using retention agents to curb fatty acid oxidation, they've managed to lower marine oil inclusion rates without sacrificing flesh quality, which is critical for maintaining the product's market competitiveness. Retailers promoting "high-omega-3 salmon" command price premiums, channeling added value back to feed suppliers and incentivizing innovation in feed formulations. Cargill's EWOS division employs precision-feeding protocols, adjusting dosages based on growth phases to optimize feed-conversion efficiency and reduce waste. This heightened demand for aquafeed, driven by the need for sustainable and efficient production, in turn, bolsters upstream crude-oil use in the fish oil omega-3 market.
Restraint Impact Analysis
| Restraint | (~) % Impact on CAGR Forecast | Geographic Relevance | Impact Timeline |
|---|---|---|---|
| Volatile Peruvian anchoveta biomass and quota suspensions | -1.2% | South America, global buyers | Short term (≤2 years) |
| Surging microalgae capacity lowering entry barriers | -0.9% | US, Netherlands, Brazil | Medium term (2-4 years) |
| Polar contaminant limits tightening in EU and China | -0.7% | Europe, China | Short term (≤2 years) |
| Deep-sea freight decarbonization costs inflating CIF prices | -0.5% | Global trade lanes | Long term (≥4 years) |
| Source: Mordor Intelligence | |||
Volatile Peruvian anchoveta biomass and quota suspensions
Late in 2023, El Niño events led to a significant decline in anchoveta recruitment, prompting quota suspensions that caused crude oil prices to surge by 34% in just two months. This disruption highlighted the vulnerability of the anchoveta supply chain to climatic events. While a 3 million-tonne quota set for the first half of 2025 indicates a recovery in biomass, ongoing trends of ocean warming pose a long-term threat to the stability and predictability of this supply. Pharmaceutical companies, which depend on consistent EPA/DHA inputs for their validated dossiers, face challenges as any variance in supply can disrupt production and regulatory compliance. Although there is a shift towards using Norwegian herring or Chilean jack mackerel as alternative sources, this approach merely transfers the ecosystem risk rather than resolving it. Consequently, the volatility of anchoveta continues to exert significant pressure on the fish oil omega-3 market in the short term, raising concerns about the sustainability of the supply chain.
Surging microalgae capacity lowering entry barriers
Evonik and Corbion's Veramaris unit boosted Nebraska's fermentation capacity from 15,000 tons to 25,000 tons, significantly increasing the production of vegan EPA/DHA oils free from marine contaminants. These oils provide a sustainable alternative to traditional fish oils, catering to the growing demand for plant-based and environmentally friendly products. With declining costs in algae units, buyers are positioned to limit fish-oil prices, creating a shift in market dynamics. DSM-Firmenich predicts algae oils might capture 18-22% of supplement volumes by 2030, heightening competition and pressuring traditional fish oil producers to innovate. Modular bioreactors, bypassing coastal siting limitations, are streamlining supply chains by enabling production closer to demand centers. Meanwhile, the looming threat of commoditization is undermining upstream pricing power in the fish oil omega-3 market, potentially reshaping the competitive landscape.
Segment Analysis
By Ingredient Type: EPA Ascends to Pharmaceutical Status
With a projected CAGR of 10.04%, EPA-based ingredients are poised to outpace the broader fish oil omega-3 market, eclipsing the growth of DHA, even though DHA commands a dominant 63.42% revenue share in 2025. Hospitals and prescription channels are increasingly gravitating towards EPA concentrates with a purity of ≥96%. These premium concentrates, priced at about three to four times more than balanced EPA/DHA blends, are enabling an expansion in value capture, even if the volumes remain modest. To cater to these specialized demands, refiners are harnessing advanced chromatography columns and fractionation systems. These technologies adeptly segregate crude fish oil into distinct EPA-rich and DHA-rich streams, ensuring compliance with the varied pharmaceutical and nutritional regulations. While DHA maintains its supremacy in infant formulas and cognitive-health products like gummies, its growth trajectory is notably slower. This deceleration underscores a strategic shift towards the more lucrative therapeutic EPA within the fish oil omega-3 landscape. Collectively, this dual demand profile bolsters pricing power for specialty-grade outputs in contrast to their commodity-grade counterparts.
The shifting product landscape is sculpting unique supply-chain dynamics for both EPA and DHA. Pharmaceutical-grade EPA is mandated to traverse GMP-compliant facilities, adhering to stringent cleaning and documentation standards. In contrast, DHA supplements generally align with dietary and nutraceutical benchmarks. Processors adept in managing both streams enjoy a strategic advantage, allowing them to pivot capacity between wellness and clinical applications as market regulations and reimbursement avenues shift. Research and development efforts are increasingly focusing on EPA pro-drugs and advanced delivery mechanisms. These innovations promise heightened bioavailability and the potential to expand approved medical indications in the coming decade. Meanwhile, capital markets are showing a pronounced preference for companies boasting dual-stream capabilities and advanced purification technologies, perceiving them as prime candidates to harness the full spectrum of opportunities within the fish oil omega-3 market.
By Species: Salmon Oils Rise Amid Anchoveta Volatility
In 2025, anchovy-derived oils dominated the fish oil omega-3 market, capturing a 27.03% volume share. This dominance was driven by bountiful Peruvian harvests and well-established supply chains, which efficiently deliver cost-effective EPA/DHA concentrates for both supplements and aquaculture feeds. When sourced sustainably, these small pelagic fish yield high omega-3 levels with minimal contaminants. This quality supports a wide range of applications, from nutraceuticals to animal nutrition, even in the face of quota fluctuations in the South Pacific. While herring and jack mackerel offer additional volumes, they face challenges with tightening quotas in the North Sea and Pacific. This dynamic reinforces the anchovy's stable baseline. In Norway, producers not only rely on wild catches but also refine salmon processing trimmings into low-contaminant oils. These oils, certified by MSC and Friends of the Sea, command sustainability premiums, helping to buffer revenue volatility. This diverse species mix guarantees a consistent throughput, even amidst the unpredictable nature of fishery yields.
Salmon oils are on a rapid ascent, with projections indicating a 9.51% CAGR growth rate through 2031. This surge is largely attributed to advancements in aquaculture, which are refining feed formulations and boosting the omega-3 content in farmed salmon fillets. Norwegian operations are turning salmon viscera by-products into premium concentrates. By leveraging dual certifications, they not only command elevated prices but also seamlessly integrate into retail marketing, positioning their salmon as a direct health benefit due to its high omega-3 content. This vertical integration fosters unique synergies: heightened demand for salmon fillets amplifies the availability of by-products, and the reverse is equally true. Such dynamics solidify salmon's pivotal role in the fish oil omega-3 value chain. Refiners are capitalizing on this trend, achieving monetization across multiple products and balancing the inherent risks of wild captures with the stability of farmed supplies. The overall trajectory highlights salmon's escalating significance in addressing the world's growing appetite for omega-3s.
By Application: Infant Nutrition Surges Ahead of Supplements
In 2025, dietary supplements dominated the fish oil omega-3 market, securing a 46.66% revenue share. This surge was fueled by consumer preference for convenient formats, such as capsules, soft gels, and liquids, delivering EPA/DHA benefits for heart, brain, and joint health. The segment's strength lies in the widespread awareness of omega-3 advantages and its diverse formats, appealing even to those averse to pills. This has allowed it to maintain its lead amidst consistent growth in both retail and e-commerce. While prescription therapies, like Lovaza, offer concentrated formulations for hypertriglyceridemia and command a premium value per unit, their overall market share remains limited due to lower sales volumes compared to over-the-counter alternatives. Functional foods and beverages, such as fortified milks and smoothies, make incremental contributions by targeting casual consumers. This blend of over-the-counter accessibility and pharmaceutical premium pricing underscores the market's diverse landscape.
Infant nutrition is the market's fastest-growing segment, projected to expand at a 10.44% CAGR through 2031. This growth is largely driven by mandates from the WHO and EFSA, emphasizing DHA's role in brain and eye development. To align with these stringent standards, formulators are focusing on low-odor, 24-month stable concentrates, carving out high-margin niches despite the smaller volumes. Regulatory changes, notably the EU's 2021 mandate for 20-50 mg DHA per 100 kcal, have further spurred adoption, especially among working parents seeking products that closely mimic breast milk. In response, processors are innovating with micro-encapsulated powders and pharma-grade formulations, catering to both the infant nutrition and prescription markets. This strategy not only hedges against market cyclicality but also ensures a foothold in both wellness and clinical sectors. By diversifying their portfolios, suppliers are well-positioned to reap benefits from both mainstream supplements and niche nutrition markets.
Note: Segment shares of all individual segments available upon report purchase
By End User: Seniors Drive Value, Infants Drive Growth
In 2025, adults commanded a dominant 78.44% share of the fish oil omega-3 market, driven by a surge in wellness-focused softgel adoption and an uptick in EPA prescriptions for heart health. This segment not only emphasizes heart and cognitive health but also taps into the burgeoning "beauty from within" trend, offering skin hydration solutions. These products, presented in user-friendly formats, resonate with a diverse audience. Meanwhile, children's gummies serve as a popular transition, bridging the gap between infant products and adult supplements, ensuring consistent family usage. Though infants represent a smaller segment, their fortified formulas command premium prices. The adult-centric focus highlights omega-3's preventive health significance, especially in countering lifestyle-induced deficiencies.
Geriatric consumers, the market's fastest-growing segment, are projected to expand at a 6.52% CAGR through 2031. As the elderly increasingly prioritize cognitive health and cardiovascular safety, their spending on clinical-grade products rises. This is evident in their focus on joint mobility, memory enhancement, and anti-inflammatory benefits. Recognizing the diverse needs, the industry tailors offerings - from flavored gummies for kids to potent capsules for seniors. This specialization, backed by rigorous R&D and claim validation, raises entry barriers. While established players navigate this intricate landscape to protect their market share, it's the infants, with their DHA-fortified formulas, who contribute the most incremental revenue. By diversifying portfolios to cater to all age groups, stakeholders effectively hedge against demand fluctuations in the fish oil omega-3 market.
Geography Analysis
In 2025, North America accounted for 34.10% of the revenue, bolstered by Medicare Part D's reimbursement of icosapent ethyl. IMS Health noted a surge, recording 2.3 million prescriptions in Q4 2025, marking a robust 47% year-over-year growth. While Canada's over-the-counter market and Mexico's fortified-food initiatives contribute to the demand, the U.S. stands out, driven by its advanced clinical infrastructure. As generics make their entrance, the competitive landscape intensifies. However, premium formulations, backed by GOED and MSC seals, command a pricing edge, ensuring North America's profitability in the fish oil omega-3 arena.
Asia-Pacific is set to lead with a projected 10.80% CAGR through 2031. China's SAMR has harmonized contaminant limits with EU benchmarks, steering imports towards purer oils. Japan's FOSHU initiative, promoting EPA/DHA health benefits, coupled with its aging demographic, ensures steady demand. In India, the push for omega-3s in staple edible oils broadens market reach. Platforms like Tmall and Rakuten are revolutionizing direct-to-consumer sales, enabling smaller global brands to tap into vast audiences without the burden of physical stores.
Europe's robust presence is anchored in the supplement-centric cultures of Germany, the UK, and Scandinavia.Europe, while navigating stringent regulatory waters and championing sustainability, remains a formidable player. With the European Food Safety Authority at the helm, the region is making strides in global novel food approvals and safety evaluations[3]European Union, "EFSA's updated guidance on novel food applications", european-union.europa.eu. Norway reaps rewards from its integrated approach, merging herring catches with salmon processing and top-tier purification. Though Southern Europe trails in per-capita consumption, there's a noticeable uptick, especially with functional drinks targeting heart health. Overall, Europe's regulatory landscape solidifies its role as a cornerstone in the global fish oil omega-3 market.
Competitive Landscape
The fish oil omega-3 market concentration remains fragmented capacity spread across Peruvian fishmeal processors, Norwegian salmon-oil refiners, and Chilean supercritical specialists. KD Pharma's acquisition of DSM-Firmenich's Marine Lipids in October 2024, which consolidated seven plants across three continents, still accounts for less than 15% of refined volumes, emphasizing the industry's inherent fragmentation. This limited market share, despite significant consolidation, highlights the challenges of achieving dominance in a highly diversified market. Meanwhile, BASF's divestiture to Louis Dreyfus in September 2025 highlights a shift, as conglomerates exit niche nutrition segments, creating opportunities for supply-chain-focused traders to expand their presence and capitalize on emerging gaps.
Strategic approaches differ significantly. Major players are mitigating anchoveta market risks by investing in microalgae fermentation, a sustainable alternative that reduces dependency on traditional fish oil sources. Mid-tier companies are prioritizing supercritical CO₂ technology to meet pharmaceutical-grade standards, ensuring compliance with stringent regulatory requirements and catering to the growing demand for high-purity omega-3 products. Additionally, direct-to-consumer brands are utilizing blockchain traceability and GOED seals to address counterfeit concerns in the Asian e-commerce market, achieving double-digit price premiums by building consumer trust and ensuring product authenticity.
Technological advancements are centered on continuous chromatography, enzymatic esterification, and short-path distillation, which are critical for improving product quality and production efficiency. At the same time, sustainability certifications remain a prerequisite for retail market access, as consumers and retailers increasingly demand environmentally responsible practices. These varied strategies reflect the dynamic and competitive nature of the fish oil omega-3 market, where innovation and adaptability are key to maintaining a competitive edge.
Fish Oil Omega-3 Industry Leaders
-
BASF SE
-
Pelagia AS
-
DSM-Firmenich
-
Olvea Group
-
Croda International plc
- *Disclaimer: Major Players sorted in no particular order
Recent Industry Developments
- March 2024: dsm-firmenich has unveiled its latest addition to the life's omega-3 nutraceutical lineup: life'sDHA B54-0100. dsm touts that life'sDHA B54-0100 packs a punch, offering 545mg of DHA and 80mg of EPA per gram, translating to a robust 620mg of omega-3s in a single serving. This concentrated oil empowers dietary supplement manufacturers to craft smaller, cost-effective capsules without compromising on bioactivity.
- March 2024: Epax launched Omega 3-9-11, promoting benefits for brain and heart health while also enhancing skin vitality. Omega 3-9-11 boasts the highest concentration of an oil that merges EPA and DHA, both long-chain polyunsaturated fatty acids (LC-PUFAs), with the lesser-known long-chain monounsaturated fatty acids (LC-MUFAs).
- March 2024: Bioriginal Food and Science Corp launched a sustainable range of Omega-3 fish oils in collaboration with POS Biosciences. The products include fish oils and a mixture of algal and fish oils.
- March 2024: Pelagia has expanded its operations to meet the growing demand for high-quality fish. The Shetland Catch plant features a new cold storage facility and improved quay amenities, including container handling capabilities. This new cold storage spans 4,000 square meters and is located on land reclaimed at Arlanda.
Global Fish Oil Omega-3 Market Report Scope
Fish oil omega-3 improves good cholesterol levels and reduces blood triglyceride levels. It positively helps people who have or are prone to cardiovascular diseases.
The global fish oil omega-3 market is segmented by species, application, and geography. By species, the market is segmented into fish oil derived from species such as anchovy, cod liver, menhaden, tuna, sardine, salmon, and other species. Further, based on application, the market is segmented into dietary supplements, infant nutrition, animal nutrition, and other applications. Based on geography, the market is segmented into North America, Europe, Asia-Pacific, South America, Middle East, and Africa.
For each segment, the market sizing and forecasts have been done based on value (in USD million).
| EPA (Eicosapentaenoic Acid) |
| DHA (Docosahexaenoic Acid) |
| Anchovy |
| Cod Liver |
| Salmon |
| Tuna |
| Other Species |
| Dietary Supplements | Congnitive Health |
| Heart Health | |
| Other Health Applications | |
| Infant Nutrition | |
| Functional Food and Beverage | |
| Other Applications |
| Adults |
| Geriatric |
| Children |
| North America | United States |
| Canada | |
| Mexico | |
| Rest of North America | |
| Europe | Germany |
| United Kingdom | |
| France | |
| Italy | |
| Spain | |
| Russia | |
| Netherlands | |
| Poland | |
| Belgium | |
| Sweden | |
| Rest of Europe | |
| Asia-Pacific | China |
| India | |
| Japan | |
| South Korea | |
| Australia | |
| Indonesia | |
| Thailand | |
| Singapore | |
| Rest of Asia-Pacific | |
| South America | Brazil |
| Argentina | |
| Colombia | |
| Chile | |
| Peru | |
| Rest of South America | |
| Middle East and Africa | Saudi Arabia |
| United Arab Emirates | |
| Nigeria | |
| Egypt | |
| Morocco | |
| Turkey | |
| South Africa | |
| Rest of Middle East and Africa |
| By Type | EPA (Eicosapentaenoic Acid) | |
| DHA (Docosahexaenoic Acid) | ||
| By Species | Anchovy | |
| Cod Liver | ||
| Salmon | ||
| Tuna | ||
| Other Species | ||
| By Application | Dietary Supplements | Congnitive Health |
| Heart Health | ||
| Other Health Applications | ||
| Infant Nutrition | ||
| Functional Food and Beverage | ||
| Other Applications | ||
| By End User | Adults | |
| Geriatric | ||
| Children | ||
| By Geography | North America | United States |
| Canada | ||
| Mexico | ||
| Rest of North America | ||
| Europe | Germany | |
| United Kingdom | ||
| France | ||
| Italy | ||
| Spain | ||
| Russia | ||
| Netherlands | ||
| Poland | ||
| Belgium | ||
| Sweden | ||
| Rest of Europe | ||
| Asia-Pacific | China | |
| India | ||
| Japan | ||
| South Korea | ||
| Australia | ||
| Indonesia | ||
| Thailand | ||
| Singapore | ||
| Rest of Asia-Pacific | ||
| South America | Brazil | |
| Argentina | ||
| Colombia | ||
| Chile | ||
| Peru | ||
| Rest of South America | ||
| Middle East and Africa | Saudi Arabia | |
| United Arab Emirates | ||
| Nigeria | ||
| Egypt | ||
| Morocco | ||
| Turkey | ||
| South Africa | ||
| Rest of Middle East and Africa | ||
Key Questions Answered in the Report
What is the current value of the fish oil omega-3 market?
The fish oil omega-3 market size stands at USD 1.19 billion in 2026 and is forecast to reach USD 1.81 billion by 2031.
Which ingredient type is growing fastest?
EPA concentrates are poised for the strongest expansion, set to grow at a 10.04% CAGR through 2031 as prescription demand accelerates.
Why is Asia-Pacific the fastest-growing region?
Middle-class expansion, stricter purity regulations, and functional-food label approvals in China, Japan, and India drive a 10.80% regional CAGR.
How is freight decarbonization affecting prices?
IMO 2030 mandates add 15-20% surcharges to refrigerated shipping, increasing landed costs and compressing exporter margins.
Page last updated on:


