
Market Overview
| Study Period | 2020 - 2031 |
|---|---|
| Market Size (2026) | USD 10.56 Billion |
| Market Size (2031) | USD 16.41 Billion |
| Growth Rate (2026 - 2031) | 9.22 % |
| Fastest Growing Market | Asia Pacific |
| Largest Market | North America |
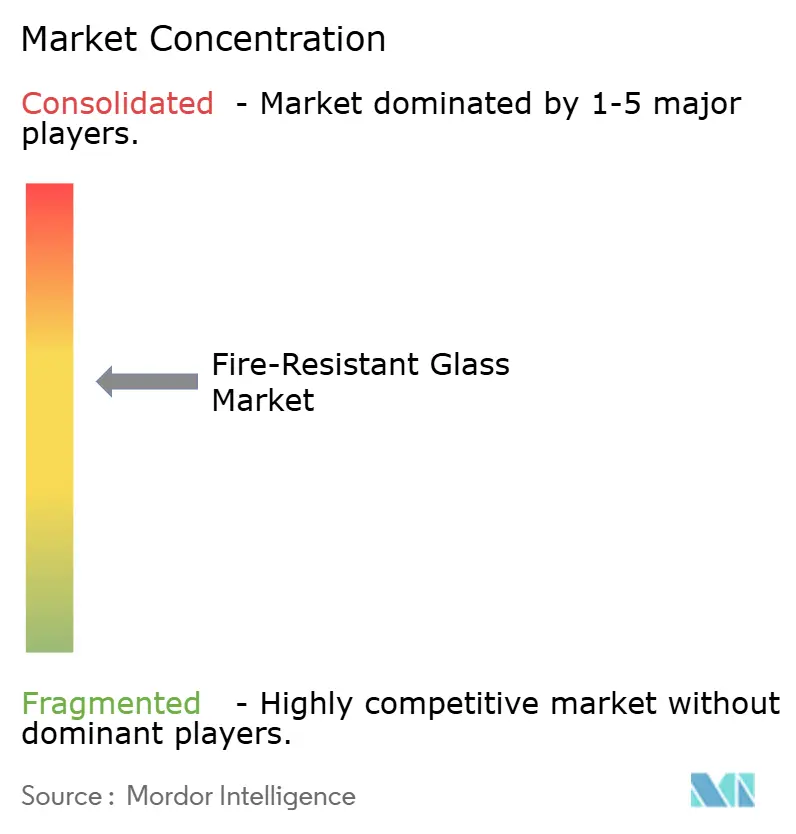
| Market Concentration | Medium |
Major Players *Disclaimer: Major Players sorted in no particular order Image © Mordor Intelligence. Reuse requires attribution under CC BY 4.0. | |
Fire-Resistant Glass Market Analysis by Mordor Intelligence
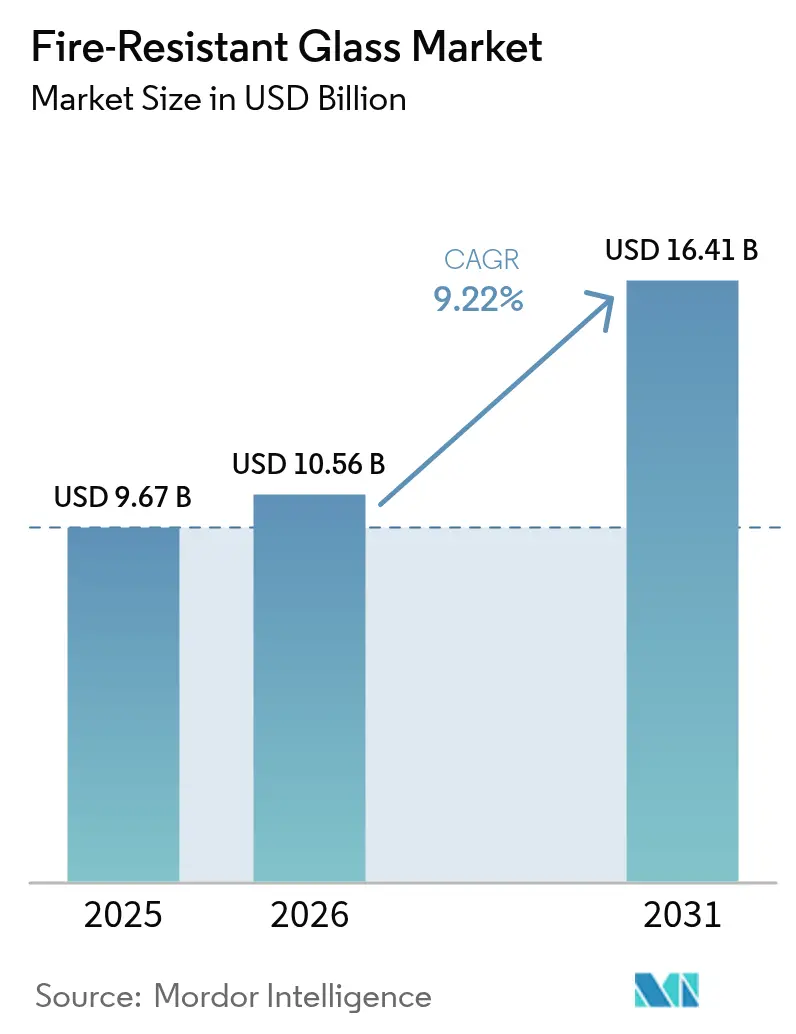
The Fire-Resistant Glass Market size is expected to grow from USD 9.67 billion in 2025 to USD 10.56 billion in 2026 and is forecast to reach USD 16.41 billion by 2031 at 9.22% CAGR over 2026-2031. Expanding high-rise construction across Asia-Pacific and the Middle East, the tightening of global fire-safety codes, and the rapid commercialisation of hybrid smart-tint fire-resistant glazing all underpin this growth trajectory. Regulatory momentum, led by China’s GB 55037-2022 standard and the UAE Fire and Life Safety Code 2018, is eliminating non-compliant products and elevating demand for certified solutions. Construction incentives such as Section 179 of the U.S. Internal Revenue Code add a financial pull, while insurance premium discounts for fire-rated glazing continue to unlock retrofit opportunities. On the technology side, manufacturers are moving quickly from single-function panes to value-added laminates that integrate fire protection, daylight control, and energy efficiency—an evolution that widens margins and differentiates supply.
Key Report Takeaways
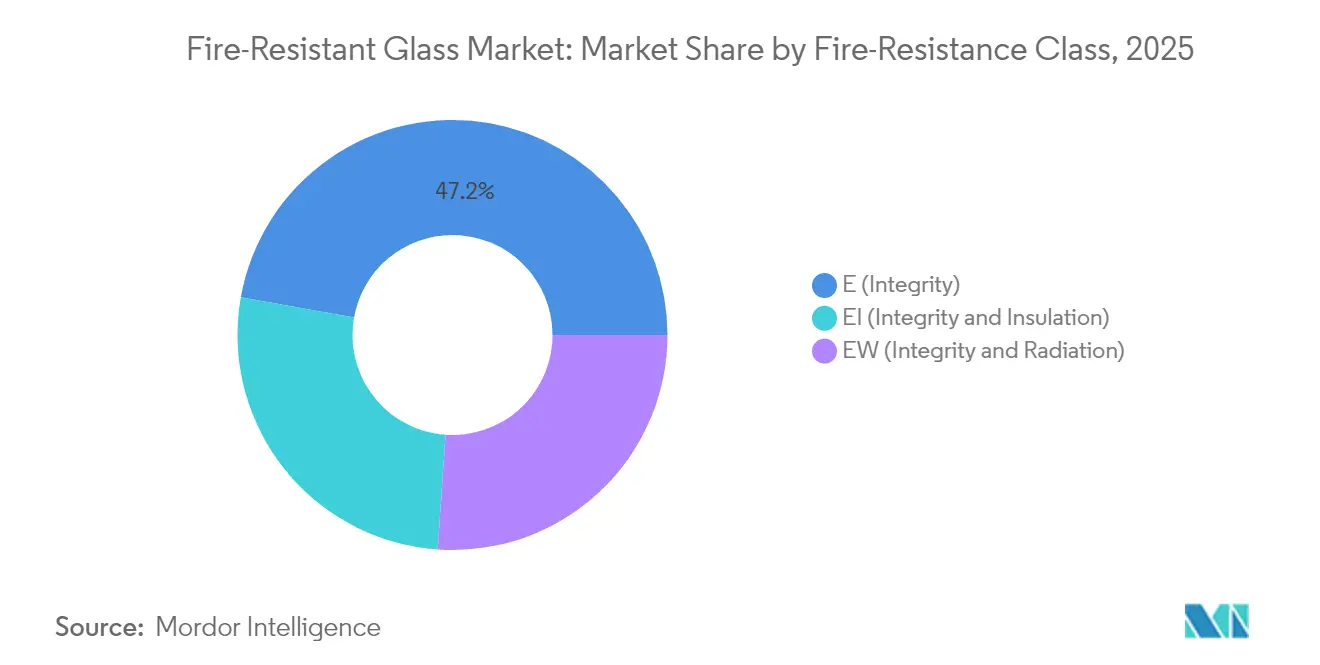
- By fire-resistance class, E (Integrity) glass led with 47.20% revenue share in 2025, while EI (Integrity + Insulation) is poised for a 10.11% CAGR through 2031.
- By product type, ceramic solutions captured 39.20% of the fire-resistant glass market share in 2025, whereas gel-filled variants are forecast to grow at 9.92% CAGR.
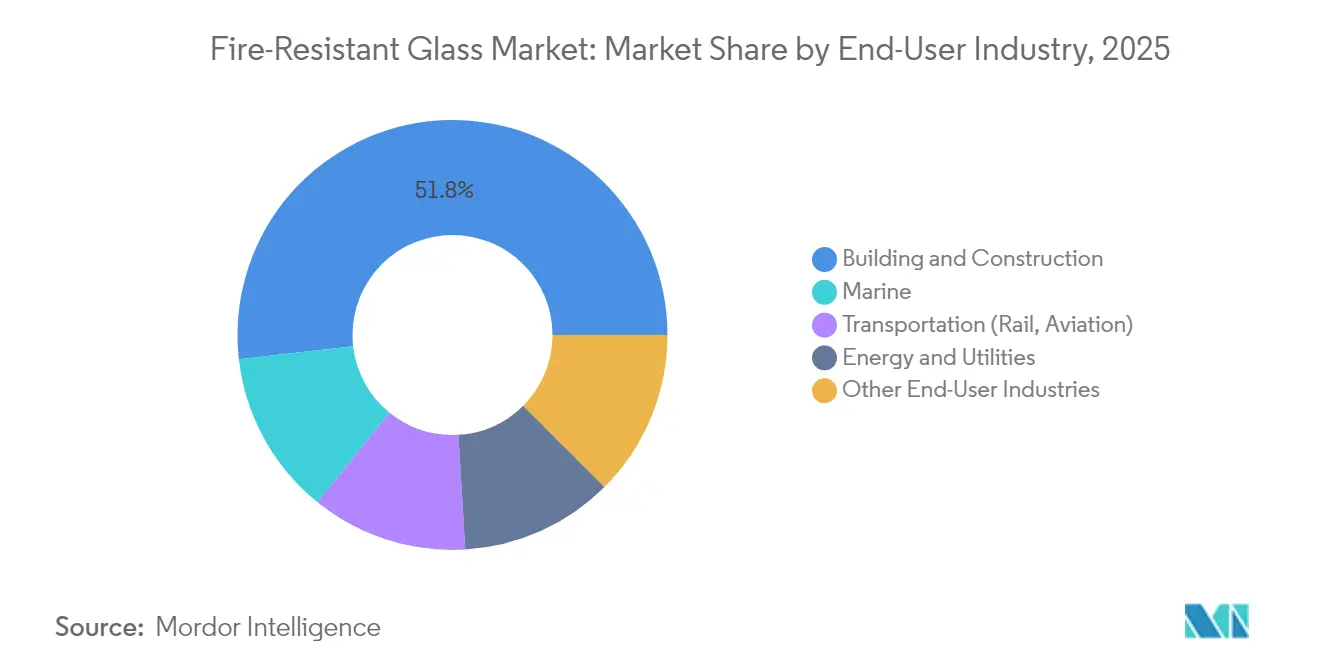
- By end-user industry, building and construction accounted for 51.80% share of the fire-resistant glass market size in 2025; marine applications advance at a 9.38% CAGR to 2031.
- By geography, North America commanded 31.60% share in 2025, although Asia-Pacific is the fastest-growing region at 9.55% CAGR over the outlook period.
Note: Market size and forecast figures in this report are generated using Mordor Intelligence’s proprietary estimation framework, updated with the latest available data and insights as of 2026.
Global Fire-Resistant Glass Market Trends and Insights
Drivers Impact Analysis*
| Driver | (~) % Impact on CAGR Forecast | Geographic Relevance | Impact Timeline |
|---|---|---|---|
| Surge in high-rise commercial construction in Asia Pacific and Middle East | +2.1% | Asia-Pacific core, Middle East expansion | Medium term (2-4 years) |
| Stricter global fire-safety regulations | +1.8% | Global, with concentration in North America & EU | Short term (≤ 2 years) |
| Insurance incentives for using fire-rated glazing | +0.9% | North America & EU primary markets | Medium term (2-4 years) |
| Hybrid smart-tint and fire-resistant glass innovations | +1.2% | Global, early adoption in developed markets | Long term (≥ 4 years) |
| Modular prefab façades need lightweight fire glass | +0.8% | North America & EU, expanding to APAC | Medium term (2-4 years) |
| Hydrogen-ready industrial sites demand blast-plus-fire glass | +0.6% | Industrial corridors in North America, EU, Japan | Long term (≥ 4 years) |
| Source: Mordor Intelligence | |||
Surge in High-Rise Commercial Construction in Asia-Pacific and Middle East
Rapid vertical urbanisation has elevated fire safety to board-level priority. China’s GB 55037-2022 requires qualified fire-resistant glazing in all new towers above 100 m height, prompting developers to upgrade specification baselines[1]. Dubai’s revised building code, which caps facade glazing area yet demands higher thermal and fire performance, is catalysing premium demand in the Gulf. Developers now seek integrated solutions that meet multiple performance targets in a single pane, enabling suppliers to price above commodity levels while accelerating overall adoption of certified products across the fire-resistant glass market.
Stricter Global Fire-Safety Regulations
The 2024 International Building Code strengthens wall continuity and requires lab-tested glazing assemblies for any rated opening—tightening compliance globally. The UAE “Ten-Point Approach” mandates Civil Defence approvals for facade materials and eliminates lower-grade imports. Similar rule harmonisation in Europe increases cross-border acceptance of certified panes. Together these policies expand the qualified addressable base for the fire-resistant glass market, especially for EI-class products.
Insurance Incentives for Using Fire-Rated Glazing
In North America, insurers are aligning premium schedules with documented life-safety benefits of rated glass. Section 179 allows companies to expense up to USD 1.22 million of qualifying fire-protection equipment in the year of purchase, which improves payback calculations for retrofit projects[2]. Insurer-led recognition has moved adoption from reactive compliance toward proactive risk mitigation, creating a retrofit engine that complements new-build demand.
Hybrid Smart-Tint and Fire-Resistant Glass Innovations
Schott’s PYRANOVA Smart combines EI-120 fire performance with switchable tint that modulates daylight and HVAC load, demonstrating where the product roadmap is heading. Developers value reduced glare, lower cooling loads, and code compliance in a single unit, allowing premium price realisation. Similar launches from Saint-Gobain and AGC illustrate a technology arms race that will elevate specification standards in the fire-resistant glass market through 2030.
Restraints Impact Analysis*
| Restraint | (~) % Impact on CAGR Forecast | Geographic Relevance | Impact Timeline |
|---|---|---|---|
| Shortage of certified installers and fabricators | -1.4% | Global, acute in emerging markets | Short term (≤ 2 years) |
| Supply-chain risk for sodium-/boro-silicate feedstock | -0.8% | Global manufacturing hubs | Medium term (2-4 years) |
| Rating-equivalence gaps for multi-material façades | -0.6% | Developed markets with complex building codes | Medium term (2-4 years) |
| Source: Mordor Intelligence | |||
Shortage of Certified Installers and Fabricators
Even the most advanced pane loses its rating if incorrectly installed. Rapid construction growth in India, Indonesia, and parts of Africa is outpacing the pool of certified installers, delaying project completions and elevating cost premiums. International suppliers are responding with on-site training programs and turnkey service bundles, yet near-term capacity constraints continue to temper growth in the fire-resistant glass market.
Supply-Chain Risk for Sodium- / Boro-Silicate Feedstock
Borosilicate formulations rely on stable borate supply. Recent consolidation moves—such as Sibelco’s purchase of Strategic Materials in the recycling space—underline the push to secure feedstock and reduce virgin material exposure. Any recurring shortages heighten cost volatility, which in turn leads contractors to delay procurement or seek alternate facade materials.
*Our forecasts treat driver/restraint impacts as directional, not additive. The impact forecasts reflect baseline growth, mix effects, and variable interactions.
Segment Analysis
By Fire-Resistance Class: Integrity Standards Drive Market Evolution
The E class segment headlines the landscape with 47.20% of the fire-resistant glass market size in 2025, firmly positioned as the affordable baseline for compartmentation in office towers and schools. Volume dominance is rooted in simple performance requirements that target flame and smoke containment without thermal-insulation mandates. Upgrading projects often move directly from wired glass to E class panes, ensuring repeat business for incumbents. Yet specification drift toward EI class is accelerating. Post-incident reviews in China and Singapore show that insulation ratings better protect stairwells and refuge floors, nudging architects to embrace EI class despite higher cost.
EI class’s 10.11% CAGR through 2031 reflects this safety-first pivot. As regulatory bodies adopt holistic life-safety metrics, EI-certified panes become indispensable in atria, transportation hubs, and critical infrastructure. Ongoing product innovation such as hydrogel-silicate interlayers that double as acoustic dampers adds multipurpose value, increasing adoption. EW class remains a niche choice where radiant-heat reduction rather than full insulation is required, yet it serves as a mid-price bridge that eases budget constraints on government projects. The upshot is a performance hierarchy that gradually migrates demand from basic to advanced ratings, fortifying the long-term outlook for the fire-resistant glass market.

By Product Type: Ceramic Solutions Lead Technical Innovation
Ceramic glass held 39.20% of the fire-resistant glass market share in 2025 because of its ability to withstand 1 000 °C without optical distortion. Landmark projects such as New York’s super-slender towers rely on transparent ceramics to maintain panoramic views while meeting local fire code. Even so, weight and cost continue to invite alternatives. Laminated systems combine ceramics with intumescent layers to boost impact resistance, edging into security glazing budgets. Tempered solutions remain relevant in less demanding applications but face erosion where EI ratings are mandated.
Gel-filled panes top the growth chart with a 9.92% CAGR outlook. Their 30% weight saving over ceramics is a game changer for unitised prefab facades that aim for zero external mullions. Manufacturers are advancing bio-based gel chemistries that reduce embodied carbon, aligning with green building certifications. Wired glass retains a foothold in institutional retrofits because of familiarity and local code equivalence. Polycarbonate composites address niche transit and defense uses where ballistic resistance and weight are critical. Each material tier occupies clear performance-price coordinates, allowing suppliers to segment the fire-resistant glass market precisely.
By End-User Industry: Construction Dominance Faces Marine Disruption
Building and construction contributed 51.80% to the fire-resistant glass market size in 2025. Code cycles in North America and the EU continuously raise minimum ratings, ensuring ongoing retrofit churn. Hospitals, data centers, and education campuses add steady, specification-driven demand. Energy and utilities remain stable with petrochemical revamps and LNG terminals accounting for periodic spikes. Transportation niches—rail, air, and tunnel segments—value slimline EI-60 panes that combine blast and fire criteria, but overall share stays below 10%.
Marine applications grow fastest at 9.38% CAGR. Offshore platforms, cruise liners, and coastal LNG hubs face stricter SOLAS updates that call for 120-minute integrity with salt-spray durability. California’s revised marine terminal rules require fire-rated glazing in control rooms and cable tunnels, setting a precedent likely to spread to Asia-Pacific yards. Suppliers with Type-approval certificates from class societies are best positioned to capture this upswing, expanding the diversity of the fire-resistant glass market.
Geography Analysis
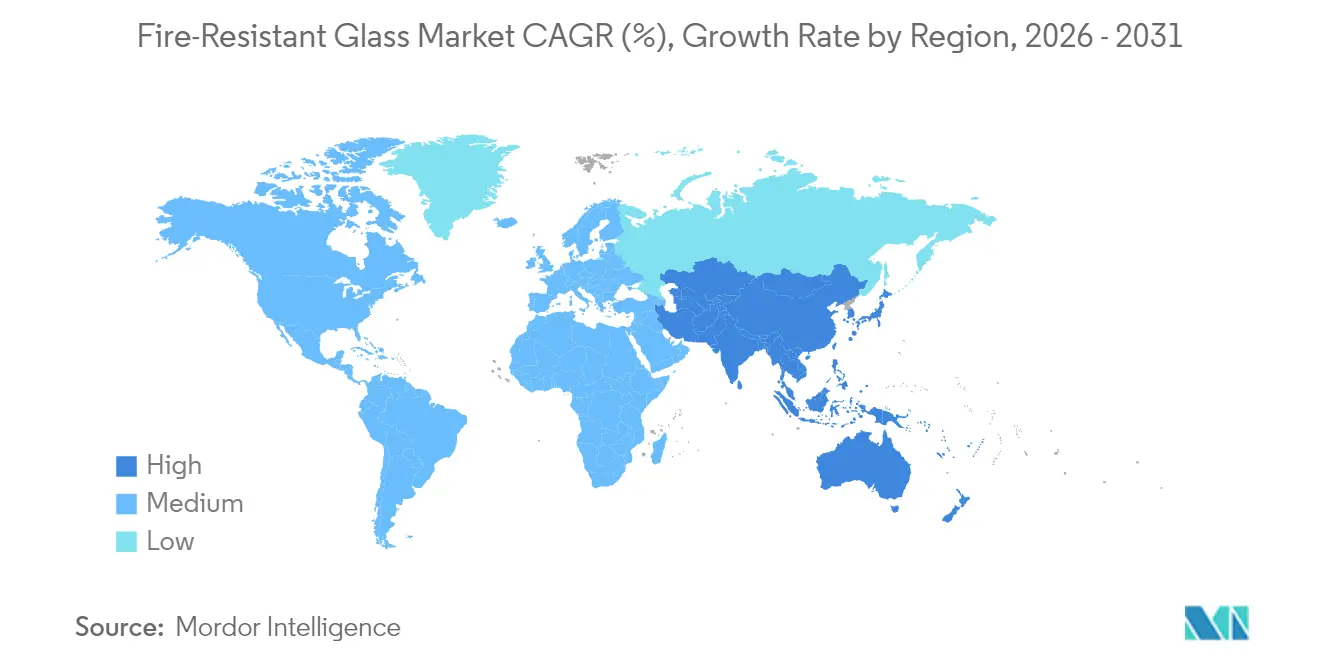
North America leads the fire-resistant glass market with a 31.60% revenue share in 2025, supported by the 2024 International Building Code, the International Fire Code, and robust insurance incentives. Large retrofit programs in Chicago, New York, and Toronto focus on bringing existing stock to code, while the Section 179 tax deduction sustains private spending on life-safety upgrades. Hybrid smart-tint EI panes are gaining traction as owners pursue both fire and energy targets, raising average selling prices and reinforcing the regional leadership of the fire-resistant glass market.
Europe maintains a mature but innovative profile. Stringent EN 13501 testing, plus the continent’s carbon-pricing regime, steer demand toward low-carbon manufacturing. Saint-Gobain’s hybrid furnace trial that cuts 75% of CO2 emissions exemplifies this alignment and could become a de-facto procurement criterion for EU public projects saint-gobain.com. Niche growth appears in timber-glass composite facades in Scandinavia, which blend fire resistance with renewable materials. European buyers are also early adopters of EI-class plug-and-play curtain wall cassettes, illustrating a preference for complete assemblies versus single panes.
Asia-Pacific is the clear growth engine, expanding at 9.55% CAGR through 2031. China’s national standard, in force since mid-2023, mandates fire-rated glazing for high-rise egress corridors and lift lobbies. India’s National Building Code amendments are following suit, while Indonesia plans to update its 2012 code by 2026. Meanwhile, Dubai and the wider Gulf have raised standard levels after the 2015 Address incident, fuelling demand for EI-120 systems despite hot-climate design challenges. AGC forecasts shipments of high heat-insulating glass to remain resilient in Asia even as overall construction moderates. These developments collectively pull global suppliers toward regional joint ventures and local fabrication, widening the geographic footprint of the fire-resistant glass market.
Regulatory Landscape
Fire-resistant glazing demand is tightly shaped by building-code and glazing-safety regimes that require tested, labeled assemblies rather than commodity glass. In the United States, 16 CFR Part 1201 continues to set mandatory safety requirements for architectural glazing materials, and the 2024 International Building Code language referenced in the report tightens requirements around lab-tested glazing assemblies for rated openings. In California, enforcement activity involving the California Building Standards Commission and the State Fire Marshal during the 2025 cycle reinforces an approval pathway that favors certified products and documented installation quality.
In Europe, fire-safety guidance updates keep external wall performance and evacuation strategy in focus for taller buildings. In the United Kingdom, Approved Document B amendments effective 30 September 2026 introduce additional requirements tied to evacuation lifts for buildings over 18 m and update guidance affecting external wall systems, which raises the compliance bar for facade glazing packages. The Building Safety Regulator ran a public consultation from 25 March 2026 to 1 July 2026 on further revisions to Approved Document B, including points around combustible-material restrictions and proposed exemptions. That additional scrutiny affects how multi-layer and laminated configurations are evaluated in modern facades.
Value Chain Analysis
The value chain starts with upstream raw materials (high-purity silica sand, soda ash, limestone, and borate inputs for borosilicate formulations) and moves into energy-intensive float-glass manufacturing, where scale and process control shape optical quality and base cost. Downstream value is created through toughening or heat strengthening, lamination, and the integration of intumescent interlayers or aqueous gel layers to deliver EI/EW/E-rated performance, followed by insulated glazing unit assembly, framing and edge-seal systems, and final certification. Large integrated manufacturers such as AGC, Saint-Gobain, and SCHOTT typically anchor float capacity and global distribution, while specialized processors and fabricators convert base glass into tested systems for doors, partitions, and curtain walls.
Route-to-market runs through specification (architects and facade consultants), code compliance and testing (UL/NFPA/ASTM pathways in North America and EN testing in Europe), and then through glazing contractors and certified installers, where workmanship preserves the stated fire rating. Bottlenecks concentrate in two areas: availability of certified installers and fabricators, and supply risk in specialty feedstocks and interlayer chemistries, which can extend project lead times. As codes and insurers push for documented performance, manufacturers have been bundling product, system documentation, and installer training, shifting competition from single panes toward complete, labeled assemblies with service-backed delivery.
Competitive Landscape
Competitive intensity is moderate. AGC Inc., Saint-Gobain, and SCHOTT AG command global networks of float lines, coating plants, and distribution hubs. AGC’s architectural glass division posted JPY 329.7 billion net sales in Q3 2024, though profitability slipped in Europe and the Americas because of slower office construction. The firm is pivoting toward Asia-Pacific and specialty EI-class products to restore margins. Saint-Gobain’s 75% CO2-cutting pilot furnace underpins a corporate pledge to become carbon-neutral by 2050, a differentiator in public procurement. SCHOTT continues to invest in borosilicate expertise, promoting PYRANOVA lines that merge acoustic, thermal, and fire performance.
Second-tier players such as Vetrotech Saint-Gobain, Promat, and Pyroguard hold strong regional niches, often specialising in EI-60 and EW-30 ratings tailored to mass-market residential retrofits. Partnerships with facade contractors help them secure early design wins. Start-ups in Europe are testing digital manufacturing for curved EI-glass, while Japanese fabricators experiment with transparent ceramics doped for near-infrared rejection. Overall strategy focuses on integrated performance packages—fire, energy, acoustic, and security—moving the fire-resistant glass market further into premium territory.
Fire-Resistant Glass Industry Leaders
-
Schott AG
-
Saint-Gobain
-
AGC Inc.
-
Nippon Sheet Glass Co. Ltd
-
Pyroguard
- *Disclaimer: Major Players sorted in no particular order
Market Opportunities and Future Outlook
Near-term opportunity centers on code-driven specification upgrades and documentation-heavy procurement that favor higher-performing assemblies, particularly where authorities require lab-tested glazing systems for rated openings. The 2024 International Building Code strengthening around rated glazing assemblies, together with China GB 55037-2022 for high-rise applications cited in the report context, is pushing projects toward certified EI solutions rather than integrity-only substitutions. This creates whitespace for suppliers that can provide complete systems (glass plus framing, labeling, and installation guidance) and for fabricators that can scale certified processing capacity in markets where installer and fabricator shortages limit throughput.
A second opportunity comes from the convergence of fire performance with sustainability and multi-function glazing, since procurement increasingly asks for environmental documentation alongside life-safety compliance. AGC Pyrobel publishing 16 verified Environmental Product Declarations for standard and low-carbon fire-resistant glass on the INIES platform shows how EPD-backed offerings are being productized for specification, particularly in regions and projects that screen materials. Hybrid smart-tint and fire-resistant glazing, exemplified in the report by SCHOTT PYRANOVA Smart, also supports higher-margin niches by pairing EI ratings with energy and comfort performance, which aligns with retrofits and premium commercial facades where a single unit can satisfy multiple design constraints.
Recent Industry Developments
- June 2026: Saint-Gobain announced the acquisition of a glass fiber plant in North America, adding manufacturing footprint and reinforcing regional supply chain control. While not a fire-rated glazing asset by itself, the move strengthens materials availability and industrial capacity that supports the broader building-envelope value chain where fire-rated systems are specified.
- April 2026: AGC published 16 verified Environmental Product Declarations for standard and low-carbon Pyrobel fire-resistant glass on the INIES platform. EPD availability supports specification in projects that screen embodied carbon and provides a documentation advantage when competing for institutional and regulated builds.
- May 2024: AGC Glass Europe launched its Low-Carbon Glass range, including Low-Carbon Pyrobel fire-resistant glass, as part of its Carbon Neutrality Roadmap. This expanded the addressable segment for fire-rated glazing in sustainability-led procurement and gave architects a lower-embodied-carbon option within certified fire-resistant lines.
Research Methodology Framework and Report Scope
Market Definition and Coverage
The fire resistant glass market, for this study, covers glass products sold for glazing where the specified use case is certified fire performance, such as limiting flame and smoke passage for a rated duration, and in some cases reducing radiant heat transfer.
Scope exclusions: We exclude regular architectural flat glass that is not fire-rated, plus non-glass items like door hardware and standalone framing sold without the glass panel.
Segmentation Overview
- By Fire-Resistance Class
- E (Integrity)
- EW (Integrity and Radiation)
- EI (Integrity and Insulation)
- By Product Type
- Wired
- Laminated
- Ceramic
- Tempered
- Gel-filled
- Polycarbonate and Others
- By End-User Industry
- Building and Construction
- Marine
- Transportation (Rail, Aviation)
- Energy and Utilities
- Other End-User Industries
- By Geography
- Asia-Pacific
- China
- India
- Japan
- South Korea
- South-East Asia
- Rest of Asia-Pacific
- North America
- United States
- Canada
- Mexico
- Europe
- Germany
- United Kingdom
- France
- Italy
- Rest of Europe
- South America
- Brazil
- Argentina
- Rest of South America
- Middle East and Africa
- Saudi Arabia
- South Africa
- Rest of Middle East and Africa
- Asia-Pacific
Data Sources, Market Sizing, and Validation
Desk Research
Desk work started by setting a clean scope and then gathering public signals that explain where demand and pricing tend to move. Common sources included official building and construction statistics (such as national statistics offices), building code and fire standard references (such as ICC documentation and NFPA publications), trade data for glass products (such as UN Comtrade and customs releases), and construction cost indices (such as government price statistics).
We also reviewed company annual reports, investor presentations, and product catalogs to understand how fire ratings are positioned, and how product mixes differ by region. Patent databases were used to spot where key glazing technologies and interlayer improvements were being filed, which helped when setting reasonable assumptions on product upgrades. For trade and supply signals, an import and export shipment-level database was used selectively to cross-check directional movements in cross-border glass flows. These examples are not exhaustive, and other public documents and datasets were also used to collect, validate, and clarify the final inputs.
Primary Interviews and Surveys
Primary work focused on interviews and structured questionnaires with manufacturers, fabricators, distributors, glazing contractors, specifiers, and fire-safety consultants, since these roles see different parts of pricing and demand. Because the market is global, discussions were spread across APAC, EMEA, and the Americas to confirm how local fire codes, typical rating durations, and project cycles change the consumption pattern, then to reconcile gaps left by public data.
Distribution of primary research fieldwork respondents
| Company type | Respondent position | Region |
|---|---|---|
| Top tier: 34% | CXOs: 12% | APAC: 37% |
| Mid tier: 52% | Functional/Unit leaders: 35% | EMEA: 37% |
| Smaller Players: 14% | Managers: 53% | Americas: 26% |
Market-Sizing & Forecasting
Sizing used a top-down build that reconstructs demand from the construction activity pool and the adoption of fire-rated glazing in relevant buildings, and then converts it into value using typical project-level pricing. To keep the totals realistic, results were corroborated with selective bottom-up approximations, such as sampled selling price by volume checks from fabricators and channel discussions, followed by adjustments where a clear mismatch appeared.
Key inputs included new commercial floor space and high-rise project starts, the share of projects that must meet fire code glazing requirements, typical rating durations used in doors, partitions, and facades, refurbishment and retrofit intensity in older buildings, and regional price differences driven by certified product mix and testing costs. When data was thin for smaller countries, we used proxy indicators like construction permits and import patterns to avoid forcing a full supplier roll-up.
For forecasting, scenario analysis was used so the model could reflect different paths for building activity, fire code enforcement, and certified product penetration, which were then sanity-checked through expert consensus from primary interviews. Pricing was carried forward using a practical view of input cost direction and product-mix upgrading, rather than assuming a straight-line jump across all regions.
Data Validation & Update Cycle
Outputs were checked against independent signals, including construction spending direction, trade movement for relevant glass categories, and the way certified product mix is shifting in specifications. Variance checks were performed at region level first, and then at the global roll-up level, so outliers could be isolated before they distort the final total. When a variance could not be explained by a visible driver, the related assumptions were revisited, and where needed, the interview loop was reopened with the most relevant respondent type.
Before sign-off, the model and assumptions go through a multi-step analyst review so that unit logic, currency conversions, and year alignment stay consistent. The report is refreshed annually, and interim updates are made when material events occur, such as meaningful code changes or sharp input cost swings. Right before delivery, we run a final pass to ensure the latest public releases and market signals are reflected.
Mordor Intelligence's Fire Resistant Glass Market Size Compared With Other Published Estimates
Published market sizes for fire resistant glass often do not line up because different studies choose different product boundaries, pricing rules, and time frames for currency and inflation. Differences can also come from how strictly certification is treated, since some sources mix fire-rated glass with adjacent safety glazing categories.
The main gap comes from whether complete, certified fire-rated glazing is counted as the market, where Mordor Intelligence treats value as the glass sold for fire-rated applications aligned to rating classes like integrity and insulation, instead of folding in broader architectural flat glass used in similar building areas. Another driver is the pricing method, since some figures lean on a single average price assumption across geographies, while others reflect region-level mix (for example, higher shares of higher-rated solutions in certain commercial projects). Refresh cadence matters too, because construction cycles and code enforcement can change quickly, which makes older base-year assumptions drift.
Benchmark comparison
| Source | Market Size | Gaps in Research Methodology |
|---|---|---|
| Mordor Intelligence | USD 9.67 B (2025) | |
| Industry Research Publisher A | USD 5.20 B (2025) | Uses a narrower revenue capture that can undercount higher-rated glazing by treating certified assemblies and specification-driven upgrades as out of scope, which reduces the implied average selling price and total value. |
| Market Analytics Publisher B | USD 6.99 B (2025) | Likely applies broader category averages and a different mix assumption across regions, which can compress values where higher certification levels and project-specific pricing are more common. |
The table shows that the spread is mostly explained by scope and pricing treatment, not by disagreement that the market is growing. When certification-linked demand indicators, region-level mix, and practical price progression rules are kept explicit, the final number becomes easier to trace back to real project activity and repeatable assumptions.
Key Questions Answered in the Report
What is the current Fire-Resistant Glass Market size?
The Fire-Resistant Glass Market is valued at USD 10.56 billion in 2026 and is projected to grow steadily through 2031.
Which region leads global demand?
North America holds 31.60% revenue share because of strict code enforcement and retrofit incentives.
Which product segment is growing fastest?
Gel-filled panes are forecast to expand at a 9.92% CAGR between 2026 and 2031.
Why is EI-class glass gaining traction?
EI panes provide both integrity and insulation, aligning with new code requirements for safe evacuation routes in high-rise structures.