
Fire Fighting Aircraft Market Size and Share
Market Overview
| Study Period | 2019 - 2031 |
|---|---|
| Market Size (2026) | USD 8.32 Billion |
| Market Size (2031) | USD 11.63 Billion |
| Growth Rate (2026 - 2031) | 6.92 % |
| Fastest Growing Market | Asia Pacific |
| Largest Market | North America |
| Market Concentration | High |
Major Players *Disclaimer: Major Players sorted in no particular order Image © Mordor Intelligence. Reuse requires attribution under CC BY 4.0. | |
Fire Fighting Aircraft Market Analysis by Mordor Intelligence
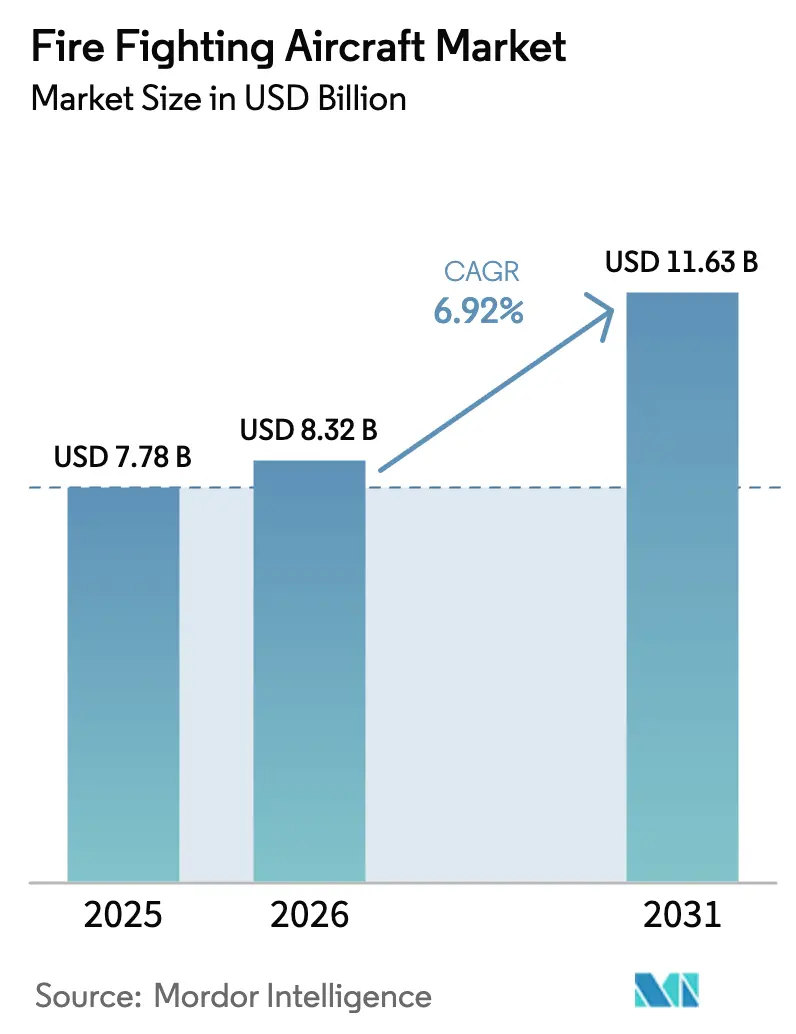
The fire fighting aircraft market size is expected to grow from USD 7.78 billion in 2025 to USD 8.32 billion in 2026 and is forecast to reach USD 11.63 billion by 2031 at a 6.92% CAGR over 2026-2031. Growth stems from climate-driven wildfire escalation, rising government aerial-fire budgets, and the cost advantage of converting retired passenger jets into tankers. Accelerated procurement cycles in North America and Europe, coupled with sovereign fleet expansions in the Asia-Pacific region, are reshaping competitive dynamics. Conversion houses are narrowing acquisition costs compared to new-build platforms, while precision-drop avionics are enhancing effectiveness and driving the replacement of 1980s-era aircraft. Workforce shortages and tariff-induced avionics delays temper near-term capacity additions, yet expanding utility-liability exposure is unlocking a new private-contractor demand channel. Manufacturers that bundle lifecycle support and autonomy, as well as developers offering crew-risk mitigation, are best positioned to capture emerging opportunities as cross-border leasing frameworks shorten deployment timelines.
Key Report Takeaways
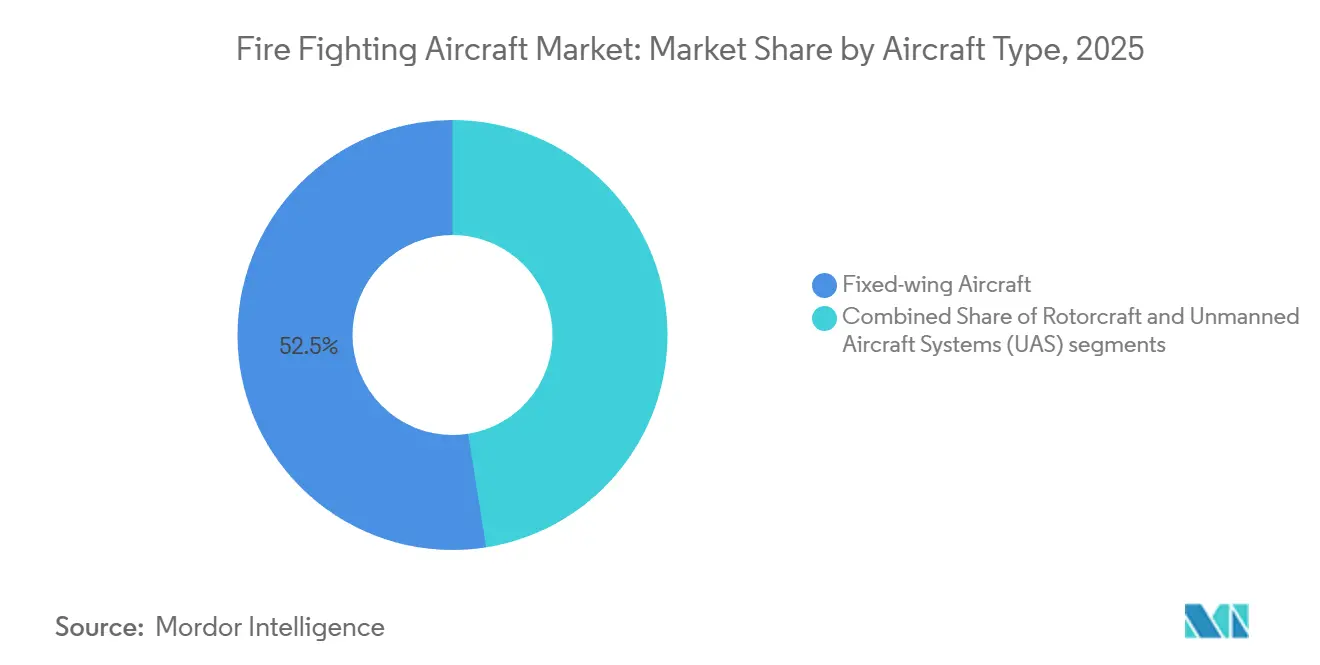
- By aircraft type, fixed-wing platforms commanded 52.50% of the fire fighting aircraft market share in 2025; unmanned aircraft systems are forecast to expand at an 8.87% CAGR through 2031.
- By tank capacity, the less than 10,000 liter class accounted for 47.80% of the fire fighting aircraft market size in 2025, whereas platforms exceeding 30,000 liters are projected to advance at a 7.74% CAGR through 2031.
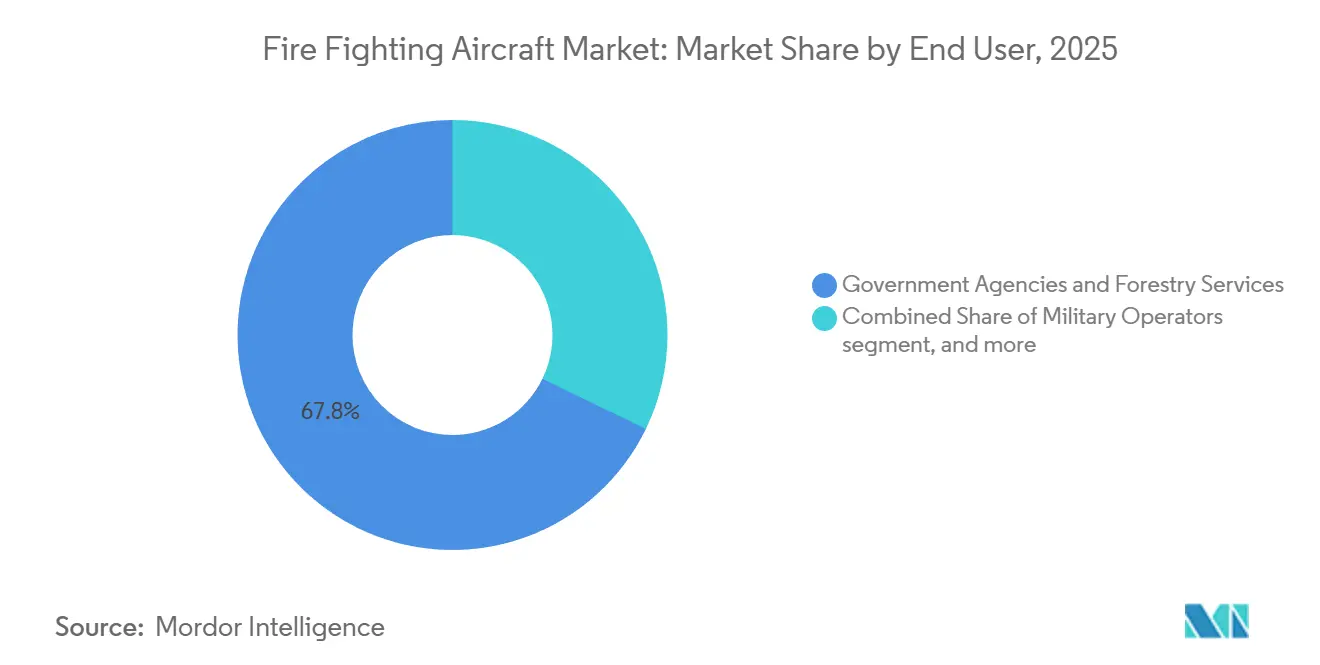
- By end user, government agencies held 67.80% of the fire fighting aircraft market share in 2025, while private contractors are projected to grow at a 7.65% CAGR through 2031.
- By operational range, the 1,000 to 3,000 kilometer class captured 55.45% of the fire fighting aircraft market size in 2025; platforms exceeding 3,000 kilometers are forecast to grow at an 8.20% CAGR through 2031.
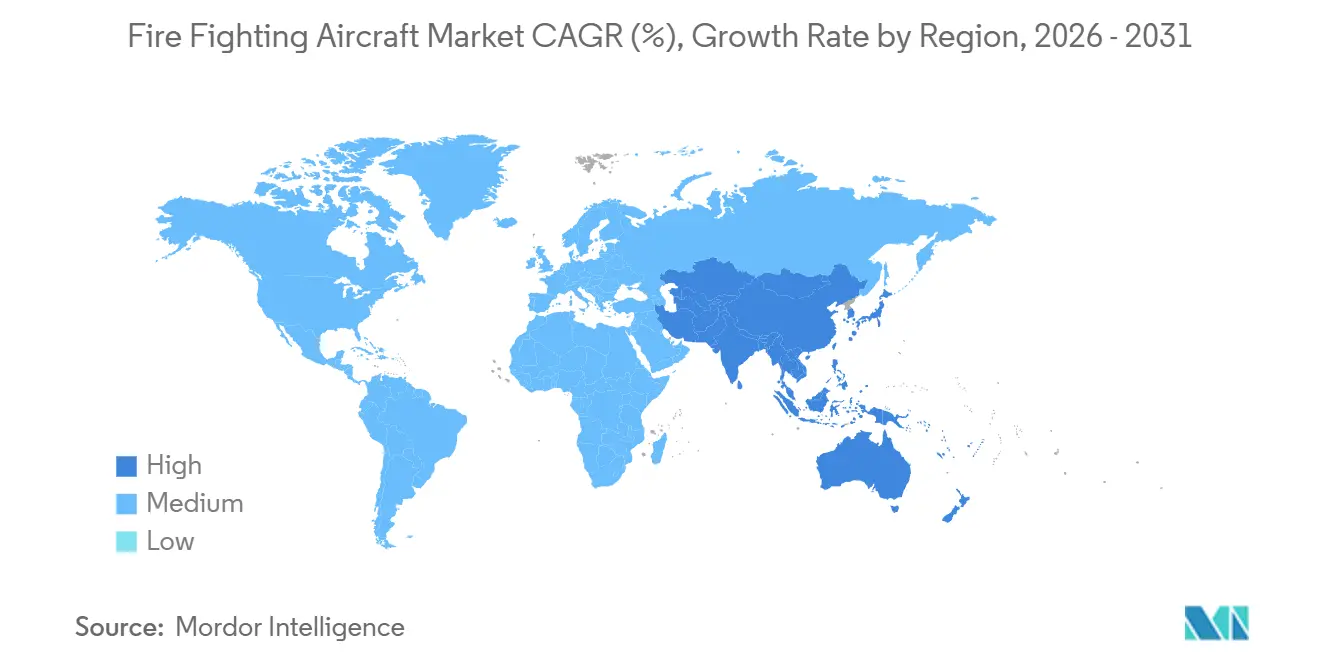
- By geography, North America led with a 47.10% revenue share in 2025; the Asia-Pacific region is projected to grow at a 7.45% CAGR through 2031.
Note: Market size and forecast figures in this report are generated using Mordor Intelligence’s proprietary estimation framework, updated with the latest available data and insights as of January 2026.
Market Trends and Insights
Drivers Impact Analysis of Fire Fighting Aircraft Market*
| Driver | (~) % Impact on CAGR Forecast | Geographic Relevance | Impact Timeline |
|---|---|---|---|
| Escalating frequency and intensity of wildfires | +1.2% | North America, Mediterranean Europe, Australia | Medium term (2–4 years) |
| Expanding government aerial-fire budgets and long-term contracts | +1.0% | North America, Europe, Asia-Pacific | Short term (≤ 2 years) |
| Next-gen airframes and precision-drop technologies | +0.8% | Global, early China adoption | Medium term (2-4 years) |
| Retired narrowbody feedstock enabling low-cost tanker conversions | +0.6% | North America, Australia, South America | Short term (≤ 2 years) |
| Utility-liability risk fuelling private-sector aircraft demand | +0.5% | North America, Mediterranean Europe | Short term (≤ 2 years) |
| ICAO I4F initiative easing cross-border aircraft leasing | +0.3% | Global | Long term (≥ 4 years) |
| Source: Mordor Intelligence | |||
Escalating Frequency And Intensity Of Wildfires
Wildfire activity continues to challenge historical norms, transforming what was once a three-month issue into a threat that lingers throughout every season. Agencies now hold aircraft on alert all year because 2024 saw 7.5 million acres burn in the US and 18 million hectares in Canada, the worst totals ever logged. [1] Climate research links the surge to a 25% increase in fire-weather days since 2000, resulting in longer contracts and higher fixed costs.[2] Greece’s 175,000-hectare loss stretched tanker leases into October, and Australia adopted permanent basing, moves that lengthen utilization windows and improve return on large-platform investments.
Expanding Government Aerial-Fire Budgets And Long-Term Contracts
Public spending is climbing at every tier. Washington raised its fiscal-2025 aerial-fire allocation to USD 534 million, 12% above the 2024 level, while California surpassed USD 400 million to finance 12 helicopters and two large tankers. North of the border, Ottawa pledged CAD 257.6 million (USD 185.06 million) over five years for amphibious aircraft that can scoop remote lakes. Brussels’ rescEU program injected EUR 600 million (USD 648.40 million) to pre-position 24 platforms across the bloc, reducing costly spot leases. Spain’s 15-year DHC-515 package, bundling training and maintenance, signals a pivot toward lifecycle contracting that stabilizes OEM revenue.
Next-Generation Airframes And Precision-Drop Technologies
Technology upgrades are cutting chemical waste and widening mission profiles. Elbit’s HyDrop system, FAA-certified in 2024, narrows the dispersion of retardant to 10 meters, tripling the accuracy compared to gravity drops. The USDA’s third-generation FRDS senses wind shear in real time, trimming per-acre retardant use by 18% on C-130H trials. Autonomous craft enhance safety; EHang’s EH216-F flew 6,000 test sorties before receiving Chinese certification in 2025, enabling crew-free suppression within smoke-filled urban canyons. Agencies replacing 1980s airframes gain plug-and-play avionics, unlocking higher-margin infrastructure-protection contracts that reward precision and low collateral impact.
Retired Narrow-Body Feedstock Enabling Low-Cost Tanker Conversions
Fleet rationalization followed the pandemic, which flooded the market with A320s and B737s, thereby slashing acquisition costs for conversion houses. Neptune’s A319 program offers 4,500-gallon payloads at USD 12 million, roughly half the price of a new DHC-515, and secures three US state buyers for 2026 delivery. Coulson spent USD 48 million turning four B737-700s into 5,000-gallon tankers for Australia-Chile rotation, validating jet-speed economics. More than 200 surplus military C-130s worldwide sustain retrofit pricing of around USD 10–15 million, allowing operators to quickly field capacity while OEM lead times stretch to three years.
Restraints Impact Analysis of Fire Fighting Aircraft Market*
| Restraint | (~) % Impact on CAGR Forecast | Geographic Relevance | Impact Timeline |
|---|---|---|---|
| High acquisition and lifecycle costs | -0.7% | Global, emerging markets hardest hit | Medium term (2-4 years) |
| Shortage of experienced aerial-fire pilots and mechanics | -0.5% | North America, Australia, Mediterranean Europe | Short term (≤ 2 years) |
| Tariff-driven avionics/airframe supply-chain disruptions | -0.4% | North America, Europe | Short term (≤ 2 years) |
| Weather-smoke grounding limits annual utilization | -0.3% | Global | Long term (≥ 4 years) |
| Source: Mordor Intelligence | |||
High Acquisition And Lifecycle Costs
Capital intensity remains the primary brake on expansion, especially in middle-income regions. A new DHC-515 lists at USD 37 million, while a converted B747 large air tanker, including structural work and delivery system, nears USD 50 million. Operational bills pile on: fuel, spares, and heavy checks burn USD 8,000-12,000 every flight hour, yet aircraft sit idle up to eight months, inflating the cost per gallon against ground crews. Brazil’s federal budget only covered USD 24 million in 2025 leases, underscoring how emerging markets struggle to finance fixed-wing fleets despite worsening fire risk.
Shortage Of Experienced Aerial-Fire Pilots And Mechanics
Workforce gaps are widening as airlines rebalance rosters and older captains retire. The FAA foresees a 12,000-pilot national shortfall by 2032, with seasonal aerial fire fighting hardest hit because it demands low-altitude, high-G maneuvering skills, which offer intermittent pay.[3] The National Association of State Foresters puts average tanker-pilot age at 47, and retirements now outpace new entrants two-to-one. Mechanics lag too; Australia’s NAFC reported 15% vacancies in 2025, grounding some contracted aircraft during peak demand. Training costs, exceeding USD 100,000, deter recruits who are absent multi-year employment guarantees.
*Our forecasts treat driver/restraint impacts as directional, not additive. The impact forecasts reflect baseline growth, mix effects, and variable interactions.
Fire Fighting Aircraft Market Segment Analysis
By Aircraft Type:
Fixed-Wing Platforms Dominate Volume, UAS Segment AcceleratesFixed-wing aircraft held a 52.50% market share in the fire fighting aircraft market in 2025, reflecting superior payload economics for large-area suppression. The segment’s longevity is reinforced by the C-130 and S-2T fleets, which performed the majority of US drops in 2025. Unmanned systems, though nascent, are expanding at an 8.87% CAGR as Chinese certification of the EH216-F and FAA sandbox trials in the US validate autonomous operations. Rotorcraft excel in precision structure defense and vertical reference missions, and AW139 deliveries to Italy and Los Angeles advance urban interface capability.
Fleet modernization favors conversion programs that extend service life and integrate precision-drop avionics. Fixed-wing operators capitalize on retired jets that combine jet speed with moderate operating costs, keeping the fire fighting aircraft market competitive. UAS deployments, backed by lower crew risk, are widening mission envelopes into smoke-obscured canyons where manned flight is untenable. Rotorcraft growth is tied to year-round vegetation-management contracts from utilities that demand immediate dispatch capability.
By Tank Capacity:
Mid-Range Still Leads, VLAT Growth OutpacesAircraft under 10,000 liters represented 47.80% of the fire fighting aircraft market size in 2025, led by Air Tractor AT-802F fleets across North America and Australia. The 10,000-30,000 liter class, anchored by CL-415s and DHC-515s, strikes a balance between payload and lake-scooping agility; however, backlog constraints slow its growth. Huge air tankers with capacities above 30,000 liters are expanding at a 7.74% CAGR, as single-pass coverage of 3-kilometer firelines enhances cost efficiency during mega-fires.
Mid-capacity assets remain indispensable for rapid turnaround from proximal water bodies; yet, agencies are procuring VLATs to reduce crew flight hours and sortie counts. The scarcity of suitable B747 and DC-10 airframes caps the absolute number of VLATs, maintaining pricing power for operators. Lightweight categories thrive in emerging markets where runway infrastructure or budgets limit the adoption of heavy aircraft.
By End User:
Private Contractors Gain Share Amid Liability ShiftsGovernment agencies accounted for 67.80% of the fire fighting aircraft market share in 2025; nonetheless, private operators are poised for a 7.65% CAGR as utilities and insurers secure dedicated fleets. Military support provides surge capacity but faces trade-offs in training readiness that limit annual flight allocations.
Private demand is price-inelastic, treating aircraft costs as insurance premiums. Erickson now derives over 60% of S-64 flying hours from private contracts, up from 30% in 2020. Government agencies, while still dominant, increasingly outsource initial-attack missions to contractors that guarantee scramble times, freeing public fleets for strategic perimeter drops.
By Operational Range:
Ultra-Long-Range Platforms Unlock Hemispheric UtilizationAircraft with a 1,000–3,000-kilometer range captured 55.45% of the fire fighting aircraft market share in 2025, striking a balance between fuel burn and repositioning reach. Platforms exceeding 3,000 kilometers are growing at an 8.20% CAGR as cross-border mutual-aid frameworks make hemispheric fleet rotation viable. Coulson’s C-130s flew from Canada to Australia and then to Chile within 12 months, doubling utilization and spreading fixed costs.
Short-range helicopters and light aircraft remain critical for rapid local response, while mid-range turboprops cover contiguous state missions. Ultra-long-range jets address strategic pre-positioning needs, enabling a single base to protect multiple jurisdictions and maximize aircraft asset utilization.
Geography Analysis
North America Fire Fighting Aircraft Market
North America retained a 47.10% revenue share in 2025, as federal and state budgets surpassed USD 900 million; however, pilot shortages and airframe saturation moderated the regional CAGR. The US operated 23 large tankers, 8 VLATs, and more than 100 helicopters in 2025. Canada’s CAD 257.6 million (USD 185.06 million) investment focuses on amphibious platforms, while Mexico modestly expands helicopter leases. Utilization rates below 250 hours per season constrain new capital deployment, leading to a shift in procurement toward service contracts that prioritize availability over ownership.
APAC Fire Fighting Aircraft Market
The Asia-Pacific region is the fastest-growing region, with a 7.45% CAGR through 2031. Australia’s AUD 352.9 million (USD 236.37 million) plan builds sovereign capacity to cut reliance on leased North American assets. China has fielded the AG600 amphibious aircraft and has surpassed 50 fire fighting helicopters, with a concentration in Xinjiang and Heilongjiang. Japan, Indonesia, and Thailand expand helicopter fleets for mountainous and peatland fires, albeit from small bases.
EMEA Fire Fighting Aircraft Market
Europe’s rescEU fleet fragments North American export dominance. Spain operates 73 aircraft and ordered six DHC-515s in 2025. France’s Sécurité Civile flies 23 amphibious aircraft and added three DHC-515s. Greece modernized its post-2024 fires with four new CL-415s. Russia’s Avialesookhrana maintains over 60 aircraft but faces hurdles in modernization. The Middle East and Africa markets are emerging slowly, with Saudi Arabia investing in helicopter capacity to protect its energy infrastructure.
Regulatory Landscape
In the United States, aerial firefighting operations are governed through an interagency framework that draws on Federal Aviation Regulations (FARs) and annual operational standards. In February 2026, the National Wildfire Coordinating Group (NWCG) published PMS 514, Standards for Airtanker Operations, and in May 2026 the National Interagency Fire Center (NIFC) released the 2026 Interagency Standards for Fire and Fire Aviation Operations (the Red Book), which reinforces standardized dispatch, utilization, and coordination requirements for airtankers across agencies.
In Europe, airworthiness and certification pathways for manned firefighting aircraft and rotorcraft are anchored by EASA certification specifications, including CS-26 (additional airworthiness specifications for operations) and CS-29 (large rotorcraft). At the international level, ICAO continues work on the need for more standardized certification and operational requirements for specialized aerial firefighting aircraft, with the remaining friction largely tied to jurisdiction-by-jurisdiction approvals that complicate cross-border deployment and leasing.
Value Chain Analysis
The value chain runs from aircraft OEMs and conversion houses to mission-system integrators, including tanks, doors, drop-control units, and avionics. It then extends to a specialized Tier-2 supplier base for flight-critical components, followed by MRO networks and operators that deliver capacity to government agencies and private contractors via seasonal or multi-year contracts. Purpose-built amphibious programs (for example, De Havilland Canadair 515/DHC-515) create dedicated supply needs for flight control surfaces, cockpit assemblies, and drop-control systems, while jet-tanker conversions depend on airframe feedstock availability plus engineering and certification work packages.
Recent supply-side activity points to more internationalization across the chain, including suppliers supporting DHC-515 subsystems and new partnering around next-generation scooping aircraft concepts and large-jet tanker initiatives. On the rotorcraft side, production localization and integration partnerships also shape delivery capacity; in July 2026, Lockheed Martin said production start for Sikorsky S-70 FIREHAWK helicopters at PZL Mielec in Poland for the Czech Republic, coordinated with partners for mission configuration. This highlights how OEMs, completion centers, and in-country support providers jointly deliver mission-ready firefighting assets.
Competitive Landscape
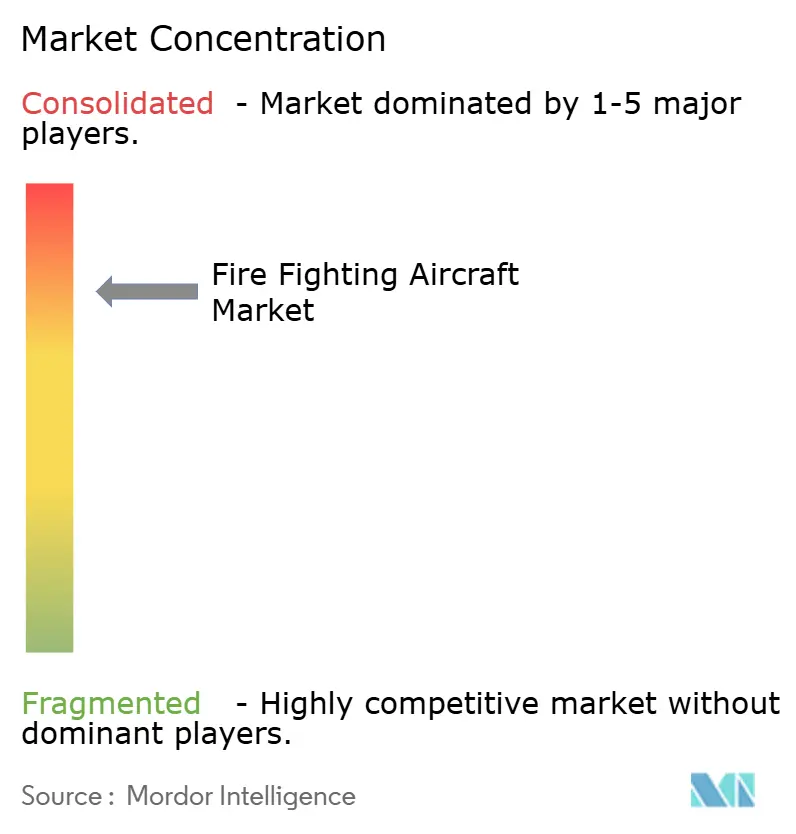
The fire fighting aircraft market is highly consolidated, with a few key players holding significant market shares. Lockheed Martin’s C-130J dominates large-tanker military-civil procurements, winning Romania’s USD 280 million order for five aircraft in 2025. De Havilland’s DHC-515 is the sole new-production amphibious aircraft, but it faces a three-year backlog. Leonardo and Airbus lead rotorcraft, while Erickson’s S-64 controls heavy-lift missions.
Conversion specialists disrupt pricing. Neptune’s A319 and Coulson’s 737 programs exploit abundant jet feedstock to undercut new builds by 50%. Precision-drop avionics from Elbit and USDA FRDS Gen III become mandatory specs, pushing legacy fleets toward retrofits. Autonomous entrants, such as EHang, target urban interface roles, and Rain develops AI drop algorithms that reduce chemical usage.
Regulatory streamlining accelerates VLAT approvals, reducing certification time from 36 to 24 months in 2025, thereby lowering entry barriers. Suppliers that combine airframe, training, and maintenance in turnkey packages gain an edge as agencies favor lifecycle contracting.
Fire Fighting Aircraft Industry Leaders
-
Airbus SE
-
Lockheed Martin Corporation
-
Leonardo S.p.A.
-
Textron Inc.
-
Air Tractor, Inc.
- *Disclaimer: Major Players sorted in no particular order
Fire Fighting Aircraft Market Companies Covered in this Report
- Lockheed Martin Corporation
- De Havilland Aircraft of Canada Limited
- ShinMaywa Industries, Ltd.
- MD Helicopters Inc.
- Textron Inc.
- Airbus SE
- Leonardo S.p.A.
- HYNAERO SAS
- Air Tractor, Inc.
- Saab AB
- Erickson Incorporated
- Thrush Aircraft
- Guangzhou EHang Intelligent Technology Co. Ltd.
- Russian Helicopters’ JSC
- United Aircraft Corporation
Market Opportunities and Future Outlook
Fleet renewal and rapid-capacity additions are opening room for conversion-led platforms and modular firefighting kits that can reduce time-to-field compared with clean-sheet builds. In June 2026, Neptune Aviation took delivery of its first Airbus A319 airframe for modification in Alabama, supporting continued momentum behind narrowbody conversions as a cost and availability lever for fixed-wing airtanker capacity. Procurement pathways are also being shaped by demand aggregation mechanisms: the Canadian Commercial Corporation and De Havilland Canada signed government-to-government contracts (announced May 2024) with six European countries for 22 Canadair 515 aircraft, aligning with an EU-wide push to build interoperable capacity pools.
Operational basing and sovereign fleet build-outs are expanding service and sustainment opportunities in parallel with aircraft sales. In June 2026, California announced that CAL FIRE deployed its fourth C-130H airtanker and opened a new helitack base at Ramona Airport, reinforcing the need for maintenance, spares, and crew training support to sustain higher readiness levels. In Europe, peak-season capability is being tested through additional lift options: Airbus tested a removable A400M firefighting kit (reported December 2024), and France and Spain initiated A400M operational suppression trials in 2026. Those efforts create opportunities for kit suppliers, certification support, and mission-system integration beyond traditional purpose-built waterbombers.
Recent Industry Developments in Fire Fighting Aircraft Market
- July 2026: Lockheed Martin said production of the first two Sikorsky S-70 FIREHAWK helicopters for the Czech Republic Ministry of the Interior began at PZL Mielec in Poland. The program involves integration partners for mission configuration and is tied to expanding European aerial firefighting capacity, including contributions aligned with the rescEU pool. Localized production and standardized configurations support faster delivery cycles and in-region sustainment.
- June 2026: Thrush Aircraft secured a U.S. Foreign Military Sales (FMS) contract to supply three fixed-wing firefighting aircraft to the Guatemalan Air Force. The award underscores continued use of government-to-government channels for aerial firefighting procurement and expands fleet modernization options for countries building dedicated initial-attack capacity. It also reinforces OEM demand for training, spares, and support packages beyond the airframes.
- September 2025: Air Tractor Europe finalized a EUR 25.64 million contract with the Republic of Cyprus covering three new firefighting aircraft along with wet leasing services. Combining aircraft acquisition with operational provision helps governments add seasonal capacity without immediately scaling their own pilot and maintenance workforces. The structure also strengthens recurring service revenue models alongside equipment sales.
Fire Fighting Aircraft Market Report Scope and Research Methodology
Market Definition and Coverage
This market covers aircraft and aerial platforms used for firefighting missions, where the aircraft is equipped and operated to deliver water or fire retardant, and to support wildfire response through aerial operations.
Scope exclusions: Ground firefighting equipment, fire station infrastructure, and non-aviation services are excluded unless they are bundled as part of an aircraft-related contract.
Segments Covered in This Report
- By Aircraft Type
- Fixed-wing Aircraft
- Rotorcraft
- Unmanned Aircraft Systems (UAS)
- By Tank Capacity
- Less than 10,000 liters
- 10,000 - 30,000 liters
- More than 30,000 liters
- By End User
- Government Agencies and Forestry Services
- Military Operators
- Private Contractors and Aerial Firefighting Firms
- By Operational Range
- Less than 1,000 km
- 1,000 to 3,000 km
- More than 3,000 km
- By Geography
- North America
- United States
- Canada
- Mexico
- Europe
- Germany
- France
- Spain
- Greece
- Russia
- Rest of Europe
- Asia-Pacific
- China
- Japan
- Australia
- Rest of Asia Pacific
- South America
- Brazil
- Rest of South America
- Middle East and Africa
- Middle East
- Saudi Arabia
- Rest of Middle East
- Africa
- South Africa
- Rest of Africa
- Middle East
- North America
Data Sources, Market Sizing, and Validation
Desk Research
Desk work starts by mapping the demand triggers and fleet activity behind aerial firefighting, then turning them into inputs for the model. For this, we lean on public sources such as national wildfire and forestry agencies, civil aviation regulators, and government procurement portals that publish tender awards and program notes.
To keep assumptions realistic, we also review aircraft certification and safety material from aviation authorities, wildfire incident statistics released by government bodies, and trade and customs summaries where relevant for cross-border aircraft movements. Company filings, investor presentations, and reputable aviation and emergency-response press are used to cross-check delivery timelines and service contracts. When public company-level financial visibility is limited, we use paid subscriptions covering company financials and intelligence, contracts and tenders, and aircraft and aviation technical databases, applied selectively.
These examples are not exhaustive, and many other public references were used during data collection, validation, and clarification.
Primary Interviews and Surveys
Primary interviews and surveys are used to pressure-test how fleets are actually deployed, how availability changes across fire seasons, and how pricing is structured across ownership, leasing, and service-based models. We spoke with a mix of aircraft operators, aviation maintenance and modification participants, public buyers, and industry experts across major wildfire-prone regions, so assumptions on utilization, tank capacity mix, and mission profiles could be aligned with real operating constraints.
Distribution of primary research fieldwork respondents
| Company type | Respondent position | Region |
|---|---|---|
| Top tier: 30% | CXOs: 14% | APAC: 40% |
| Mid tier: 51% | Functional/Unit leaders: 33% | EMEA: 33% |
| Smaller Players: 19% | Managers: 53% | Americas: 27% |
Market-Sizing & Forecasting
Sizing is built from a top-down demand pool, where wildfire response needs and aerial fleet deployment are reconstructed using government program budgets, fleet counts, and mission intensity indicators, then translated into annual spending. The output is corroborated with selective bottom-up approximations such as sampled aircraft day rates, estimated flight-hour utilization by mission type, and checks on deliveries and conversions to keep totals grounded.
Key inputs used in the model include the active fleet mix across fixed-wing, rotorcraft, and UAS, average tank capacity bands and their typical mission suitability, seasonal utilization and availability, contract-structure split between owned fleets and contracted services, and the pace of procurement tied to wildfire readiness programs. Where direct pricing is not observable, gaps are handled by using ranges validated through interviews, then applying conservative mid-points until additional confirmation is available.
For forecasting, we run scenario analysis around wildfire season severity and government spending cycles, and we sanity-check the resulting paths against known fleet renewal timelines and maintenance downtime patterns. Growth assumptions are also aligned to the expected mix shift toward multi-mission platforms and modernization activity before the final series is locked.
Data Validation & Update Cycle
Model outputs are checked against independent signals such as announced fleet additions, publicly visible contract awards, and changes in wildfire management funding, then compared with implied spending per aircraft to catch outliers. If a variance is seen, assumptions are reworked and, when needed, respondents are re-contacted to confirm directionality on pricing, utilization, or availability.
Before sign-off, the numbers go through a multi-step analyst review where calculations, currency conversions, and year labeling are rechecked for consistency. Reports are refreshed annually, and interim updates are made when material events occur, including major procurement programs, regulation shifts, or unusually severe wildfire seasons. Right before delivery, a fresh review pass is completed so clients receive the latest updated view.
Mordor Intelligence's Fire Fighting Aircraft Market Sizing Compared With Other Published Estimates
Published market values for fire fighting aircraft can differ because each publisher draws the market box in its own way and does not always treat services, conversions, and unmanned platforms consistently. Differences also come from the year chosen as the anchor, the inflation and currency timing used, and whether the estimate is built around procurement cycles or around yearly operational spending.
In practice, the biggest gaps usually come from what is counted as revenue, especially when aircraft acquisition, leasing, and mission support are blended together in some estimates, or when only fixed-wing and rotorcraft are counted and UAS-related spending is left out. For this market, the spread is also influenced by how tank capacity mix and seasonal utilization are converted into annual value, and by how quickly assumptions are refreshed after large wildfire seasons and new public contracts, which is why the total is kept tied to fleet activity and contract visibility, a modeling choice applied by Mordor Intelligence.
Benchmark comparison
| Source | Market Size | Gaps in Research Methodology |
|---|---|---|
| Mordor Intelligence | USD 7.78 B (2025) | |
| Global Consultancy A | USD 7.48 B (2024) | Uses an earlier base year and can lean more heavily on historical revenue splits, which may not fully reflect recent contract repricing and fleet availability constraints after severe fire seasons. |
| Industry Publisher B | USD 7.28 B (2024) | Focuses mainly on aircraft and tank configurations tied to water or retardant dropping, which can undercount adjacent revenue that sits in leasing and mission-readiness support when those are contracted separately. |
The table shows that year selection and scope treatment around UAS, leasing, and contract support can shift the headline number even when the same demand story is being described. By keeping inputs tied to observable fleet activity, contract structures, and seasonality, our estimate stays traceable to clear variables that can be reviewed and repeated when new information comes in.
Key Questions Answered in the Report
How large is the fire fighting aircraft market in 2026?
The fire fighting aircraft market size reached USD 8.32 billion in 2026 and is projected to climb to USD 11.63 billion by 2031.
What is the expected growth rate for fire fighting aircraft through 2031?
The market is forecasted to register a 6.92% CAGR over the 2026–2031 period.
Which aircraft type is expanding the fastest?
Unmanned aircraft systems (UAS) are projected to post an 8.87% CAGR, the highest among all types, driven by new certifications.
Which region is experiencing the quickest growth?
Asia-Pacific leads with a 7.45% CAGR as Australia and China accelerate sovereign fleet build-outs.
Why are private utilities investing in their own fleets?
Liability exposure from wildfire ignition makes aircraft costs function as insurance, prompting utilities to secure dedicated year-round capacity.
What limits rapid fleet expansion despite rising budgets?
Shortages of experienced pilots and mechanics and tariff-driven avionics delays extend delivery timelines and ground ready aircraft.