
Fintech Blockchain Market Size and Share
Market Overview
| Study Period | 2020 - 2031 |
|---|---|
| Market Size (2026) | USD 7.42 Billion |
| Market Size (2031) | USD 11.06 Billion |
| Growth Rate (2026 - 2031) | 8.31% CAGR |
| Fastest Growing Market | Middle East |
| Largest Market | North America |
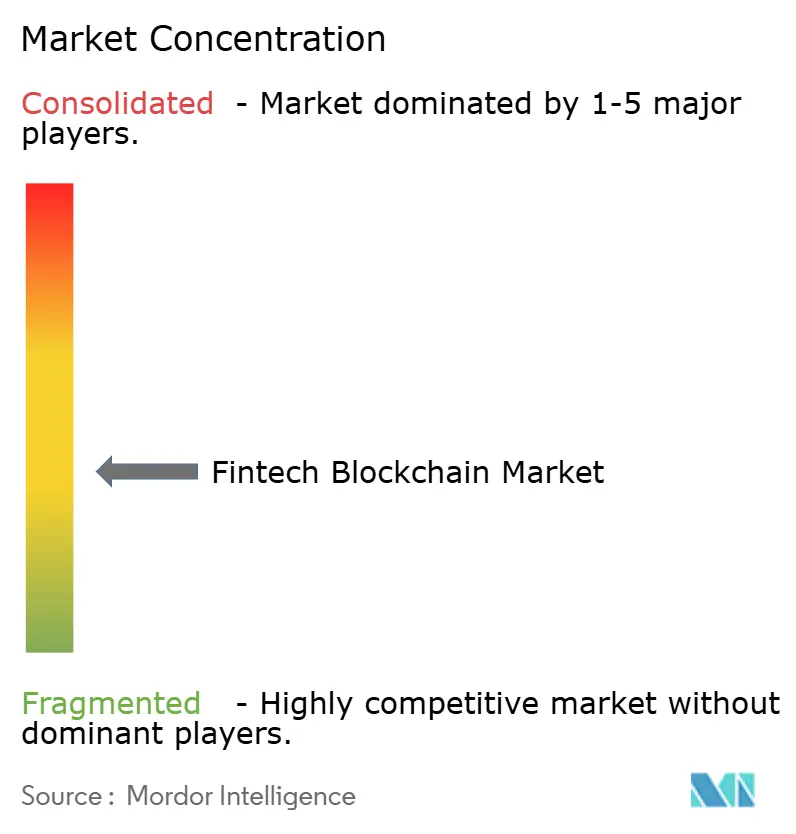
| Market Concentration | Medium |
Major Players *Disclaimer: Major Players sorted in no particular order Image © Mordor Intelligence. Reuse requires attribution under CC BY 4.0. | |
Fintech Blockchain Market Analysis by Mordor Intelligence
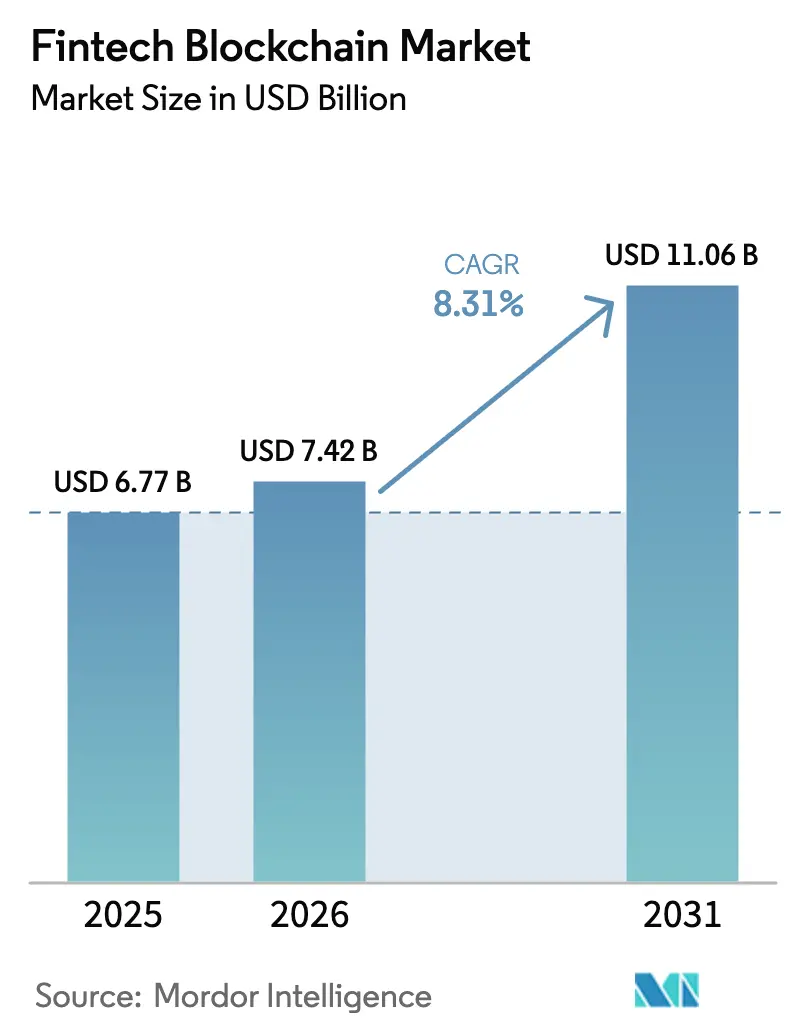
The fintech blockchain market size is expected to increase from USD 6.77 billion in 2025 to USD 7.42 billion in 2026 and reach USD 11.06 billion by 2031, growing at a CAGR of 8.31% over 2026-2031. Rapid movement from limited pilots to production-grade platforms for real-time settlement, tokenized collateral, and embedded compliance engines is reshaping operating models across banking, payments, and insurance. Incumbent networks such as SWIFT have shifted strategy by adding distributed-ledger modules, while Basel capital rules now steer banks toward permissioned tokenization of traditional assets rather than speculative crypto holdings. Enterprise buyers continue to favor middleware that bridges legacy cores to multiple ledgers, but the rise of low-cost Layer-2 rollups is steadily diverting spending to protocol infrastructure. Regionally, the United States dominates revenue on the back of the GENIUS Act and spot Bitcoin ETF approvals, whereas the Middle East provides the highest growth tailwind as central-bank digital-currency pilots move into live settlement rails.
Key Report Takeaways
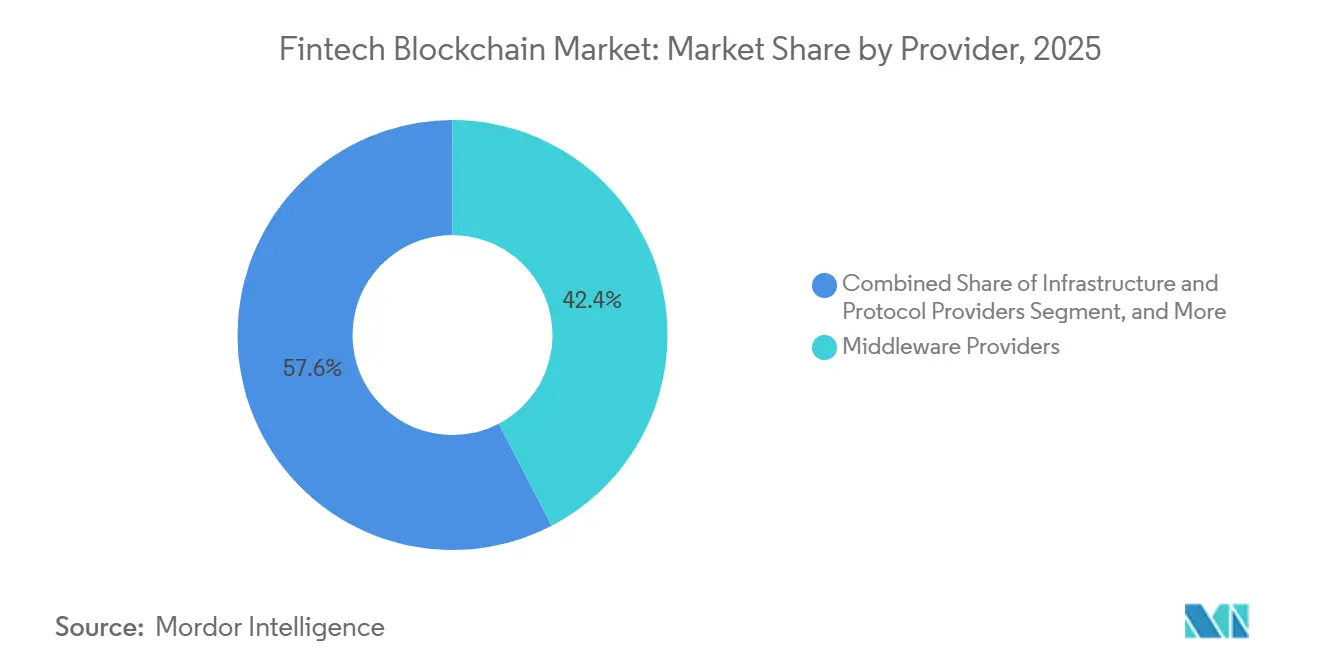
- By provider, middleware led with 42.36% revenue share in 2025, while infrastructure and protocol providers are expanding at an 8.89% CAGR through 2031.
- By application, payments, clearing, and settlement captured 39.56% in 2025, whereas identity management is advancing at a 9.51% CAGR.
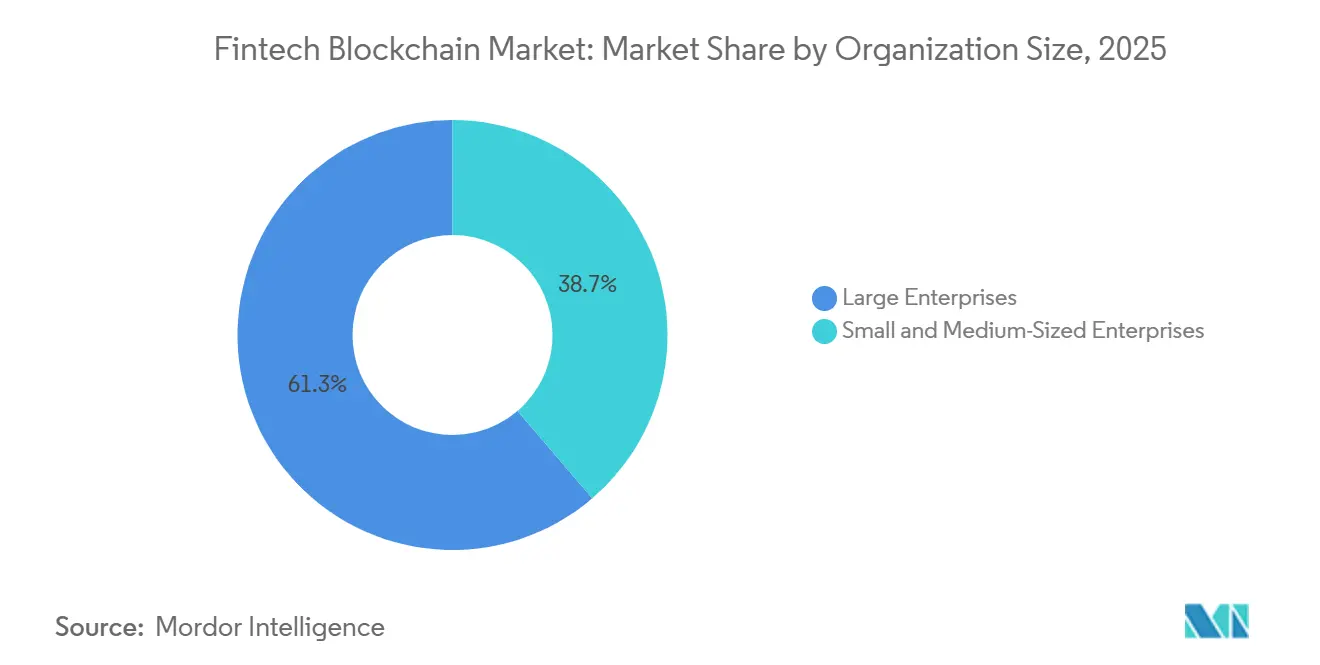
- By organization size, large enterprises accounted for 61.27% of 2025 spending, yet small and medium-sized enterprises are growing at an 8.76% CAGR.
- By end-user vertical, banking held a 55.78% revenue share in 2025, while insurance recorded the fastest growth at an 8.93% CAGR.
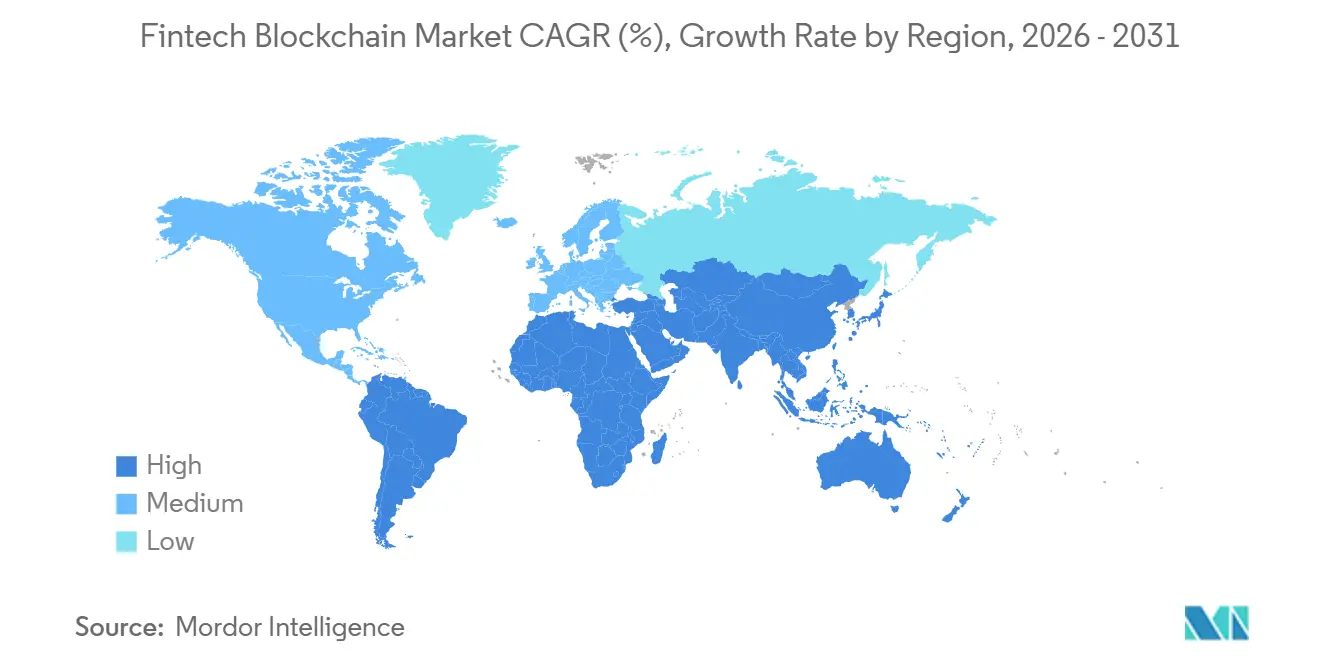
- By geography, North America commanded 42.39% of global revenue in 2025, but the Middle East is projected to register the strongest 9.39% CAGR through 2031.
Note: Market size and forecast figures in this report are generated using Mordor Intelligence’s proprietary estimation framework, updated with the latest available data and insights as of January 2026.
Global Fintech Blockchain Market Trends and Insights
Drivers Impact Analysis*
| Driver | (~) % Impact on CAGR Forecast | Geographic Relevance | Impact Timeline |
|---|---|---|---|
| Increasing Adoption of Blockchain for Cross-Border Payments | +1.8% | Global with early concentration in Asia-Pacific corridors and Middle East wholesale channels | Medium term (2-4 years) |
| Growing Tokenization of Real-World Assets | +1.5% | North America and Europe lead issuance, Asia-Pacific secondary trading emerging | Long term (≥ 4 years) |
| Rising Demand for Compliance Automation (RegTech) | +1.3% | Global, particularly Europe under MiCA and United States GENIUS Act jurisdictions | Short term (≤ 2 years) |
| Expansion of Stablecoins in Corporate Treasury | +1.0% | North America corporates, Latin America remittances, Asia-Pacific e-commerce settlement | Medium term (2-4 years) |
| Surge in Embedded Finance and BaaS Integrations | +1.2% | North America and Europe fintech ecosystems, Asia-Pacific super-apps | Short term (≤ 2 years) |
| Higher Venture Funding for Decentralized Finance Platforms | +0.9% | North America and Europe venture hubs, spillover to Singapore and Hong Kong | Medium term (2-4 years) |
| Source: Mordor Intelligence | |||
Increasing Adoption of Blockchain for Cross-Border Payments
SWIFT’s September 2025 rollout of a distributed-ledger module signaled a pivot by the 40 million messages per day network toward instant, on-chain visibility, narrowing the technology gap with Ripple and Stellar corridors.[1]SWIFT, “SWIFT Explores Blockchain Interoperability for Cross-Border Payments,” swift.com The Bank for International Settlements confirmed that Project mBridge settled USD 22 billion in wholesale trades during 2025, compressing settlement time from two days to seconds and halving fees. Consumer remittance lanes are following suit, evidenced by MoneyGram’s integration of Stellar rails that cut transaction costs below 1%. Asia-Pacific, which accounts for 42% of global remittance volume, offers the largest sandbox thanks to supportive rules under Singapore’s Payment Services Act. As regulatory certainty grows, cross-border corridors are expected to tip decisively toward blockchain rails well before 2031.
Growing Tokenization of Real-World Assets
The World Economic Forum projects that tokenized real-world assets could represent USD 16 trillion by 2030, yet liquidity remains fragmented across permissioned venues.[2]World Economic Forum, “Tokenization of Real-World Assets Could Represent USD 16 Trillion Market by 2030,” weforum.org The European Investment Bank scaled digital-bond issuance from EUR 100 million in 2021 to EUR 600 million (USD 648 million) by 2025, proving operational savings over book-entry systems. Siemens’s EUR 60 million (USD 65 million) digital bond on Polygon reduced issuance costs by 40% and bypassed intermediaries. Tokenized commodities such as Paxos Gold now exceed USD 1 billion outstanding, furnishing on-chain collateral for decentralized lending pools. Basel Group 1 treatment for tokenized traditional assets eliminates punitive capital weights, opening bank balance sheets to tokenized collateral.
Rising Demand for Compliance Automation (RegTech)
Chainlink’s Adaptive Compliance Engine enables smart contracts to query sanctions lists in real-time, automating checks that were previously handled through multi-day manual reviews.[3]Chainlink, “Adaptive Compliance Engine,” chain.link Europe’s MiCA framework, effective January 2025, mandates transaction monitoring for crypto-asset service providers, creating a surge in demand for blockchain-native analytics middleware. The United States GENIUS Act offers safe-harbor status for compliant tokenized securities, pushing issuers to embed disclosure logic directly into smart contracts. Banks are adopting decentralized identifiers based on W3C Verifiable Credentials to slash onboarding time and reduce breach risk. FATF guidance clarifies that DeFi protocols with identifiable operators still fall under AML rules, driving adoption of permissioned identity layers.
Expansion of Stablecoins in Corporate Treasury
Stripe’s USD 1.1 billion acquisition of Bridge underscored the strategic value of stablecoin infrastructure for merchant settlement. Visa’s Tokenized Asset Platform allows banks to issue fiat-backed tokens on Ethereum Layer-2 networks, reducing interchange by 30 basis points and settling card flows instantly. Shopify merchants using Solana Pay process more than 2 million transactions monthly with fees under USD 0.01. Corporate treasurers in Latin America now hold stablecoins to hedge currency volatility, while Asia-Pacific e-commerce firms settle cross-border orders in tokenized USD to dodge costly correspondent chains. As audit and attestation frameworks mature, stablecoin floats are expected to migrate from retail wallets to enterprise treasuries at scale.
Restraints Impact Analysis*
| Restraint | (~) % Impact on CAGR Forecast | Geographic Relevance | Impact Timeline |
|---|---|---|---|
| Interoperability Gaps Among Permissioned Ledgers | -1.2% | Global, with acute friction in Europe where multiple consortia run in silos | Medium term (2-4 years) |
| Scarcity of Tokenized-Asset Secondary Liquidity | -0.9% | North America and Europe primary issuance, Asia-Pacific trading underdeveloped | Long term (≥ 4 years) |
| Cross-Chain Bridge Cyber-Risk Exposure | -0.7% | Global, with heightened scrutiny in North America and Europe | Short term (≤ 2 years) |
| Capital-Charge Impact of Basel Crypto Rules on Banks | -1.1% | Global banking systems, European and North American banks most constrained | Medium term (2-4 years) |
| Source: Mordor Intelligence | |||
Interoperability Gaps Among Permissioned Ledgers
Enterprises often participate in multiple consortia, Hyperledger Fabric, R3 Corda, and Canton, yet divergent consensus and data models force parallel infrastructure, inflating costs and back-office reconciliation. Chainlink’s CCIP promises cross-chain messaging but remains confined to public networks because most permissioned ledgers restrict external oracle access. The European Blockchain Services Infrastructure illustrates the challenge: 27 member states adopted varied identity schemas, blocking seamless data exchange. Banks, therefore, face a choice between surrendering flexibility to a dominant consortium or running isolated networks that sacrifice network effects. Until a universal interoperability layer meets privacy, audit, and throughput needs, multi-ledger fragmentation will temper large-scale rollouts.
Capital-Charge Impact of Basel Crypto Rules on Banks
Basel’s December 2024 framework assigns a 1,250% risk weight to unbacked crypto, functionally excluding it from bank balance sheets. European banks already operating near Capital Requirements Regulation buffers now incur an 8-12% capital add-on even for Group 1 tokenized assets, stalling growth of digital-bond trading desks. United States banks must secure supervisory approval under SR 22-6 before engaging in crypto activities, raising compliance overhead that regional lenders struggle to absorb. In Japan, Financial Services Agency rules require crypto operations to be ring-fenced in separately capitalized subsidiaries, fragmenting economies of scale. The result is a two-tier market dominated by well-capitalized global banks, with smaller institutions relegated to custodial or agency roles, concentrating systemic exposure in a handful of providers.
*Our forecasts treat driver/restraint impacts as directional, not additive. The impact forecasts reflect baseline growth, mix effects, and variable interactions.
Segment Analysis
By Provider: Middleware Orchestrates Multi-Ledger Workflows
Middleware providers held 42.36% of the fintech blockchain market share in 2025, underscoring enterprise demand for abstraction layers that bridge legacy core systems to multiple distributed ledgers without rip-and-replace disruption. Platforms such as IBM Blockchain process over 20,000 transactions per second for trade-finance consortia, enabling confidential data segregation and granular permissioning. Application and solution vendors controlled roughly 35% of spending as banks opted for turnkey payment, custody, and compliance modules that accelerate time-to-market. The fintech blockchain market size allocation for infrastructure and protocol providers is rising at an 8.89% CAGR because firms now spin up self-hosted nodes on Ethereum Layer-2 rollups, Polygon proof-of-stake chains, and Avalanche subnets that achieve sub-second finality and negligible fees. Canton Network’s privacy-preserving synchronization is attracting capital markets operators seeking a single source of truth without over-sharing order books. Oracle’s integration of Blockchain Platform into its Fusion Cloud suite illustrates how software giants bundle ledger services with ERP and supply-chain modules to lock in enterprise workflows.
Demand patterns are set to evolve as large banks insource protocol expertise for cost and latency control, while mid-tier institutions favor managed middleware that outsources node maintenance and governance upgrades. Open-source ecosystems are also shifting the competitive balance because Hyperledger Fabric, Corda, and Ethereum each offer pluggable consensus, enabling third-party service firms to monetize support rather than proprietary code. As firms deploy multi-ledger architectures, neutral orchestrators that normalize APIs and event streams across networks stand to capture outsized wallet share. Consequently, middleware is expected to retain leadership in absolute revenue, even though protocol spending posts the faster growth rate through 2031.


By Application: Identity Management Gains Traction Beyond Payments
Payments, clearing, and settlement remained the anchor, commanding 39.56% of 2025 spending as incumbents integrated blockchain tracking and on-demand liquidity services. Identity management, however, posted the highest 9.51% CAGR as banks adopted W3C Verifiable Credentials to centralize know-your-customer outcomes while decentralizing raw data storage. The fintech blockchain market size attached to exchanges and remittance platforms represented about 22%, driven by Coinbase institutional brokerage and Stellar MoneyGram corridors. Smart contracts supporting letter-of-credit workflows and parametric insurance captured roughly 18%, with Chainlink oracles feeding data into more than 10,000 live contracts. Compliance management rounded out 12% as MiCA rules forced real-time blockchain analytics in Europe.
Looking ahead, identity layers are poised to leapfrog payments once decentralized identifiers integrate seamlessly into mobile wallets and government e-ID programs. Bank onboarding that once took days now completes in minutes, freeing staff capacity and improving conversion. As cross-border trade digitizes bills of lading and certificates of origin, identity and compliance modules will intertwine, enabling straight-through processing from contract initiation to customs clearance. Tokenized loyalty and decentralized credit scoring pilots in Asia-Pacific super-apps further broaden application scope, ensuring the fintech blockchain market continues to diversify beyond its payment roots.
By Organization Size: SMEs Leverage BaaS for Instant Settlement
Large enterprises generated 61.27% of 2025 revenue, reflecting the regulatory complexity and capital intensity of running permissioned networks. JPMorgan Onyx and HSBC FX Everywhere illustrate how megabanks internalize ledger infrastructure to shave intraday funding costs. Yet, small and medium-sized enterprises are expanding at an 8.76% CAGR, propelled by Banking-as-a-Service platforms that abstract away node management. Synctera and Treasury Prime integrated stablecoin rails in 2025, allowing more than 500 fintech clients to settle invoices and foreign exchange within seconds at sub-1% spreads. In Latin America, stablecoin settlement helps SMEs hedge macro volatility, as seen when Nubank piloted USDC flows for cross-border payments.
As regulatory sandboxes in Singapore, the United Arab Emirates, and the United Kingdom lower entry barriers, SMEs can test custody and lending modules without full licenses, accelerating adoption. The fintech blockchain market share of SMEs is therefore expected to rise steadily, even as large enterprises maintain topline dominance. Key to scaling is the commoditization of compliance through API-based identity services, which allows smaller firms to satisfy travel-rule obligations and jurisdictional reporting without building bespoke controls.
By End-User Verticals: Insurance Automates Claims via Oracle
Banking captured 55.78% revenue in 2025, anchored by cross-border payments, tokenized-bond issuance, and repo funding on blockchain rails. Non-banking financial services, including asset managers and broker-dealers, accounted for about 28%, led by BlackRock’s tokenized money-market fund, which processed USD 500 million in subscriptions. Insurance logged the fastest 8.93% CAGR, fueled by parametric products that use oracles to settle claims automatically. Lemonade reduced travel-insurance claims processing from weeks to hours through on-chain triggers, cutting administrative costs by 40%. Reinsurers such as Swiss Re and Munich Re are testing smart contracts that programmatically allocate losses across treaty layers, a process previously hampered by manual reconciliation.
Demand momentum in insurance is poised to continue as climate-linked disasters surge, prompting underwriters to seek automated payout mechanisms tied to weather data. Decentralized insurance protocols like Nexus Mutual processed USD 100 million in cover during 2025, demonstrating willingness among crypto-native users to hedge on-chain risk. Overall, diversification beyond banking reduces revenue cyclicality and broadens the fintech blockchain industry’s value proposition across financial services silos.
Geography Analysis
North America’s fintech blockchain market size remains the benchmark as regulators clarify tokenized-asset treatment and institutional investors scale ETF flows. United States banks use GENIUS Act protections to tokenize corporate bonds, while Canada expands custody licenses to non-bank entities, and Mexico’s fintech-law amendments permit sandbox pilots that already process 8% of the high-value corridor to the United States. With major cloud providers headquartered in the region, enterprises enjoy abundant infrastructure choice, reinforcing the current revenue lead.
Europe benefits from early digital-bond frameworks and MiCA’s uniform passporting, which reduces legal fragmentation and encourages continental deployment. Germany’s electronic securities law has already enabled direct issuance of EUR-denominated bonds on-chain. France captured Circle’s European headquarters relocation, highlighting policy competitiveness. Meanwhile, the United Kingdom, now outside the European Union, uses a digital-securities sandbox to maintain relevance, plus Switzerland’s independent DLT law continues to attract custody startups.
Asia-Pacific exhibits heterogeneous progress. China’s retail digital currency dwarfs other CBDC pilots by volume, yet strict capital controls limit cross-border use. Japan’s Digital Yen, India’s blockchain-enhanced UPI, and South Korea’s tokenized-bond sandbox position the region for rapid deployment once interoperability questions are resolved. Australia’s delay of the CHESS replacement underscores implementation complexity but also confirms long-term commitment to large-scale adoption. Across the region, super-apps integrating blockchain loyalty points and micro-insurance are likely to widen retail participation.

Regulatory Landscape
Basel rules finalized in December 2024 assign a 1,250% risk weight to unbacked crypto exposures, pushing banks toward tokenized structures and regulated custody models. MiCA became effective in January 2025, and EU Regulation 2025/2531, effective December 2025, sets reference standards for qualified electronic ledgers under the eIDAS framework, enabling regulated records.
In 2026, US, UK, and EU frameworks advanced further. The US SEC issued interpretive guidance in March 2026 on applying securities laws to certain crypto assets, and the White House issued a May 2026 executive order directing a 90-day regulatory review. The UK Cryptoassets Regulations 2026 and FCA Policy PS26/13 (June 2026) expanded obligations for regulated crypto activities. ISO/TS 23516:2026 for DLT interoperability (March 2026) and EDPB Guidelines 02/2025 Version 2.0 adopted July 7, 2026) emphasized interoperability and privacy by design for enterprise rollouts.
Value Chain Analysis
The fintech blockchain value chain spans protocol and infrastructure providers (public chains, permissioned frameworks, Layer-2 networks, node tooling), security and custody (wallets, key management, MPC/HSM, institutional custody), and middleware and orchestration (APIs, event streaming, identity and compliance engines), with application layers spanning payments, tokenization, identity, and compliance. Enterprise procurement via cloud marketplaces and systems integrators shapes distribution choices around legacy core integration, resilience requirements, and regulatory controls. Visa introduced the Visa Stablecoin Platform in July 2026 to support enterprise stablecoin minting, movement, and management, and to connect those flows to existing payment network constructs.
Downstream, market infrastructure and banks provide the regulated rails and balance-sheet functions that make production use cases scalable, while issuers and market makers supply liquidity for tokenized instruments and stablecoins. DTCC processing live production trades involving tokenized stocks, ETFs, and U.S. Treasuries in July 2026 highlights the role of financial market infrastructure as a gatekeeper for tokenized secondary-market workflows. On the banking side, Citi Token Services moving into live 24/7 USD clearing with Siam Commercial Bank as the first client (July 2026) shows incumbents productizing tokenized deposits and near-real-time cross-border settlement. Interoperability between permissioned and public ecosystems, cross-chain security, and consistent identity and privacy controls remain persistent bottlenecks, which raises the value of standards (for example, ISO interoperability work) and middleware that normalizes policy enforcement across multiple ledgers.
Competitive Landscape
Competition remains moderate, with the top five vendors, IBM, Microsoft, Ripple, Coinbase, and Circle, collectively holding about 38% share. Tech incumbents capitalize on entrenched enterprise relationships: Microsoft embeds ledger access in Azure Active Directory, while Amazon Web Services provides one-click managed nodes, shortening proof-of-concept cycles for corporate buyers. IBM targets regulated consortia, pairing Hyperledger Fabric with consulting to lock in multi-year support contracts.
Crypto-native firms differentiate via regulatory alignment and custodial depth. Coinbase Prime processed USD 500 billion in 2025 volume, offering segregated cold storage and insurance that satisfy institutional due diligence standards. Circle’s USDC expansion to 15 networks widens its moat in stablecoin liquidity and cross-chain reach. Ripple’s focus on on-demand liquidity corridors, coupled with partnerships like Mastercard’s Southeast Asia pilot, reinforces payment use-case dominance.
White-space opportunities revolve around secondary trading for tokenized assets and cross-chain interoperability middleware. Zero-knowledge proof vendors such as Polygon zkEVM are positioned to deliver privacy-preserving settlement that meets audit requirements, while Aave Arc illustrates the future of permissioned DeFi liquidity pools for regulated institutions. Strategic alliances dominate competitive moves: Visa’s Tokenized Asset Platform with HSBC and Citi exemplifies payment networks servicing banks as neutral infrastructure rather than as direct rivals. Consulting majors like Accenture and Tata Consultancy Services capture systems-integration revenue, confirming that services remain pivotal for mainstream adoption.
Fintech Blockchain Industry Leaders
Accenture PLC
AlphaPoint Corporation
Amazon Web Services Inc.
Bitfury Group Limited
BTL Group
- *Disclaimer: Major Players sorted in no particular order

Market Opportunities and Future Outlook
Opportunities center on production-grade cross-border settlement and wholesale tokenized finance, where regulated money, compliance, and interoperability can be combined into a single operating workflow. BIS Project Agora (May 2026) demonstrated a model that combines tokenized commercial bank deposits with tokenized central bank reserves on a shared platform for cross-border payments, and its move toward real-value testing creates room for vendors offering permissioned interoperability, liquidity controls, and embedded compliance for multi-jurisdiction settlement. The IMF (April 2026) also outlined an interoperability approach based on a common interface layer (the XC platform concept) rather than a single global ledger, supporting demand for neutral middleware that bridges bank cores to multiple tokenization and payment networks.
Across Europe, the Eurosystem Appia roadmap (March 2026) and the Pontes launch in Q3 2026 provide a concrete program anchor for tokenized wholesale-market plumbing, including post-trade and cash-leg coordination. That expands spend on identity, privacy-preserving data sharing, and auditability. In the United States, the May 2026 executive order directing regulators to identify barriers to integrating fintech innovation supports an enablement posture alongside enterprise adoption already visible in tokenization, stablecoin treasury, and compliance automation. Across these initiatives, the clearest whitespace is (i) interoperability that fits regulator expectations for privacy and operational resilience, (ii) secondary-market workflows for tokenized assets that connect to market infrastructure and broker-dealer controls, and (iii) institutional identity and policy layers that align with GDPR-oriented guidance such as the EDPB blockchain guidelines while still supporting real-time settlement.
Recent Industry Developments
- June 2026: Accenture expanded the Accenture AWS Business Group with a new products capability focused on AI-enabled enterprise solutions. The move strengthens packaged delivery for regulated clients modernizing cloud and data stacks that often host digital-asset, identity, and compliance components. It also reinforces the role of systems integrators in taking blockchain projects from pilots into enterprise-scale operations.
- March 2026: ISO/TS 23516:2026 for DLT interoperability was published, signaling a major standard update for cross-ledger interoperability. The update informs vendor selection and architecture decisions across regulated fintech programs.
- January 2026: Accenture and NTT DOCOMO GLOBAL launched Universal Wallet Infrastructure to support cross-enterprise issuance and verification of digital credentials and tokens. The platform targets digital identity and credential portability, enabling KYC onboarding and permissioned access to tokenized financial services.


Research Methodology Framework and Report Scope
Market Definition and Coverage
We size the fintech blockchain market as the annual revenue generated from blockchain platforms, infrastructure, and application layers that are implemented to deliver financial services use cases, including payments, settlement, identity, and compliance. Values are measured in USD and reflect realized spending by financial institutions and fintech users.
Scope exclusions: We exclude consumer crypto trading activity, token price movement, and pure cryptocurrency market capitalization when it is not tied to enterprise fintech blockchain deployment spending.
Segmentation Overview
- By Provider
- Middleware Providers
- Application and Solution Providers
- Infrastructure and Protocol Providers
- By Application
- Payments, Clearing, and Settlement
- Exchanges and Remittance
- Smart Contract
- Identity Management
- Compliance Management / KYC
- Other Applications
- By Organization Size
- Large Enterprises
- Small and Medium-Sized Enterprises
- By End-User Verticals
- Banking
- Non-Banking Financial Services
- Insurance
- By Geography
- North America
- United States
- Canada
- Mexico
- Europe
- Germany
- United Kingdom
- France
- Russia
- Rest of Europe
- Asia-Pacific
- China
- Japan
- India
- South Korea
- Australia
- Rest of Asia-Pacific
- Middle East and Africa
- Middle East
- Saudi Arabia
- United Arab Emirates
- Rest of Middle East
- Africa
- South Africa
- Egypt
- Rest of Africa
- Middle East
- South America
- Brazil
- Argentina
- Rest of South America
- North America
Data Sources, Market Sizing, and Validation
Desk Research
Desk research starts by setting the demand boundary around financial services use cases where blockchain is actually deployed, and then mapping it to measurable signals. We referenced public sources such as the Bank for International Settlements (BIS) for payment and settlement context, World Bank and IMF datasets for macro and cross-border activity context, and ISO guidance (like ISO 20022) to understand messaging and interoperability themes that shape adoption.
We also used regulatory and program updates from sources such as the Financial Stability Board, central bank publications (including CBDC and tokenization papers), and securities regulators for digital asset and tokenization direction. These were supplemented with company filings, investor presentations, audited annual reports, association websites, and reputed press coverage to validate timing of launches and spending priorities. Where needed, we used paid subscriptions focused on company financials and intelligence, news and financials, patents, and global contracts and tenders to fill gaps on commercial traction. The desk sources listed here are illustrative only, since many other public documents were consulted for cross-checks and clarification.
Primary Interviews and Surveys
Primary work was used to pressure-test what gets counted as fintech blockchain spending, and to confirm how budgets split between infrastructure, middleware, and application rollouts. We spoke with a mix of providers, system implementers, and end-user teams across banking, insurance, and non-banking financial services. Regional coverage was also balanced so adoption patterns in APAC, EMEA, and the Americas were not overgeneralized.
Distribution of primary research fieldwork respondents
| Company type | Respondent position | Region |
|---|---|---|
| Top tier: 31% | CXOs: 15% | APAC: 46% |
| Mid tier: 47% | Functional/Unit leaders: 29% | EMEA: 32% |
| Smaller Players: 22% | Managers: 56% | Americas: 22% |
Market-Sizing & Forecasting
Market sizing starts with a top-down build where spending is reconstructed from the addressable financial services workload that blockchain is replacing or enabling, and then filtered through adoption rates by use case and region. When the model is built this way, the market total lands only after we apply practical checks on what is deployable within bank-grade and regulator-grade operating constraints.
To corroborate the totals, selective bottom-up approximations are used, such as sampled vendor revenue disclosures, contract announcements, and a volume-by-ASP cross-check for common deployment items (platform subscription, implementation services, and ongoing support). Key inputs used in the model include (illustrative): number of production deployments versus pilots, growth in cross-border payment volumes, CBDC and tokenization program activity, compliance and KYC modernization spending, and shifts in settlement cycle targets that influence infrastructure upgrades. Forecasting relies mainly on scenario analysis, where the base case is shaped by expert views on regulation timing, enterprise security requirements, and interoperability progress, and then applied to the demand drivers so the trajectory stays realistic.
Where bottom-up signals are missing for smaller providers, we estimate their contribution using peer benchmarking on deal size, implementation timelines, and typical renewal patterns, and then adjust it during interview validations.
Data Validation & Update Cycle
We validate outputs by triangulating across independent signals, and then checking whether the implied spending per deployment looks reasonable for each region and end-user vertical. Outliers are reviewed against announcement timelines, regulatory shifts, and macro events, and follow-up calls are triggered when a major assumption changes or a data point looks inconsistent.
Before sign-off, the model and assumptions go through multi-step internal reviews, and the final numbers are rechecked for currency consistency and year alignment. Reports are refreshed annually, with interim updates when material events occur, and a fresh final pass is completed right before delivery so clients receive the latest updated view.
Mordor Intelligence's Fintech Blockchain Market Sizing Compared With Other Published Estimates
Published market sizes for fintech blockchain often differ because each publisher draws the line differently on what counts as fintech use and what gets treated as broader blockchain technology. Timing differences also matter because fast-moving pilots, regulatory milestones, and enterprise go-lives can shift the current-year value meaningfully.
The biggest gap drivers typically come from scope and counting logic, such as whether consumer crypto activity is mixed into enterprise deployment revenue, and whether implementation services are fully included or only platform spend is counted. Differences in how currency conversions are timed, how ASP changes are assumed, and how often models are refreshed also create spread, especially when newer CBDC and tokenization programs are interpreted as near-term revenue versus longer-cycle initiatives.
Benchmark comparison
| Source | Market Size | Gaps in Research Methodology |
|---|---|---|
| Mordor Intelligence | USD 7.42 B (2026) | |
| Trade Journal A | USD 4.36 B (2024) | Uses an earlier base year and a faster-growth framing, and it can understate enterprise-grade rollout timing by counting pilots and planned adoption as current spend. |
| Industry Newswire B | USD 3.16 B (2023) | Leans on a narrower starting value and then applies aggressive CAGR assumptions, which can blend adjacent digital asset activity into fintech blockchain without consistently separating deployment revenue. |
The table shows that year selection and scope discipline explain much of the difference, especially when pilots, consumer crypto activity, or broad blockchain spend are counted alongside bank and fintech deployments. By anchoring the total to production-use fintech workloads and validating adoption timing through interviews, the current-year figure stays more traceable, which is the approach applied by Mordor Intelligence.


Key Questions Answered in the Report
How fast is the fintech blockchain market expected to grow through 2031?
The market is projected to expand at an 8.31% CAGR, rising from USD 7.42 billion in 2026 to USD 11.06 billion by 2031.
Which provider category currently leads spending?
Middleware providers hold the largest share at 42.36% because they connect legacy cores to multiple blockchains without major infrastructure replacement.
What application area is growing the quickest?
Identity management is advancing at a 9.51% CAGR as banks deploy decentralized identifiers to streamline know-your-customer workflows.
Which region shows the highest growth momentum?
The Middle East registers the fastest regional CAGR at 9.39% due to CBDC pilots and progressive virtual-asset licensing in the United Arab Emirates and Saudi Arabia.
Why are capital rules important for blockchain adoption in banking?
Basel’s bifurcated framework levies a 1,250% risk weight on unbacked crypto, steering banks toward permissioned tokenization and limiting speculative holdings on balance sheet.
How concentrated is the competitive landscape?
The top five vendors account for about 38% of revenue, reflecting moderate concentration with ample space for specialized entrants in custody, compliance, and interoperability.
Page last updated on:






