
Market Overview
| Study Period | 2020 - 2031 |
|---|---|
| Forecast Data Period | 2026 - 2031 |
| Base Year Market Size (2025) | USD 32.75 Billion |
| Market Size (2026) | USD 35.57 Billion |
| Market Size (2031) | USD 53.79 Billion |
| Growth Rate (2026 - 2031) | 8.62 % |
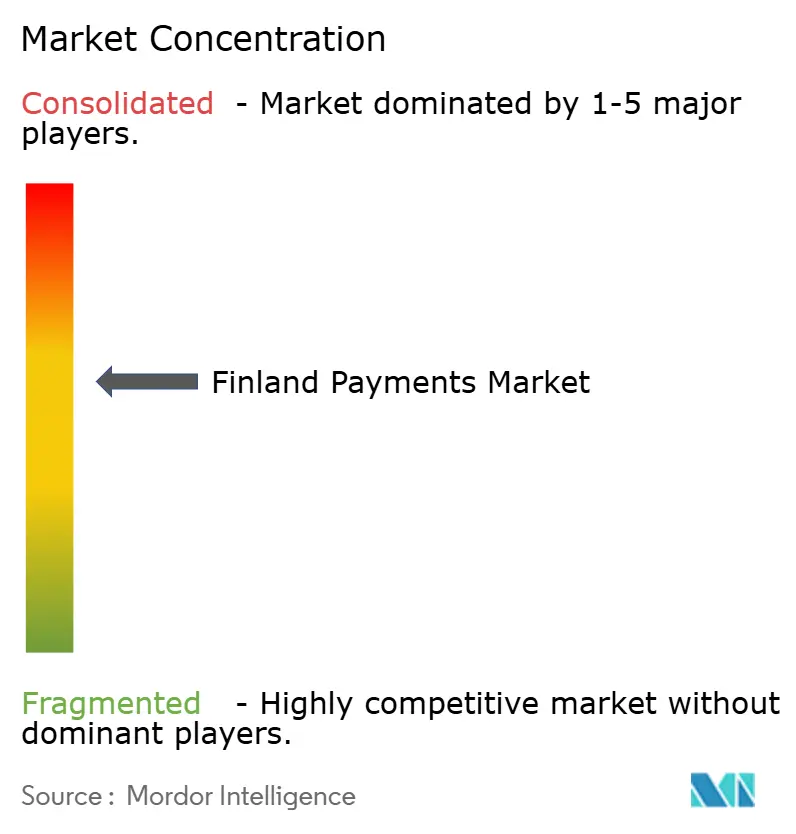
| Market Concentration | Medium |
Major Players *Disclaimer: Major Players sorted in no particular order Image © Mordor Intelligence. Reuse requires attribution under CC BY 4.0. | |
Finland Payments Market Analysis by Mordor Intelligence
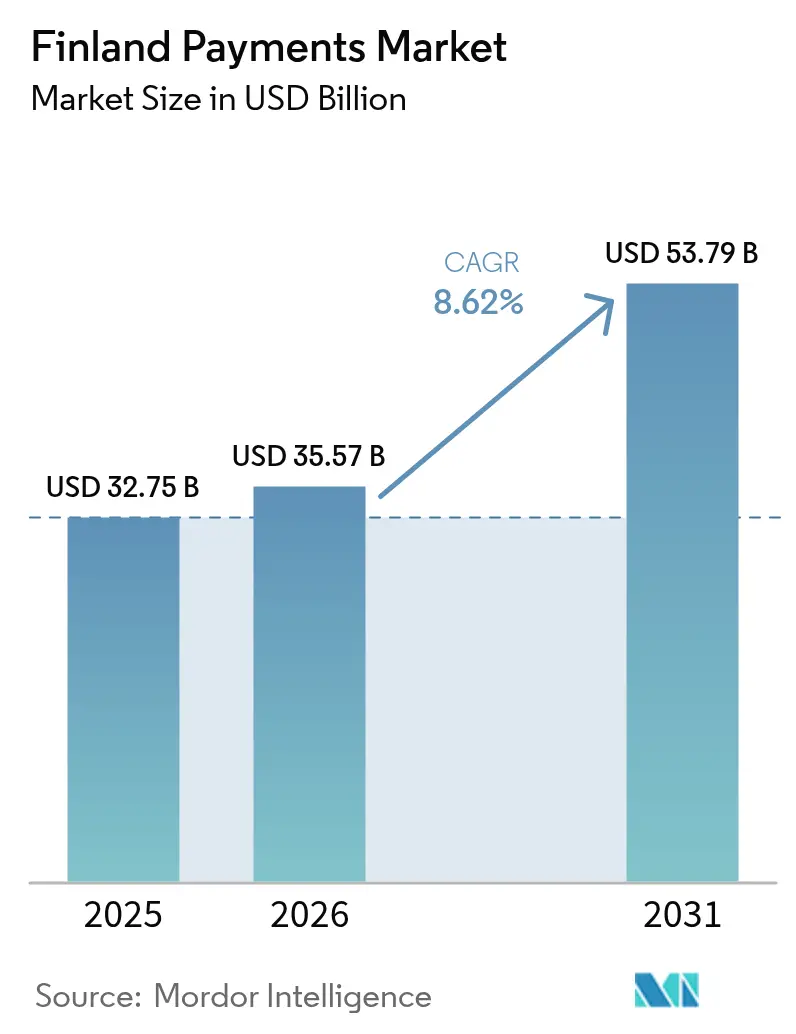
The Finland payments market size was valued at USD 32.75 billion in 2025 and estimated to grow from USD 35.57 billion in 2026 to reach USD 53.79 billion by 2031, at a CAGR of 8.62% during the forecast period (2026-2031). Sustained digital adoption, Nordic wallet interoperability, and the government’s ISO 20022-based real-time rails keep momentum high. Digital payments already cover 75% of retail transactions, well ahead of the European average.[1] Card usage at point-of-sale (POS) remains widespread, yet mobile and account-to-account (A2A) options gain share as millennials and Gen Z prioritise low-cost, mobile-first methods. The MobilePay–Vipps merger now gives merchants one interface to 27 million Nordic consumers, reducing cross-border processing costs by up to 20%. Government policy is equally catalytic: instant payments exceeded 60.65 million transactions in 2024 and are a test bed for the European Central Bank’s (ECB) digital-euro pilots. Fraud trends nevertheless pressure margins: authorised push-payment scams rose 156% year-over-year, compelling banks to accelerate AI-based authentication investments.
Key Report Takeaways
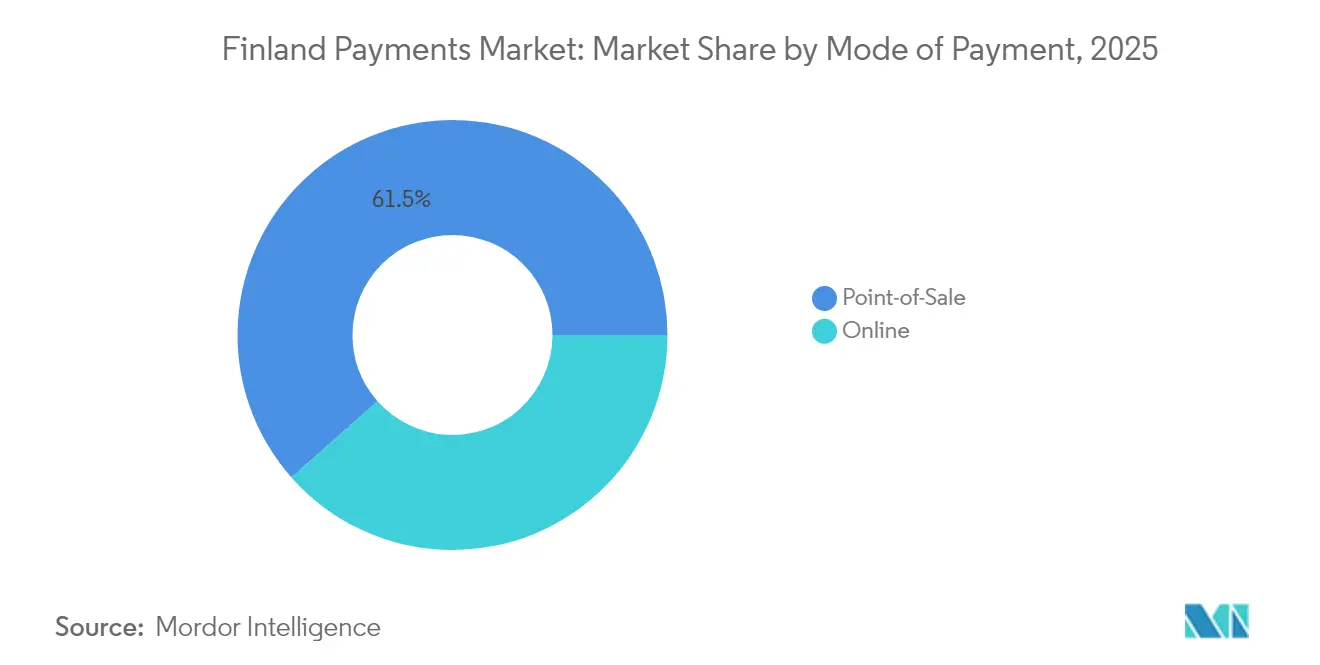
- By mode of payment, Card payments at POS held 12.48% of Finland payments market share in 2025; ;Point-Of-Sale Payment held at around 61.52% share; Digital Wallet & A2A in online channels are projected to grow at a 13.02% CAGR to 2031.
- By interaction channel, POS captured 20.78% of Finland payments market size in 2025, while E-commerce/M-commerce will expand at an 10.86% CAGR through 2031.
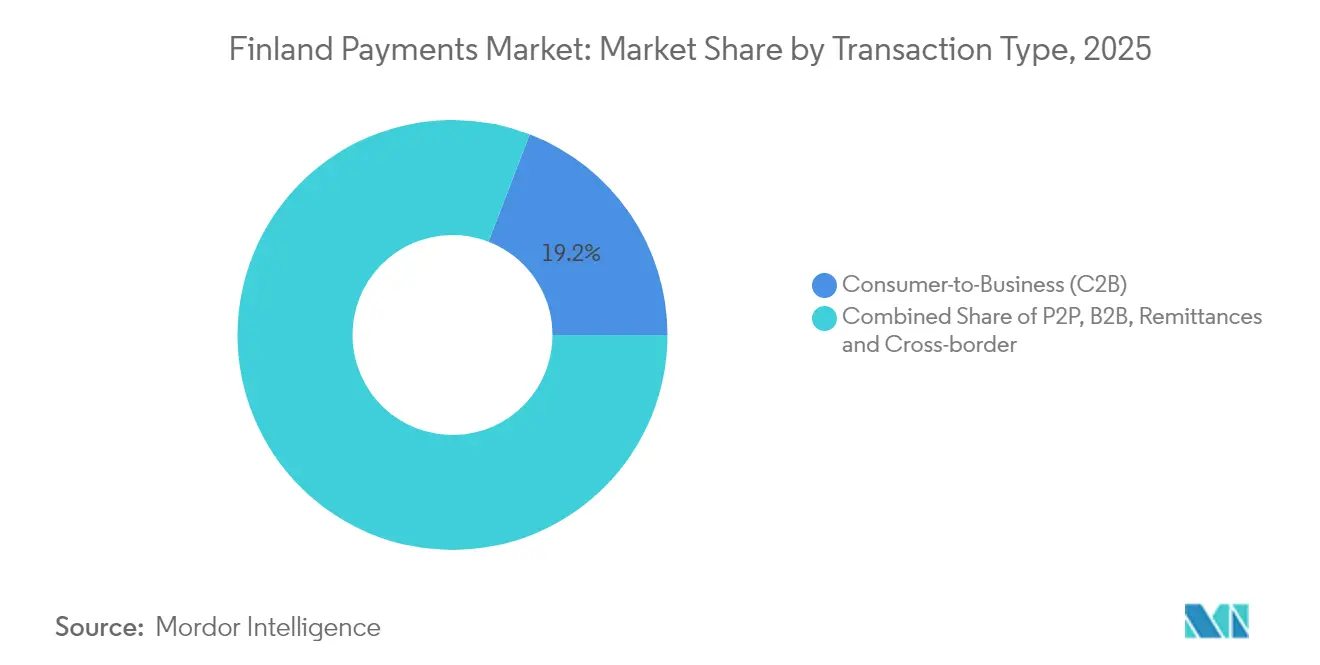
- By transaction type, Consumer-to-Business led with 19.15% Finland payments market share in 2025; Person-to-Person will advance at a 12.01% CAGR during 2026-2031.
- \By end-user industry, Retail commanded 11.32% share of Finland payments market size in 2025, whereas Entertainment & Digital Content is forecast to rise at a 12.74% CAGR to 2031.
Note: Market size and forecast figures in this report are generated using Mordor Intelligence’s proprietary estimation framework, updated with the latest available data and insights as of 2026.
Finland Payments Market Trends and Insights
Drivers Impact Analysis*
| Driver | (~) % Impact on CAGR Forecast | Geographic Relevance | Impact Timeline |
|---|---|---|---|
| E-commerce & m-commerce Surge Driven by Cross-Border Retail Spend Growth | +1.8% | Finland with Nordic spillover effects | Medium term (2-4 years) |
| Government-Led Digital ID & Real-Time Payment Infrastructure Expansion | +2.1% | National, concentrated in Helsinki metropolitan area | Long term (≥ 4 years) |
| Rapid Adoption of A2A & BNPL Instruments among Gen Z and Millennials | +1.5% | National with urban concentration | Short term (≤ 2 years) |
| Merger of MobilePay-Vipps Accelerating Nordic Wallet Interoperability | +1.2% | Nordic region with Finland as key beneficiary | Medium term (2-4 years) |
| Retailers' Omnichannel Push for Cost-Efficient Cashless Acceptance | +1.0% | National with retail sector focus | Short term (≤ 2 years) |
| ISO 20022 Migration Boosting Data-Rich Corporate Payments Automation | +0.7% | National with B2B sector concentration | Long term (≥ 4 years) |
| Source: Mordor Intelligence | |||
E-commerce & m-commerce surge driven by cross-border retail spend growth in Finland
E-commerce turnover hit USD 15.8 billion in 2024, with 62% of shoppers preferring domestic online stores that now integrate global rails for stock access. Mobile-payment penetration jumped from 18% in 2021 to an estimated 58% in 2025, underscoring Finland payments market momentum. Finnish merchants leverage A2A rails to cut card fees, and such transfers already power 28.1% of online payments.[2] Cross-border enablement widens addressable demand, helping smaller retailers defend share against global platforms. Nordic wallet interoperability after the MobilePay-Vipps deal further enhances checkout speed and lowers cost for shoppers abroad.
Government-led digital ID & real-time payment infrastructure expansion drives the market
The 2030 National Digital Roadmap aligns with the EU Digital Decade by positioning instant payments as economic infrastructure. Transaction volumes on real-time rails rose to 60.65 million in 2024. Seamless linkage between digital identity and payments cuts authentication friction in high-value transfers. Cash circulation fell from EUR 13.2 billion (USD 15.4) in 2019 to EUR 8.1 billion (USD 8.9 billion) in 2024, providing runway for the ECB’s digital-euro pilots.
Rapid adoption of A2A & BNPL instruments among Gen Z and Millennials
Bank transfers are now the preferred online bill-pay method for 64% of Finns, well above card preference at 40%. Younger cohorts value fee transparency and mobile flow, steering demand to A2A and instalment products. BNPL’s rise faces regulatory scrutiny after Klarna investigations, but also invites banks to launch compliant instalment lines with predictable credit checks. Competitive pressure accelerates innovation in responsible lending models inside Finland payments market.
Merger of MobilePay-Vipps accelerating Nordic wallet interoperability
With P27’s collapse, the MobilePay-Vipps merger became the Nordic fix for cross-border retail payments. The combined wallet reaches 27 million users and brings scale against card schemes. Finnish merchants can now accept a single QR or tokenised credential for consumers from Norway, Denmark, and Sweden. Early data suggest processing cost reductions of 15-20% and 10-point faster checkout conversion among Nordic travellers.
Restraints Impact Analysis*
| Restraint | (~) % Impact on CAGR Forecast | Geographic Relevance | Impact Timeline |
|---|---|---|---|
| Escalating APP & Real-Time Fraud Pressure Despite PSD2 SCA | -1.4% | National with urban concentration | Short term (≤ 2 years) |
| High Interchange & Scheme Fees vs. Low-Margin Nordic Merchants | -1.1% | Nordic region with Finland impact | Medium term (2-4 years) |
| Aging Rural Demographics Retaining Cash Preference | -0.8% | Rural Finland regions | Long term (≥ 4 years) |
| Fragmented Legacy POS Estates Slowing Contactless Hardware Roll-outs | -0.6% | National with SME sector focus | Medium term (2-4 years) |
| Source: Mordor Intelligence | |||
Escalating APP & real-time fraud pressure despite PSD2 SCA
Banks blocked EUR 44 million (USD 48.4 million) of fraudulent transfers in 2024, but total losses still reached EUR 80 million (USD 88 million).[3] Sophisticated social-engineering scams leverage voice cloning and AI to circumvent Strong Customer Authentication. Nordic banks invest in machine-learning engines capable of contextual risk scoring, yet smaller PSPs struggle with the cost of advanced models. Incoming Payment Services Regulation raises liability on providers, compelling industry-wide fraud-share agreements that may slow onboarding times.
High interchange & scheme fees vs. low-margin Nordic merchants
Interchange caps of 0.2% (debit) and 0.3% (credit) still feel high in sub-2% margin retail categories. Merchants therefore push A2A, QR payments, and future digital-euro options that promise near-zero merchant service fees. Card volumes remain sizable but growth plateaus as merchants steer consumers to cheaper rails through loyalty programmes and checkout incentives.
*Our forecasts treat driver/restraint impacts as directional, not additive. The impact forecasts reflect baseline growth, mix effects, and variable interactions.
Segment Analysis
By Mode of Payment: Digital transformation accelerates beyond cards
Card payments at POS remained the largest slice with 12.48% of Finland payments market share in 2025, reflecting decades-long card penetration and near-universal contactless issuance. Overall, Point-of-Sale Payment is largest share with 61.52%. Yet Digital Wallet & A2A options in online channels will climb at 13.02% CAGR, underscoring consumer appetite for app-based checkouts and merchant need to bypass card fees. The segment’s Finland payments market size is projected to add over USD 4.6 billion in absolute value by 2031. Apple Pay, Google Pay, and regionally Siirto already ride tokenised rails for secure credential storage, but local wallets now extend into QR and biometric wearables. The regulatory path under PSD3 mandating broader central-bank-system access for non-banks further catalyses A2A.
Wearables and QR-code POS payments show early promise in transport and events, but the category remains below 3% of transaction count. Cash still covers some low-value rural purchases, yet the declining circulation trend signals limited upside. Corporate treasury and bill-pay ecosystems increasingly route invoices through direct bank transfers, capitalising on the ISO 20022 data layer. Overall, the payment-mode transition narrative is one of gradual card share erosion and rapid A2A ascent, powered by fintech-bank collaboration inside Finland payments market.

By Interaction Channel: E-commerce momentum challenges POS dominance
POS retains 20.78% Finland payments market size in 2025 because physical retail traffic recovered post-pandemic and contactless checkout is friction-free. Nonetheless, E-commerce/M-commerce channels are forecast to expand at an 10.86% CAGR through 2031, closing the gap as remote shopping habits persist. Same-day delivery expectations and integrated payment-in-app flows lift basket conversion for online merchants. Instant-payment APIs embedded in checkout pages settle funds in seconds, improving working capital and lowering chargeback risk.
The 5G rollout gives mobile-commerce an extra push with latency-free experiences; merchants embed augmented-reality try-outs tied to one-click payments. Finnish consumers lean on national online-bank credentials for 60% of digital purchases, followed by cards at 48% and invoicing at 24%. These mixed behaviours push PSPs to maintain multiple rails inside unified back-office platforms. The Finland payments market hence sees channel strategy shift toward “channel-agnostic” orchestration, where merchants can toggle rails dynamically based on cost, risk, and consumer preference.
By Transaction Type: P2P growth reflects social payment trends
Consumer-to-Business flows continue as the anchor, standing at 19.15% market share in 2025, thanks to retail, leisure, and urban services. Yet Person-to-Person volumes register a 12.01% CAGR outlook, driven by mobile apps that let users send money via phone numbers in under a minute. University campuses and shared-economy services intensify P2P frequency, while low-fee instant transfers make small-value payments economical. The MobilePay–Vipps integration now allows cross-border P2P among Finns working in neighbouring countries, adding another impetus.
Business-to-Business payments sit at a digital tipping point: ISO 20022 enables straight-through processing, detailed remittance, and AI-based cash-flow forecasting. Early adopters reduce reconciliation time by 70%, freeing treasury staff for analytics tasks. Remittances benefit from SEPA’s near-real-time transfers, but the ECB’s Project Icebreaker emphasises even faster cross-currency CBDC corridors, which could further transform cross-border salary and supplier disbursements. Altogether, diversification of transaction types creates a richer revenue mix for PSPs in Finland payments market.
By End-user Industry: Entertainment digitisation drives growth
Retail holds 11.32% Finland payments market share in 2025 because omnipresent card terminals and loyalty apps make cashless the norm in grocery, apparel, and fuel. However, Entertainment & Digital Content is the clear outperformer, predicted to grow 12.74% CAGR to 2031. Streaming subscriptions, in-game purchases, and e-sports ticketing favour recurring, low-friction payments that suit wallets and direct-debit mandates. Tokenised credentials and parental controls make these rails attractive for younger demographics.
Healthcare and public-sector payments slowly digitalise as e-prescription platforms and municipal e-services integrate mobile ID and instant-payment buttons. Hospitality & Travel, still recovering traffic, introduces contactless guest journeys from check-in to minibar. Manufacturing and logistics embrace corporate A2A to shorten supply-chain settlement cycles. Sector-specific developments signal that Finland payments market continues to expand on top of core retail volumes by embedding payments deeper into digital customer journeys.
Geography Analysis
Finland payments market is anchored in the Helsinki metropolitan area, where fintech start-ups co-locate with major banks and where 5G coverage approaches 100%. The city’s talent pool and sandbox initiatives such as the Bank of Finland Innovation Hub accelerate prototype testing. Rural districts lag digital payment penetration; cash utilisation remains over 25% in certain eastern municipalities, prompting policy attention to broadband access and financial inclusion.
Nordic regional factors drive cross-border volumes. Finns vacationing in Sweden expect the same mobile wallet to pay for public transport, which the MobilePay-Vipps merger now supports. Although the pan-Nordic P27 project was shelved, the bilateral approach shows success, and regional regulators observe the model for wider EU replication. Finnish merchants selling to neighbours enjoy lower acquiring costs and simplified refunds thanks to shared token vaults across the three participating countries.
At European scale, PSD3 and the Instant Payments Regulation oblige all euro-area banks to deliver 10-second transfers at the same price as standard SEPA credit transfers. Finnish institutions are comparatively advanced, yet compliance costs still rise as open-data obligations extend. The ECB’s digital-euro preparation places Finland in the early pilot wave, giving local PSPs a first-mover knowledge edge for future pan-European wallet builds. Cumulatively, geography acts less as a barrier and more as a competitive differentiator based on infrastructure readiness.
Regulatory Landscape
Finland payments regulation is anchored in EU payment rules implemented under national law and supervised by Finanssivalvonta (FIN-FSA), with the Bank of Finland overseeing payment systems and coordinating infrastructure work through bodies such as the Payments Council. A near-term compliance driver has been the EU Instant Payments Regulation rollout as noted in Finland from October 2025. It tightens requirements for instant credit transfer availability and introduces payee name and account-number verification, pushing banks and PSPs to upgrade onboarding, fraud controls, and payment-processing workflows.
Supervisory and resilience expectations are also rising as DORA-aligned operational testing becomes more embedded in the sector. The Bank of Finland issued updated TIBER-FI guidance in March 2025 to align resilience testing with EU frameworks. On the authorization side, FIN-FSA introduced a new model for submitting financial information in payment institution authorization applications effective 1 February 2026, which standardizes how applicants demonstrate financial capacity and can affect time-to-authorization for new PSP entrants.
Value Chain Analysis
The Finland payments value chain runs from payers and merchants to PSPs and acquiring or issuing banks, supported by domestic and European clearing and settlement infrastructure across card and wallet schemes. Consumer and merchant acceptance is supported by banks and acquirers, including large groups such as OP Financial Group, Nordea, and Danske Bank, alongside international card networks such as Visa and Mastercard and wallet layers such as Apple Pay and Google Pay that rely on tokenized credentials. Clearing and settlement depend heavily on euro-area infrastructures and rules, including SEPA retail rails and Eurosystem platforms, with Bank of Finland oversight providing governance for critical market infrastructure.
A2A and instant payments add further orchestration layers. National rulebook work for instant payments completed in autumn 2024 under the Payments Council shaped the transition, while responsibility for the Finnish instant payment scheme rulebook moved in October 2025 to Siirto Brand Oy, jointly owned by OP Financial Group and Nordea. This shifts part of the ecosystem from scheme-led card acceptance toward bank-linked instant rails, while DORA and TIBER-FI requirements increase demand for fraud and cyber-resilience testing, along with contingency arrangements across processors, banks, and merchants.
Competitive Landscape
Market concentration is moderate. OP Financial Group, Nordea, and Danske Bank processed roughly 60% of payments in 2024, underpinned by entrenched retail customer bases and multiyear merchant-acquiring contracts. Each bank invests heavily in API marketplaces: Nordea’s portal logs over 50 million API calls monthly, enabling third parties to overlay services while keeping accounts “sticky”.
Fintechs leverage open-banking mandates to cherry-pick profitable niches. Trustly, Enfuce, and Paytrail white-label A2A checkout, lowering costs for SMEs. Tietoevry Banking captured micro-merchant flows with Tap-on-Phone, bypassing hardware vendors. Larger incumbents respond through alliances: Nordea and OP formed a joint venture for phone-number-based payments and e-invoice automation, gaining regulatory approval in February 2025.
Artificial-intelligence investments separate leaders from laggards. EY survey data show 40% of Nordic banks deploy machine learning for fraud and customer-insight use cases. Smaller PSPs face capability gaps, often partnering with cloud-native regtech firms for compliance modules. Overall, competitive dynamics shift away from pure scale and toward data-driven risk management and embedded-payments capabilities within Finland payments market.
Finland Payments Industry Leaders
-
2Checkout (Verifone)
-
OP Financial Group
-
S-Pankki Oyj
-
Nordea Bank Abp
-
Danske Bank A/S
- *Disclaimer: Major Players sorted in no particular order
Market Opportunities and Future Outlook
Merchant checkout and PSP offerings have clear whitespace in account-to-account and instant-payment experiences, where providers can compete with card economics while meeting EU instant-payment compliance and verification requirements. At the same time, Finland remains a high-usage card market that still supports innovation in acceptance and orchestration. Bank of Finland data show Finnish card payments totaled EUR 17.8 billion in Q1 2026, up 5.6% year-on-year, with contactless accounting for 45% of card transaction value and remote payments for 29%, supporting demand for unified fraud tooling and multi-rail routing across POS and e-commerce.
Domestic scheme and interoperability developments create additional commercialization paths for banks, wallets, and merchant-facing PSPs. The Siirto program is moving from rulebook to implementation, with an in-house technology launch planned for H1 2026 and rollout steps such as renewed Siirto availability for OP customers from June 3, 2026. Siirto also joined the EuroPA network in May 2026, pointing to a route toward cross-border P2P capability beyond domestic transfers. Compliance-driven product redesign is another opportunity area, as FIN-FSA introduced a new submission model for payment institution authorization applications effective February 2026, and Finnish VAT guidance and case law in 2026 (Central Tax Board decision and Supreme Administrative Court clarification) increase the need for PSPs to unbundle invoicing between taxable technical components and VAT-exempt payment execution.
Recent Industry Developments
- July 2026: The Finnish Supreme Administrative Court (KHO) clarified that regulated payment services directly facilitating the transfer of funds qualify for VAT exemption under the Finnish VAT Act, regardless of contractual phrasing. This affects how PSPs structure service descriptions, contracts, and invoicing for payment execution versus adjacent technical services.
- June 2026: The renewed Siirto service became available for OP Financial Group customers starting June 3, 2026. Wider availability of a domestic instant-payment option supports A2A adoption and gives merchants and PSPs another rail alongside international card schemes.
- December 2024: The European Central Bank issued its second digital-euro progress report, including updates to the rulebook work and shortlisted component vendors. This provided Finnish banks and PSPs early technical and governance signals for CBDC readiness and wallet integration planning.
Research Methodology Framework and Report Scope
Market Definition and Coverage
For this study, the Finland payments market is measured as the value of electronic payment transactions processed in Finland across in-store and online use, covering consumer and business flows where money moves through cards, account-to-account rails, and digital wallets.
Scope exclusions: We exclude crypto-only transfers, inter-bank treasury movements, and securities settlement activity from the market totals.
Segmentation Overview
- By Mode of Payment
- Point-of-Sale
- Card (Debit, Credit, Pre-paid)
- Digital Wallets (Apple Pay, Google Pay, Interac Flash)
- Cash
- Other POS (Gift-cards, QR, Wearables)
- Online
- Card (Card-Not-Present)
- Digital Wallet and Account-to-Account (Interac e-Transfer, PayPal)
- Other Online (COD, BNPL, Bank Transfer)
- Point-of-Sale
- By Interaction Channel
- Point-of-Sale
- E-commerce/M-commerce
- By Transaction Type
- Person-to-Person (P2P)
- Consumer-to-Business (C2B)
- Business-to-Business (B2B)
- Remittances and Cross-border
- By End-user Industry
- Retail
- Entertainment and Digital Content
- Healthcare
- Hospitality and Travel
- Government and Utilities
- Other End-user Industries
Data Sources, Market Sizing, and Validation
Desk Research
We started by mapping how payments are used in Finland and what is measurable in public data, then aligned those inputs to the market boundary used in the model. Desk research focused on trusted statistical releases and regulatory publications that can anchor transaction trends and adoption, such as payment instrument usage and the shift from cash to electronic methods.
Key inputs were taken from sources such as the Bank of Finland and ECB statistical series on payments, Statistics Finland for macro and household indicators tied to consumption, and European Commission and national authorities for policy and compliance signals. We also used open research from organizations like BIS on payment rails. In parallel, we referenced company filings, investor presentations, and reputable business press to understand product launches and changes in merchant acceptance at POS. A paid subscription was used for company financials and news screening, and we used a patent database to cross-check innovation intensity. These sources are not exhaustive, and additional public and paid references were used to compile inputs, validate assumptions, and clarify open questions during the work.
Primary Interviews and Surveys
Primary work was used to pressure-test the desk view and fill gaps where public data is not granular enough, such as how wallet usage is counted at checkout and how instant transfer rails are used in day-to-day commerce. We spoke with a mix of payment ecosystem participants, including banks, merchants, processors, fintech enablers, and large billers, and the discussions were weighted toward Finland while still checking cross-border payment behavior that affects local merchants.
Distribution of primary research fieldwork respondents
| Company type | Respondent position |
|---|---|
| Top tier: 37% | CXOs: 13% |
| Mid tier: 49% | Functional/Unit leaders: 35% |
| Smaller Players: 14% | Managers: 52% |
Market-Sizing & Forecasting
We built the market size using a top-down and bottom-up approach. The starting point was payment instrument totals and channel splits that can be reconstructed from central bank and regulator series, then adjusted to match the study scope for Finland. Where reporting breaks existed, we used bridging factors based on consistent historical ratios, and only after those steps did we finalize the full market total.
The model uses practical inputs with a direct linkage to payment activity, including card and account-to-account transaction values, e-commerce and m-commerce penetration, contactless usage trends, cross-border card-not-present intensity, and shifts in merchant acceptance at POS. We then applied a second layer of checks using sampled price and volume logic, for example illustrative ASP by transaction band times transaction counts, along with channel checks with ecosystem participants. This helped correct gaps where a payment method is reported under a broader category. For forecasting, we relied on scenario analysis supported by expert consensus on drivers such as consumption outlook, digital checkout adoption, and instant payment rail usage, and translated those scenarios into yearly market values with consistent conversion and timing assumptions.
Data Validation & Update Cycle
We validated the outputs through multiple comparison steps, including checks against independent signals such as macro consumption direction, reported electronic payment growth rates, and observed shifts between in-store and online payments. When an unusual jump or drop appeared, we revisited the underlying driver assumptions, re-checked unit consistency, and re-contacted relevant interviewees to determine whether it was a one-off event or a structural change.
Before sign-off, the full workbook is reviewed by another analyst for logic, arithmetic, and scope alignment. A final pass then focuses on year-to-year continuity and currency treatment. Reports are refreshed annually, and interim updates are made when material events occur, including major regulatory changes or rapid shifts in payment rail adoption. Right before delivery, we run a current check so clients receive the latest view available at that time.
Mordor Intelligence's Finland Payments Market Sizing Compared With Other Published Estimates
Published numbers for Finland payments can differ because authors may be sizing different scopes, for example total transaction value versus only card spending. They also vary in how they treat domestic versus cross-border activity. Another recurring source of spread is the year selected, the currency conversion timing, and whether online bank checkout and instant transfers are included.
The table shows a wide range mainly because some estimates focus on card payments only, or they use a broader definition that is not clearly tied to a consistent transaction-value boundary across rails and channels. The reference year matters as well, since card usage growth and e-commerce share can change quickly, and older assumptions can remain in circulation if a model is not refreshed after major shifts in contactless, wallets, or instant transfers.
Benchmark comparison
| Source | Market Size | Gaps in Research Methodology |
|---|---|---|
| Mordor Intelligence | USD 32.75 B (2025) | |
| Trade Journal A | USD 78.00 B (2024) | This figure is for card payment transaction value, so it excludes non-card account-to-account flows and may count cross-border card activity differently than an all-rails payments definition. |
| Global Research Firm B | USD 76.00 B (2024) | The estimate appears to use a wider payment-method list without a clear rule for separating transaction value from related revenues, and the base-year alignment and conversion timing are not consistently stated. |
The table points to scope as the main driver of variance, and in Mordor Intelligence's model the total is constructed as electronic transaction value across cards, wallets, and bank-linked transfer rails, with crypto-only transfers and inter-bank treasury flows kept out. With those rules stated upfront, the number is easier to reconcile against observable payment statistics and to re-run when assumptions change.
Key Questions Answered in the Report
What is the projected growth rate for Finland payments market between 2026 and 2031?
The market is expected to rise at an 8.62% CAGR, increasing from USD 35.57 billion in 2026 to USD 53.79 billion by 2031.
Which payment mode is growing fastest in Finland?
Digital Wallet and A2A payments in online channels are on track for a 13.02% CAGR through 2031, outpacing card expansion.
How significant is Nordic wallet interoperability for Finnish merchants?
The MobilePay–Vipps merger grants access to 27 million regional users and can cut cross-border processing costs by up to 20%.
What share of transactions still use cash in Finland?
Cash usage has declined sharply but remains higher in rural areas, averaging 25–30% of payments in some regions.
Why is ISO 20022 important for Finnish businesses?
The new message standard embeds rich remittance data enabling automated reconciliation and faster cash-flow forecasting for corporate payers.
Which industry vertical is projected to grow fastest in payment volume?
Entertainment & Digital Content is forecast to advance at a 12.74% CAGR as subscription and in-game payments spread.