
Market Overview
| Study Period | 2020 - 2031 |
|---|---|
| Forecast Data Period | 2026 - 2031 |
| Base Year Market Size (2025) | USD 2.65 Billion |
| Market Size (2026) | USD 2.74 Billion |
| Market Size (2031) | USD 3.27 Billion |
| Growth Rate (2026 - 2031) | 3.57 % |
| Market Concentration | Medium |
Major Players *Disclaimer: Major Players sorted in no particular order Image © Mordor Intelligence. Reuse requires attribution under CC BY 4.0. | |
Finland Facility Management Market Analysis by Mordor Intelligence
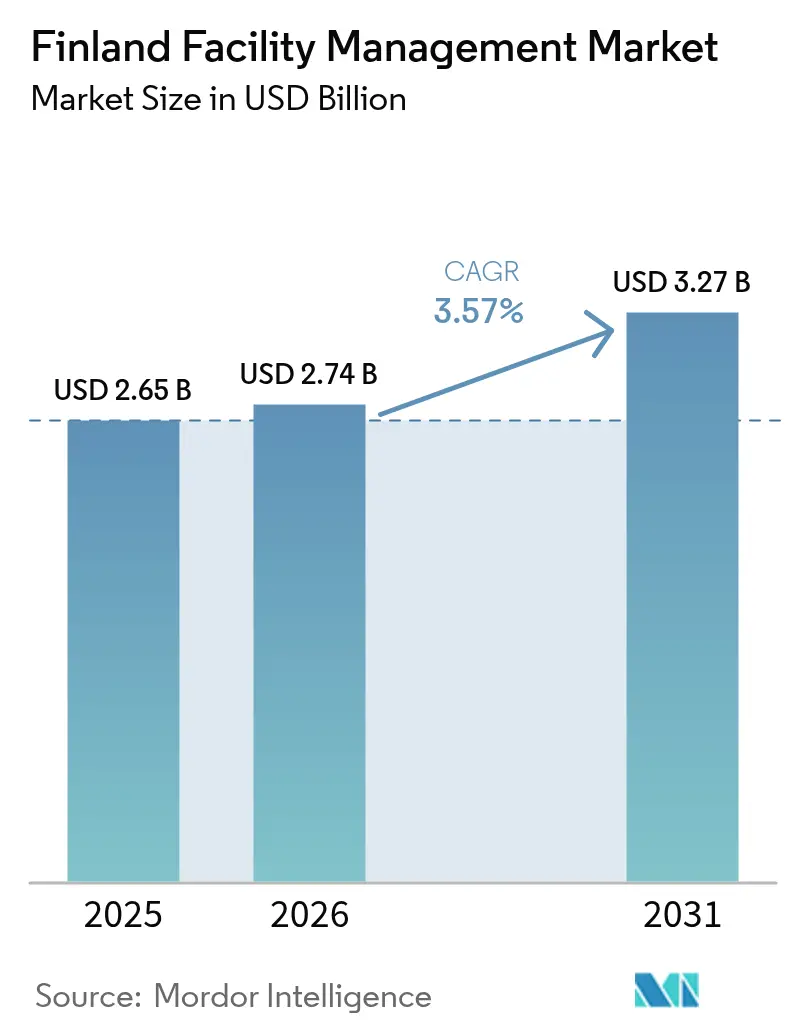
The Finland facility management market size is expected to grow from USD 2.65 billion in 2025 to USD 2.74 billion in 2026 and is forecast to reach USD 3.27 billion by 2031 at 3.57% CAGR over 2026-2031. Growth rests on mandatory EU-taxonomy retrofits, accelerating smart-building adoption, and enterprises’ shift toward core-business focus. Aging infrastructure sustains demand for intensive mechanical, electrical, and plumbing upgrades, while 2035 carbon-neutrality goals bolster energy-efficiency services. Tight labor markets raise service pricing but also motivate automation investments and outcome-based contracts. Technology integration yields measurable owner returns, with documented smart-building projects delivering energy savings exceeding 10% and asset-value uplifts above EUR 10 million (USD 11.61 million).[1] Competition remains moderate as Nordic leaders scale via mergers to offset wage inflation and digital-platform costs.
Key Report Takeaways
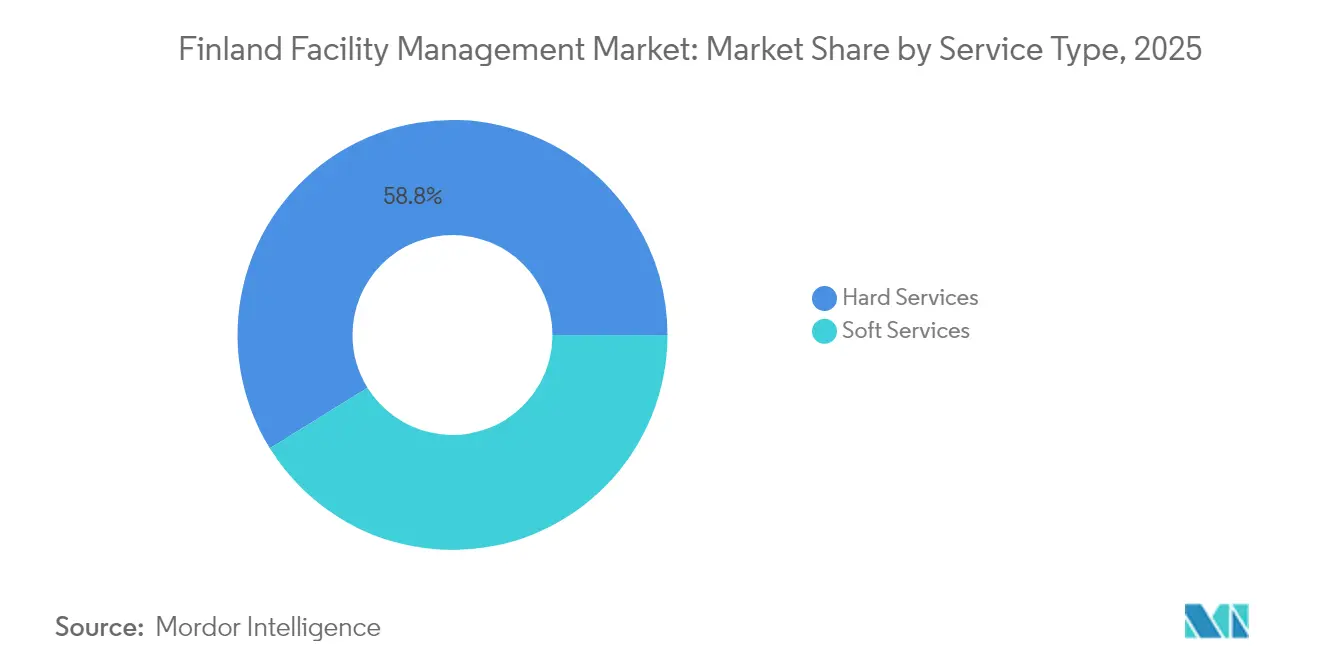
- By service type, hard services controlled 58.84% of the Finland facility management market share in 2025; soft services are forecast to expand at a 4.05% CAGR through 2031.
- By offering type, outsourced delivery accounted for 65.32% revenue share in 2025; integrated outsourcing solutions are projected to advance at 4.88% CAGR to 2031.
- By end-user industry, commercial facilities held 37.68% share of the Finland facility management market size in 2025; institutional and public infrastructure is growing fastest at 7.16% CAGR through 2031.
Note: Market size and forecast figures in this report are generated using Mordor Intelligence’s proprietary estimation framework, updated with the latest available data and insights as of 2026.
Finland Facility Management Market Trends and Insights
Drivers Impact Analysis*
| Driver | (~) % Impact on CAGR Forecast | Geographic Relevance | Impact Timeline |
|---|---|---|---|
| Current occupancy rates | +0.8% | Helsinki metropolitan area, Tampere, Turku | Short term (≤ 2 years) |
| Profitability of major providers | +0.6% | National, concentrated in urban centers | Medium term (2-4 years) |
| Labor-participation trends | +0.4% | National, acute in Western Finland | Long term (≥ 4 years) |
| Urbanisation in metro areas | +0.7% | Helsinki, Tampere, Turku, Oulu | Medium term (2-4 years) |
| Adaptive reuse of aging industrial spaces | +0.5% | Helsinki, Tampere industrial districts | Long term (≥ 4 years) |
| EU taxonomy–aligned green financing | +0.9% | National, emphasis on public sector | Medium term (2-4 years) |
| Source: Mordor Intelligence | |||
Current Occupancy Rates
Premium office districts in Helsinki sustain high utilization even as hybrid work spreads, whereas suburban parks contend with structural vacancies that downshift maintenance intensity needs. This divergence pushes bundled contracts toward experience-centric services in prime zones and cost-optimization packages in secondary assets. At Sello Shopping Center, smart-building retrofits cut energy demand 40% while supporting 21 million annual visitors, underscoring how facility data analytics fine-tune service levels without eroding user comfort. Segmenting offerings by occupancy dynamics enables providers to protect margins in high-touch accounts while preserving competitiveness in price-sensitive portfolios.
Profitability of Major Providers
Escalating wages and cautious client budgeting squeeze operating margins. Coor’s Q4 2024 Nordic revenue hit SEK 3,192 million (USD 327.43 million) yet organic growth slipped 3%, producing a 3.3% margin.[2] Providers pivot toward integrated, outcome-based contracts that reward measurable performance, notably in healthcare, where downtime directly affects patient safety. Sodexo’s 1.7% global FM growth shows that pivot paying off, with healthcare upsides offsetting commodity-service softness. High-margin digital energy management, wellness programs, and compliance reporting now feature prominently in tenders, cushioning profitability as commodity cleaning rates tighten.
Labor-Participation Trends
Employment of 20-64-year-olds slipped to 75.8% in January 2025 and unemployment touched 9.5%, yet technical FM vacancies remain unfilled.[3] Skill mismatches push average service wages up 3.6%. Western Finland faces the steepest gaps, forcing providers to offer location premiums and cross-train recruits. Long-term unemployment of 106,000 highlights retraining needs, prompting industry-backed vocational programs in HVAC automation and low-carbon retrofits. Robotics for floor care and AI condition monitoring increasingly substitute labor, tempering cost escalation without sacrificing service quality.
EU Taxonomy–Aligned Green Financing
Financing availability reshapes the Finland facility management market. MuniFin allocated EUR 4.8 billion to green projects in 2024, 63% of its housing book. Kesko’s EUR 300 million green note illustrates corporate appetite for taxonomy-qualified upgrades. Lifecycle carbon metrics now inform tender scoring, favoring providers with certified energy-management systems. Energy-performance contracts convert capex retrofits into service revenues, lifting margins while aligning with national net-zero targets.
Restraints Impact Analysis*
| Restraint | (~) % Impact on CAGR Forecast | Geographic Relevance | Impact Timeline |
|---|---|---|---|
| Regulatory and legislative hurdles | -0.6% | National, acute in construction permits | Short term (≤ 2 years) |
| Macroeconomic headwinds | -0.8% | National, concentrated in discretionary spending | Short term (≤ 2 years) |
| Shortage of skilled FM labor and rising wage costs | -0.7% | National, severe in Western Finland | Medium term (2-4 years) |
| Cybersecurity liabilities from connected building systems | -0.4% | Urban centers with smart building adoption | Long term (≥ 4 years) |
| Source: Mordor Intelligence | |||
Shortage of Skilled FM Labor and Rising Wage Costs
Scarcity of certified technicians inflates payrolls and jeopardizes service quality. Construction downturns displaced workers lacking IoT or predictive-maintenance competencies, amplifying the gap. Wage premiums have already expanded FM salary bands by 3.6%. Providers respond with automation—robotic cleaners now cover up to 1,800 m² per hour—and international recruitment. A leading case is Caverion’s apprenticeship alliance with Tampere University of Applied Sciences, which halves technician onboarding time and embeds digital-retrofit competencies.
Cybersecurity Liabilities from Connected Building Systems
The Vastaamo patient data breach exposed vulnerabilities in networked controls, heightening liability fears. Smart-building rollouts promise 36.8 kW average power savings, yet each new sensor expands the attack surface. Insurance premiums for connected facilities climbed 12% in 2025, and tender documents now mandate ISO 27001 compliance. Smaller providers lacking cyber resources risk exclusion from high-value digital-FM contracts, capping overall market upside until robust security standards diffuse industry-wide.
*Our forecasts treat driver/restraint impacts as directional, not additive. The impact forecasts reflect baseline growth, mix effects, and variable interactions.
Segment Analysis
By Service Type: Hard Services Dominate Retrofit Momentum
Hard services retained 58.84% of Finland facility management market share in 2025, driven by mandatory MEP upgrades to reach 2035 neutrality goals. Predictive HVAC analytics optimize asset life and cut downtime, translating into 8-10% annual maintenance cost savings for property owners. A 2024 case study at Hospital Nova illustrates hard-service impact: integrating AI motor monitoring reduced unplanned chiller outages by 90% and saved EUR 2.1 million (USD 2.44 million) in replacement parts, shielding operating budgets during raw-material price volatility. Steel and copper price increases of 14% in 2024 pressured CAPEX, but long-term energy savings sustained retrofit ROI, bolstering demand for hard-service expertise.
Soft services, while smaller, are on a 4.05% CAGR path as hybrid work drives flexible security, cleaning, and hospitality solutions. Robotics and biodegradable cleaning chemicals mitigate wage and material-cost spikes. For example, Sodexo deployed autonomous UV disinfection robots that trim chemical usage 40% and enhance infection control in Mehiläinen clinics. Such innovation supports premium pricing and employee-wellness differentiation, maintaining the segment’s upward slope within the Finland facility management market.

By Offering Type: Outsourcing Captures Complexity Premium
Outsourced contracts represented 65.32% of the Finland facility management market size in 2025 and are expanding at 4.88% CAGR. Demand stems from rising regulatory complexity and the need for specialist digital platforms. Coor’s renewal with PostNord, worth SEK 155 million (USD 15.90 million) annually, consolidates mail centers, logistics hubs, and offices under one SLA, cutting client coordination costs 11% while ensuring compliance across 77 performance metrics. Outsourcing also blunts wage-inflation risk by shifting head-count fluctuations to service partners.
In-house FM still covers 34.68% of spend, mainly in mission-critical industrial sites that value direct control. Yet technology requirements erode the in-house model. Valmet’s 2025 restructuring targets EUR 80 million (USD 92.94 million) annual savings partly by moving non-core maintenance to integrated FM suppliers. Over the forecast horizon, bundled outsourcing will widen its lead as clients prioritize variable-cost structures and cradle-to-grave accountability.
By End-user Industry: Institutional Surge Rewrites Growth Map
Commercial real estate contributed 37.68% to the Finland facility management market in 2025, anchored by Helsinki’s prime offices and high-street retail. E-commerce logistics hubs dampen retail footfall, yet smart-warehouse retrofits preserve margins by trimming energy bills 14% despite diesel-price spikes. IT and telecom facilities demand Tier III uptime, enabling premium FM rates up to 35% above standard commercial contracts.
Institutional and public infrastructure posted the highest 7.16% CAGR, propelled by the hospital pipeline and municipal modernization. Hospital Nova’s “Hot Hospital” model bundles acute services around imaging suites, necessitating 24/7 MEP resilience and just-in-time sterile-supply logistics. Rising stainless-steel prices inflated construction outlays by 9%, but FM-enabled energy savings of 22% neutralize lifecycle cost spikes, proving the economic case for advanced institutional FM solutions within the Finland facility management market.
Geography Analysis
Helsinki metropolitan area generated around 44.62% of national FM revenues in 2025 thanks to headquarters clustering, transit investments, and Pasila’s redevelopment that elevated Class-A office rents 7%. The Finland facility management market share in the capital region aligns with high service-quality expectations and early adoption of AI predictive analytics, supporting vendor margins above the national average. Tampere and Turku jointly hold 25.34% share, underpinned by university expansions and tech-industry spillovers. Their 4.42% forecast CAGR outpaces the national rate, driven by new life-science campuses requiring GMP-compliant FM protocols.
Northern and Eastern Finland deliver 20.12% of value through industrial and healthcare facilities spread across large geographies. Remote monitoring reduces truck rolls by 15%, offsetting fuel-price volatility. Mining site FM—where hourly downtime exceeds USD 17,000—prioritizes predictive maintenance and rapid spare-parts logistics via drone deliveries tested in 2025 under a VTT-coordinated pilot. Western Finland, accounting for 9.92% of revenues, wrestles with the deepest labor shortages, pushing baseline service wages 4% above the national mean. Providers compensate through robotic cleaning fleets and mobile-first workforce apps that raise technician productivity 18%.
Regional FM demand now tracks sustainability investment flows more than traditional industrial clusters. The state’s EUR 294 billion (USD 341.5 billion) green-transition program funds public-building retrofits nationwide, widening geographic opportunity pools. Coastal municipalities allocate resilience budgets for flood-mitigation retrofits, creating niche FM demand in seawall pump maintenance and salt-air corrosion control—specialties that command premium rates.
Regulatory Landscape
Finland facility management providers operate under building safety, accessibility, and energy-efficiency requirements set through the National Building Code of Finland under the Ministry of the Environment, which directly influences maintenance regimes, retrofit documentation, and contractor responsibilities across commercial and public portfolios. A major near-term compliance anchor is the Construction Act (2025), which tightens competency and qualification requirements for building designers and site managers; in April 2026, the Ministry of the Environment extended the validity of 2020-2024 qualifications until 2030, reducing disruption risk for active retrofit and modernization programs while keeping formal certification expectations in place.
Digitalization and security-oriented regulation is also shaping connected-building operations. The EU AI Act began applying in Finland on 2 August 2025, with Traficom positioned as the single point of contact for AI coordination, which raises governance expectations for FM workflows that use AI for diagnostics, predictive maintenance, or portfolio optimization. In parallel, national policy work such as the TUUTTI project (communication network policy framework through 2037) and related security priorities reinforces the need for resilient, well-governed data connectivity in smart facilities, especially where FM contracts bundle building systems, networks, and cybersecurity controls.
Value Chain Analysis
The Finland facility management value chain spans asset owners and occupiers (public sector, commercial real estate, healthcare, industry), FM prime contractors (single, bundled, or integrated FM), and a dense layer of subcontractors and specialist vendors covering MEP/HVAC, fire and safety, cleaning, security, waste, and building automation. Technology and data have become a central connective layer: CMMS/ERP and integration platforms link work orders, field workforce scheduling, procurement, compliance reporting, and performance dashboards used in outcome-based contracts.
Upstream and adjacent construction supply chain digitization is increasingly feeding FM readiness through asset data continuity. Rakennusteollisuus RT started a Pasila pilot in September 2024 to digitize the concrete element supply chain using RFID tags and cloud services for real-time tracking, while broader efforts such as the BETK project promote open standards (IFC for BIM and Peppol for e-procurement/logistics data exchange) that help FM teams inherit structured asset information. On the service-delivery side, ISS Palvelut Oy modernized operations in January 2025 by integrating a custom ERP with the Frends iPaaS platform, illustrating how leading providers are investing in scalable automation and analytics to reduce manual handoffs and improve responsiveness across multi-site accounts.
Competitive Landscape
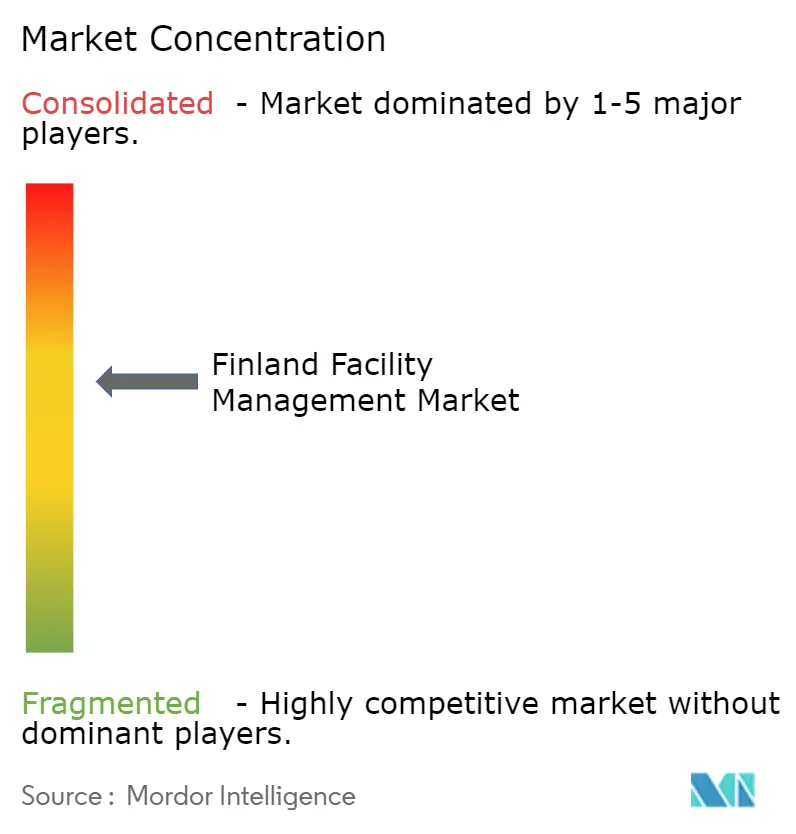
Market concentration remains moderate. Coor, Caverion, and Lassila & Tikanoja collectively capture an estimated 38% of Finland facility management market share, leveraging integrated portfolios and deep client relationships. The Caverion–Assemblin merger will create a Nordic giant with USD 5.2 billion combined turnover and broadened smart-building capabilities. Lassila & Tikanoja differentiates through circular-economy waste programs, while Lindström monetizes textile-service digitalization via RFID-tagged workwear that optimizes laundering cycles.
Technology investment shapes competitive edges. KONE applies AI to elevator sensor data, predicting 60% of failures before downtime and reducing technician dispatches by 15%. Smaller regionals survive through vertical specialization-such as Fidelix’s building-automation retrofits-often becoming acquisition targets for scale-seeking nationals. White-space opportunities persist in cybersecurity-centric FM offerings, with only 12% of tenders currently bundling IT security clauses despite growing liability exposures.
Finland Facility Management Industry Leaders
-
Lindstrom Group
-
PHM Group
-
Coor Group
-
Four FM
-
Palmia Ltd
- *Disclaimer: Major Players sorted in no particular order
Market Opportunities and Future Outlook
A clear opportunity area sits at the intersection of energy efficiency, data-driven operations, and compliance reporting, where Finnish programs and deployments are moving from isolated pilots to repeatable toolchains. The Saving Energy with Data in Real Estate and Property Management Services project (initiated by TIEKE in June 2025 and running to September 2027) provides an institutional channel for digital energy-efficiency tools that FM providers can operationalize within outsourced and integrated contracts. Concrete performance proof points from smart-building retrofits, such as documented projects delivering energy savings exceeding 10% and asset-value uplifts above EUR 10 million, support the commercial case for providers that can package measurement, verification, and ongoing optimization as managed services.
Automation and AI-enabled diagnostics present additional whitespace, particularly in portfolios constrained by technician shortages and rising wage costs. In May 2026, Enviable launched an AI diagnostics and building-data telemetry service for office buildings to support partially autonomous management, while Tampere University started the Business Finland-funded AI Champion project in June 2026 to develop AI agents that lift productivity in supply chain and building services engineering (through June 2028). Mission-critical facilities also broaden the addressable scope for technical FM, evidenced by Caverion starting technical works in April 2026 on a 2 MW data center project for Aalto University in Otaniemi, where uptime, energy management, and governed change control raise the value of integrated hard services and secure digital operations.
Recent Industry Developments
- April 2026: Caverion started technical works on a 2 MW data center project for Aalto University in Otaniemi, advancing uptime, energy management, and secure digital operations in institutional facilities.
- May 2026: Lindstrom Group signed a ten-year lease extension with Castellum for its headquarters in Rantatie Business Park, Helsinki, with planned renovations to accommodate around 400 employees, signaling continued investment in operational capability and client engagement for its facility services portfolio.
- September 2024: Rakennusteollisuus RT started a Pasila pilot to digitize the concrete element supply chain using RFID tags and cloud services for real-time tracking, enabling asset data continuity and informing FM readiness for multi-site deployments.
Research Methodology Framework and Report Scope
Market Definition and Coverage
For this report, the Finland facility management market is defined as the value of contracted and in-house services used to operate, maintain, and support buildings and sites across Finland, including both technical upkeep and day to day workplace services.
Scope exclusions: This sizing does not count one-off construction projects and major capital expansions that sit outside routine operations and maintenance budgets.
Segmentation Overview
- By Service Type
- Hard Services
- Asset Management
- MEP and HVAC Services
- Fire Systems and Safety
- Other Hard FM Services
- Soft Services
- Office Support and Security
- Cleaning Services
- Catering Services
- Other Soft FM Services
- Hard Services
- By Offering Type
- In-house
- Outsourced
- Single FM
- Bundled FM
- Integrated FM
- By End-user Industry
- Commercial (IT and Telecom, Retail and Warehouses, etc.)
- Hospitality (Hotels, Eateries, Large-scale Restaurants)
- Institutional and Public Infrastructure (Govt, Education, Transportation)
- Healthcare (Public and Private Facilities)
- Industrial and Process (Manufacturing, Energy, Mining)
- Other End-user Industries (Multi-housing, Entertainment, Sports and Leisure)
Data Sources, Market Sizing, and Validation
Desk Research
Desk research started with public building, energy, and labor indicators that shape service demand and pricing in Finland. We mainly reviewed sources such as Statistics Finland for construction, employment, and cost time series, along with Eurostat for comparable building and services indicators that help sanity check local trends.
To add operating context, we also referenced publications and datasets from the Finnish Environment Institute, the European Commission (including energy and renovation related materials), and relevant Finnish public procurement portals for tender language and typical service scopes. Company annual reports, investor decks, and credible press coverage were used to understand outsourcing appetite, bundled contract structures, and margin signals. Where needed, our analysts also used paid databases for company financials, news and financials, and patent databases to validate technology adoption themes. The sources listed above are illustrative, and many other public and secondary references were used to collect data, validate assumptions, and resolve open questions.
Primary Interviews and Surveys
Primary work was used to test which services are commonly bundled, how pricing is being revised (particularly for labor and energy linked clauses), and how demand differs between public facilities, commercial properties, and industrial sites. We spoke with a mix of service providers, subcontractors, and large buyers of FM services across Finland to confirm contract lengths, outsourcing triggers, and the split between hard and soft work that shows up in real budgets.
Distribution of primary research fieldwork respondents
| Company type | Respondent position |
|---|---|
| Top tier: 31% | CXOs: 13% |
| Mid tier: 49% | Functional/Unit leaders: 38% |
| Smaller Players: 20% | Managers: 49% |
Market-Sizing & Forecasting
The core model uses top-down and bottom-up logic, where we first reconstruct an addressable FM spend pool from Finland's active building stock and serviceable area by major property groups, and then convert it using outsourcing penetration, typical service scope per site, and observed cost levels. After that, the totals are corroborated using selective bottom-up checks from supplier revenue benchmarks, sampled contract values from public tenders, and ASP times volume checks for recurring tasks, and then adjusted when the two views drift beyond a reasonable band.
A few inputs that mattered most in Finland were the pace of renovation and energy-efficiency upgrades, labor cost movement in cleaning and technical trades, the mix shift toward integrated and bundled contracts, public sector outsourcing behavior, and property utilization signals that influence soft service frequency. When data was missing for smaller facility types, we used clearly stated proxies (nearest comparable building class, or average service intensity from interview feedback) and then re-tested the output against known cost ratios.
For forecasting, we leaned on scenario analysis anchored to macro and sector indicators that practitioners treat as decision drivers, and then used light time series smoothing on stable sub-areas so the forecast does not overreact to one-year spikes. The final growth path was reviewed with interviewees so assumptions stayed realistic for Finland's staffing constraints and customer budgeting cycles.
Data Validation & Update Cycle
Model outputs were checked against independent signals such as outsourcing announcements, tender volumes, and direction of unit costs before being finalized. Large jumps were flagged, traced back to the driver that caused them, and either corrected or explained with supporting evidence, and then the full file is reviewed in more than one analyst pass before sign-off.
The report is refreshed on an annual cycle, and interim edits are made when a material event changes demand, pricing, or service scope assumptions. Before delivery, we run a last-mile update pass so clients receive the latest view supported by newly available public data and any fresh confirmations from industry contacts.
Mordor Intelligence's Finland Facility Management Market Size Versus Other Published Estimates
Published market values for facility management in Finland can look far apart because firms do not always count the same services, and they also vary in whether they treat in-house delivery and integrated contracts as part of the same spend pool. Timing choices also matter, since some figures are quoted in a different base year and then carried forward using broad growth rates.
Tender award patterns in Finland, recurring service scope language visible in contracts, and revenue signals from local operators are the checks that keep Mordor Intelligence tied to recurring hard and soft FM work, with major construction-style projects and capital expansions excluded from the market total.
Benchmark comparison
| Source | Market Size | Gaps in Research Methodology |
|---|---|---|
| Mordor Intelligence | USD 2.65 B (2025) | |
| Trade Journal A | USD 4.51 B (2024) | This figure appears to use a broader services scope that can blend general building services into FM, and it is presented for an earlier year without a clearly stated normalization for contract scope and inflation pass-through. |
| Regional Consultancy B | USD 14.77 B (2026) | This number likely includes wider real estate and business support spend, or counts adjacent service categories that are not part of routine FM budgets, which inflates totals when summed at country level. |
Across the three numbers, the spread is mainly explained by what gets counted as FM and how spending is assigned when contracts are bundled. By tying the market back to observable contract scope, recurring service intensity, and practical price and penetration assumptions, we keep the final value traceable and repeatable over time.
Key Questions Answered in the Report
What is the current size of the Finland facility management market?
The Finland facility management market size is USD 2.74 billion in 2026.
How fast will the market grow through 2031?
The sector is forecast to expand at a 3.57% CAGR, reaching USD 3.27 billion by 2031.
Which segment is expanding the fastest?
Institutional and public infrastructure FM services are growing at 7.16% CAGR due to new hospital projects and municipal retrofits.
Why are outsourced contracts gaining share?
Outsourcing offers compliance expertise and spreads wage-inflation risk, driving its share to 65.32% in 2025 with a 4.88% CAGR outlook.
What is the main challenge for providers?
A shortage of skilled technicians coupled with rising wage costs is squeezing margins and driving automation investments.
How are sustainability regulations influencing the market?
EU-taxonomy rules are channeling billions of euros into green retrofits, boosting demand for energy-performance contracting and certified FM services.