
Market Overview
| Study Period | 2020 - 2031 |
|---|---|
| Forecast Data Period | 2026 - 2031 |
| Base Year Market Size (2025) | USD 7.71 Billion |
| Market Size (2026) | USD 8.18 Billion |
| Market Size (2031) | USD 10.99 Billion |
| Growth Rate (2026 - 2031) | 6.12 % |
| Market Concentration | Medium |
Major Players *Disclaimer: Major Players sorted in no particular order Image © Mordor Intelligence. Reuse requires attribution under CC BY 4.0. | |
Finland E-commerce Market Analysis by Mordor Intelligence
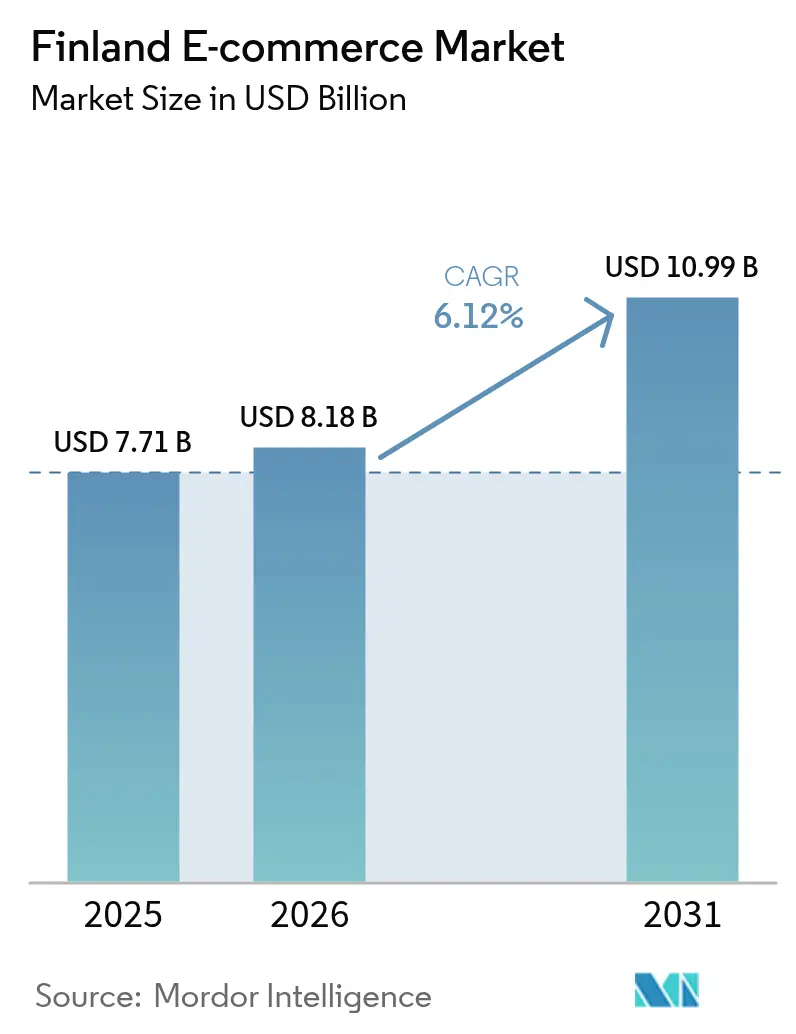
Finland e-commerce market size in 2026 is estimated at USD 8.18 billion, growing from 2025 value of USD 7.71 billion with 2031 projections showing USD 10.99 billion, growing at 6.12% CAGR over 2026-2031. Strong digital infrastructure, high card penetration, and a EUR 10 million (USD 10.9 million) public-sector AI program are reinforcing consumer confidence in online transactions.[1]Government of Finland, “AI Integration Budget Announcement,” govinsider.asia MobilePay and similar apps are normalizing instant payments, while automated parcel lockers remove logistics friction in sparsely populated regions. Cross-border shopping remains influential as 47% of Finns buy from foreign sites to access lower prices and wider assortments.[2]Paytrail, “E-commerce in Finland 2024,” paytrail.com Competitive intensity grows as Zalando acquires ABOUT YOU, while local leader Verkkokauppa.com prioritizes margins over volumes amid subdued consumer sentiment.
Key Report Takeaways
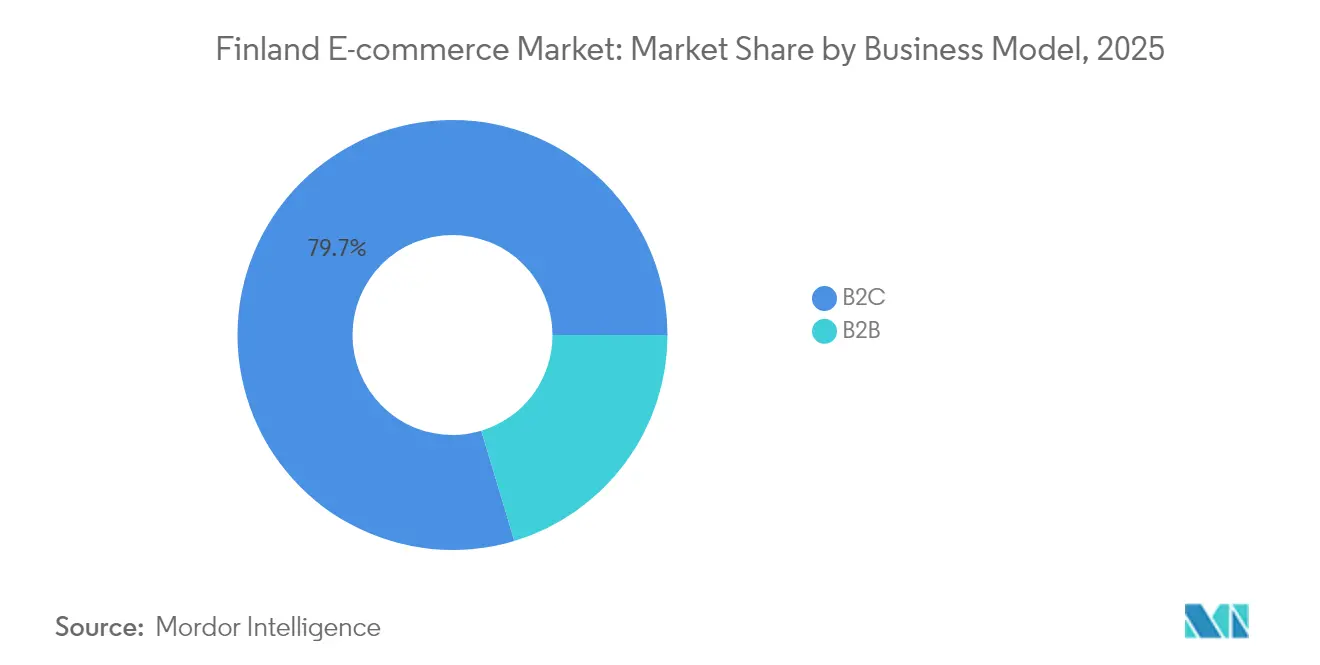
- By business model, B2C transactions led with 79.65% revenue share in 2025; B2B is projected to expand at an 8.12% CAGR through 2031.
- By device type, smartphones captured 68.10% of the Finland e-commerce market share in 2025, while smartphones are advancing at a 7.10% CAGR through 2031.
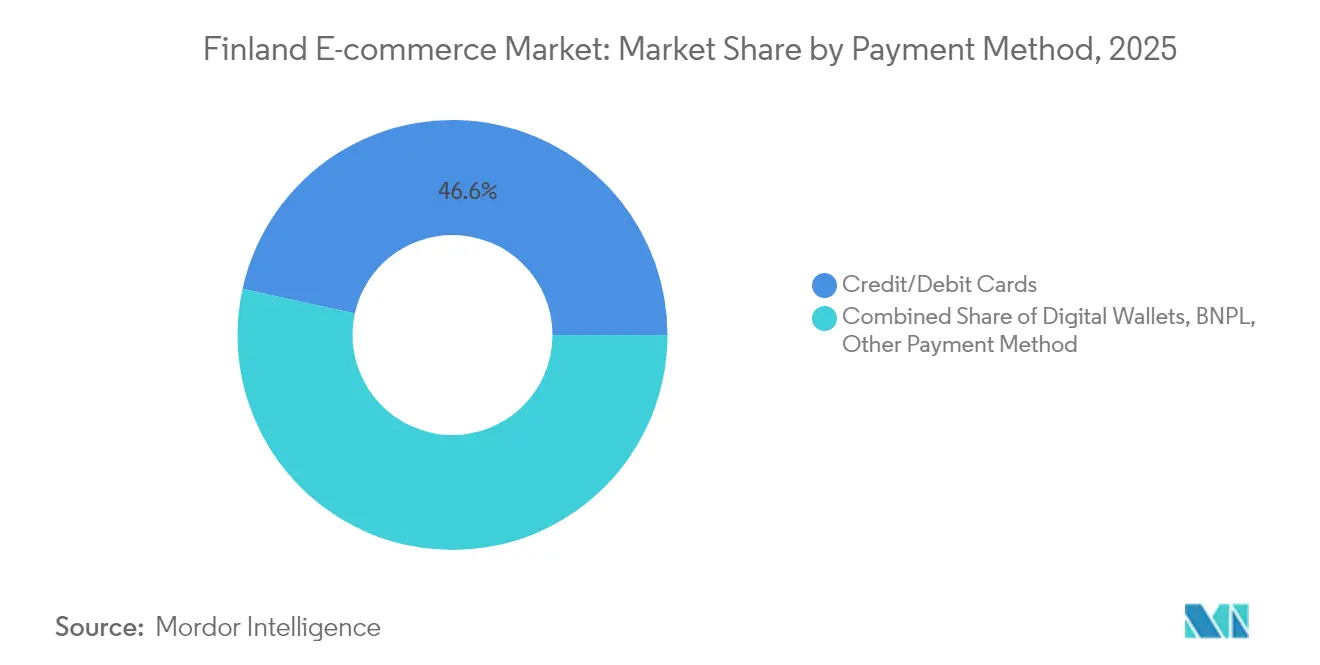
- By payment method, credit and debit cards commanded 46.55% share of the Finland e-commerce market size in 2025; BNPL solutions are growing at a 9.66% CAGR to 2031.
- By B2C product category, fashion & apparel held 24.72% revenue share in 2025; food & beverages is forecast to rise at an 11.25% CAGR through 2031.
Note: Market size and forecast figures in this report are generated using Mordor Intelligence’s proprietary estimation framework, updated with the latest available data and insights as of 2026.
Finland E-commerce Market Trends and Insights
Drivers Impact Analysis*
| Driver | (~) % Impact on CAGR Forecast | Geographic Relevance | Impact Timeline |
|---|---|---|---|
| Widespread Adoption of MobilePay & Other Instant Payment Apps Boosting Conversion Rates | +1.2% | National, with higher penetration in urban areas | Short term (≤ 2 years) |
| Rapid Expansion of Automated Parcel Locker Networks in Sub-Arctic & Rural Regions | +0.8% | National, with focus on rural and sub-Arctic regions | Medium term (2-4 years) |
| Government-Led Digital Public Services Normalising Online Transactions | +0.9% | National | Medium term (2-4 years) |
| Nordic Consumer Preference for Sustainable "Re-commerce" Platforms | +0.7% | National, with spillover to Nordic region | Long term (≥ 4 years) |
| German & Swedish Cross-Border Pure-Plays Increasing SKU Variety | +0.6% | National, with cross-border implications | Medium term (2-4 years) |
| Source: Mordor Intelligence | |||
Widespread Adoption of MobilePay & Other Instant Payment Apps Boosting Conversion Rates
Instant payments now underpin friction-free checkouts, helping merchants cut abandonment and processing fees as online banking still accounts for 55% of preferences but skews older.[3]Stripe, “2024 Nordic Payments Report,” stripe.com The EUR 100 million (USD 109 million) digitalization fund upgrades payment rails and encourages merchant acceptance. This momentum accelerates the Finland e-commerce market beyond card-centric constraints, lifting overall conversion rates and enlarging merchant addressable volumes.
Rapid Expansion of Automated Parcel Locker Networks in Sub-Arctic & Rural Regions
Posti operates nearly 2,000 lockers, ensuring secure, weather-proof pickup even at −20 °C. Unified Nordic locker protocols rolling out in 2025 simplify cross-border fulfilment and cut rural delivery costs. With 90% notification response rates, lockers broaden regional access and unlock incremental demand that previously lacked last-mile reliability.
Government-Led Digital Public Services Normalising Online Transactions
Nation-wide e-ID, bank ID and mobile ID logins make official tasks digital-first, transferring trust to retail platforms and lifting online engagement among seniors and late adopters. Inclusive help desks secure adoption, while a EUR 10 million (USD 10.9 million) AI budget raises user-experience benchmarks that spill into private commerce.
Nordic Consumer Preference for Sustainable “Re-commerce” Platforms
Fifty-seven percent of Finnish shoppers weigh environmental impact, spurring circular services like Emmy-Inrego’s clothing-for-electronics exchange. Verkkokauppa.com’s “Vaihtokauppa” trade-in plus K-Group’s refurbishment pilots embed reuse models, differentiating offerings while capturing value from returned goods.
Restraints Impact Analysis*
| Restraint | (~) % Impact on CAGR Forecast | Geographic Relevance | Impact Timeline |
|---|---|---|---|
| High Return Rates in Fashion Category Driving Reverse-Logistics Costs | -0.6% | National, with higher impact in urban areas | Short term (≤ 2 years) |
| Stringent EU VAT One-Stop-Shop (OSS) Compliance Burden for SMEs | -0.4% | National, with cross-border implications | Medium term (2-4 years) |
| Relatively Small Domestic Addressable Market Limiting Economies of Scale | -0.3% | National | Long term (≥ 4 years) |
| Same-Day Delivery Expectations Escalating Fulfilment Cost Base | -0.5% | Urban areas, with spillover to suburban regions | Short term (≤ 2 years) |
| Source: Mordor Intelligence | |||
High Return Rates in Fashion Category Driving Reverse-Logistics Costs
Returns near 40% hurt margins by elevating inspection, repackaging, and disposal expenses. Retailers deploy AI-based sizing tools, customer-profiling engines, and consolidated pickup programs to curb repeated returns while preserving customer goodwill.
Stringent EU VAT One-Stop-Shop (OSS) Compliance Burden for SMEs
From January 2025, Finnish sellers surpassing EUR 100,000 (USD 109,000) in EU-wide turnover must file detailed cross-border VAT, prompting extra accounting spend and deterring nascent exporters. Software upgrades and tax advisory fees compress SME working capital, slowing their international scaling within the Finland e-commerce market.
*Our forecasts treat driver/restraint impacts as directional, not additive. The impact forecasts reflect baseline growth, mix effects, and variable interactions.
Segment Analysis
By Business Model: B2B Digitization Accelerates Despite B2C Dominance
In 2025, B2C held 79.65% of revenue, underscoring its anchor role in the Finland e-commerce market. However, an 8.12% CAGR positions B2B as the lead growth engine as Finnish enterprises automate procurement via mandatory European e-invoicing standards. Kesko illustrates this pivot: 55% of group sales now stem from direct B2B channels that use AI demand-planning tools to fully align inventory and retailer forecasts.
B2C momentum stabilizes through frictionless payments and dense parcel networks, yet discretionary fashion spend faced softness in 2024 amid inflation worries. B2B adoption accelerates when wholesalers deploy machine-learning models that shrink stock-outs and exposure to price volatility—features that resonate with industrial buyers seeking cost control and resilience.


By Device Type: Mobile Commerce Dominance Reinforces Urban-Rural Digital Divide
Smartphones accounted for 68.10% of transactions in 2025, underpinning the Finland e-commerce market, and continue to grow at a 7.10% CAGR as 5G becomes universal. Desktop use remains prevalent in corporate buying and high-ticket items requiring deeper specification comparisons, while tablets and smart TVs serve niche entertainment transactions.
Verkkokauppa.com saw online sales hit 66% of turnover and a 33% surge in express delivery orders-signals that mobile shoppers expect near-instant fulfilment. Remote regions ride mobile networks to bypass limited fixed broadband; nonetheless, sparse delivery points necessitate locker rollouts and community pickup hubs.
By Payment Method: BNPL Disruption Challenges Traditional Card Dominance
Cards still hold 46.55% share, yet BNPL grows 9.66% CAGR, reflecting consumers’ search for budget flexibility in a high-inflation setting. Digital wallets benefit from biometric authentication and privacy controls prized by Finnish users.
Helsinki-based Starcart, freshly licensed as a payment institution, blends AI price discovery with BNPL options across 200+ stores, signaling how fintech entrants can diversify the Finland e-commerce industry’s payment stack. Card issuers respond with installment add-ons and loyalty accelerators to retain share.
By B2C Product Category: Food & Beverages Growth Outpaces Fashion Leadership
Fashion remains top at 24.72% share but combats high returns and eco scrutiny. Meanwhile, food & beverages is set to scale 11.25% CAGR as urban professionals embrace 15-minute “quick commerce” for groceries and meals. Electronics shrink from 16% to 7% of total retail spend as consumers delay upgrades.
Wolt’s new gifting module widens its basket mix beyond meals, a play at lifestyle positioning that lifts average order values. S-Group’s rollout of electronic shelf labels automates price elasticity tests, balancing margin and demand in both fresh and ambient assortments.
Geography Analysis
Southern urban centers-Helsinki, Espoo, and Vantaa-generate a disproportionate share of the Finland e-commerce market thanks to dense locker networks and ubiquitous same-day delivery. Parcel volumes per capita in Greater Helsinki outstrip national averages as commuters rely on click-and-collect convenience.
Northern and sub-Arctic regions display higher mobile-only engagement since physical retail density is lower. Posti’s 2,000 automated lockers tighten service coverage, mitigating weather-linked disruptions and reducing average rural delivery time by 1.4 days. Locker deployment elevates customer satisfaction scores in Lapland and Kainuu provinces where home delivery can be cost-prohibitive.
Cross-border influences remain strong: 47% of Finnish shoppers transact abroad, mainly with Swedish and German e-tailers offering broader assortments and price advantages. PostNord’s service harmonization cuts cross-Nordic transit times by up to 18 hours and provides a consistent parcel-tracking interface. Adoption of the EU Import One-Stop-Shop grew VAT declarations to EUR 26.3 billion (USD 30.8 billion) in 2023, highlighting Finland’s integration into the wider European e-commerce space.
Regulatory Landscape
Finland e-commerce operates under EU-harmonized digital and consumer rules, with national authorities coordinating supervision across platform conduct, content moderation, and privacy. Under the EU Digital Services Act, oversight is coordinated nationally by Traficom alongside the Consumer Ombudsman and the Data Protection Ombudsman, and potential penalties scale to as much as 6% of global annual turnover for DSA infringements, which raises compliance stakes for marketplaces and cross-border sellers.
Competition and platform-gatekeeper issues are increasingly routed through national touchpoints aligned to EU law. After amendments to the Act on the Finnish Competition and Consumer Authority that entered into force on May 15, 2024, the FCCA serves as Finland's national contact point for EU Digital Markets Act matters. On the transactional side, the Consumer Protection Act (38/1978) governs distance selling obligations such as pre-contract information and the right of withdrawal, and Finland applies EU VAT regimes (including the One-Stop-Shop) that shape cross-border selling processes for merchants and platforms.
Value Chain Analysis
The value chain in Finland e-commerce starts with brands and retailers, including grocery and hardlines, managing assortment, pricing, and digital storefronts. Payments and identity rails enable checkout and authentication, while order capture is increasingly driven by mobile journeys. Back-end operations depend on integrated commerce platforms, ERP and inventory systems, and conversion tools such as search, merchandising, sizing, and returns.
Fulfillment is shifting toward centralized distribution and outsourced warehousing, with automation used to protect service levels in a geographically dispersed market. Logistics providers are central to last-mile performance through home delivery, service points, and automated parcel lockers, with Posti operating as a core operator in parcel networks and contracted fulfillment. Reverse logistics, covering inspection, repackaging, refurbishment, and resale, is gaining importance due to elevated return rates in fashion, linking carriers, 3PLs, and re-commerce programs back into retailer inventory recovery workflows.
Competitive Landscape
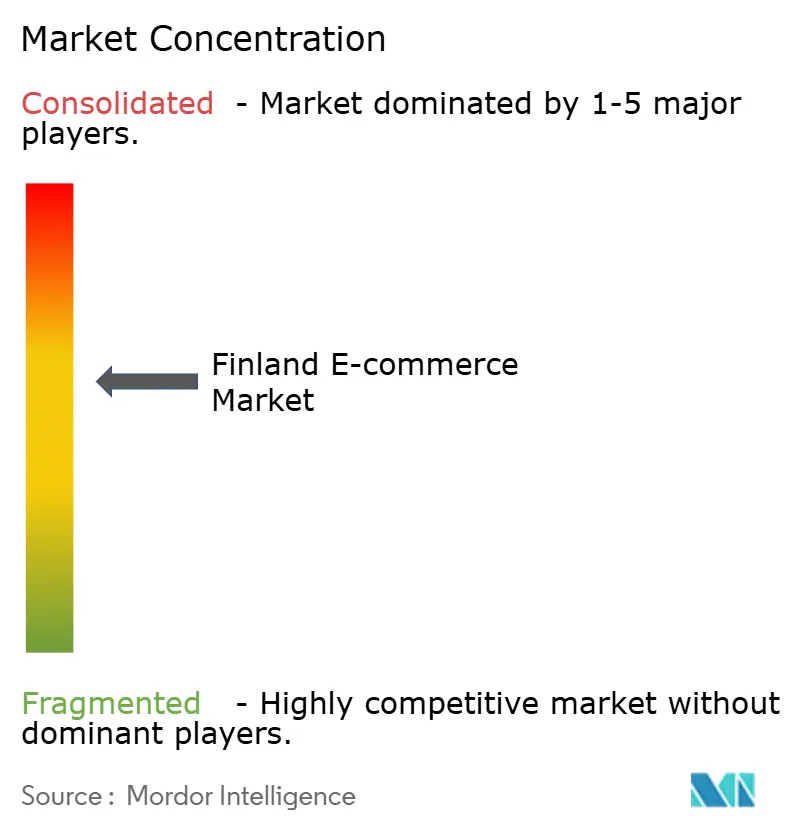
The Finland e-commerce market shows moderate concentration, with Verkkokauppa.com edging peers despite a 7% revenue dip to EUR 467.8 million (USD 510 million) in 2024 because of a rigorous cost-optimization playbook that lifted operating margin. Meanwhile, Zalando’s EUR 6.50 (USD 7.10) per-share bid for ABOUT YOU seeks EUR 100 million (USD 109 million) in synergies, promising faster Nordic deliveries and deeper assortment breadth.
Technology uptake distinguishes winners. Kesko’s predictive analytics shrink food waste, preserving margins, whereas S-Group’s electronic shelf labels automate real-time price changes across 100+ stores. Fintech-powered platforms such as Starcart use AI to curate the cheapest combined basket across multiple retailers, raising customer stickiness and challenging traditional marketplaces.
M&A appetite remains high as domestic players weigh regional scale benefits against the cost of last-mile expansion. Beyond fashion consolidation, niche acquisitions target logistics tech, returns management, and sustainability solutions-areas critical to sustained profitability in the Finland e-commerce market.
Finland E-commerce Industry Leaders
Verkkokauppa.com
Motonet Oy
Zalando SE
Gigantti Oy (Elkjøp)
K-Ruoka (Kesko Oyj)
- *Disclaimer: Major Players sorted in no particular order

Market Opportunities and Future Outlook
Opportunities are forming around compliance-driven digitization and improved transaction data flows, as public-sector and EU-aligned programs push merchants toward standardized electronic documentation. In February 2026, the State Treasury (Valtiokonttori) opened a consultation on the legislative impacts of electronic business documents (such as e-invoices and e-receipts), creating whitespace for software vendors and PSPs that can automate invoicing, reconciliation, and audit trails for SMEs and multi-channel retailers.
Payments, re-commerce, and cross-border enablement also remain practical levers for differentiation. Domestic online purchases were recorded at 5.3% growth in 2025, and Finnish e-commerce revenue was cited at about EUR 5.6 billion in 2025 by the Finnish Commerce Federation. In April 2026, the Central Tax Board issued a preliminary decision (KVL:013/2026, applicable until December 31, 2027) clarifying VAT treatment for bundled payment services, prompting platforms and payment providers to refine product packaging, invoicing logic, and input-VAT recovery models. Trust and onboarding improvements link back to national digital identity infrastructure, with the Digital and Population Data Services Agency (DVV), together with the National Police Board, scheduling the European Digital Identity Wallet app for December 2026, supporting higher-assurance login and age/identity checks for regulated and high-value e-commerce use cases.
Recent Industry Developments
- July 2026: Motonet Oy released a new mobile application that integrates loyalty features, e-commerce, and spare parts search into one interface. The update consolidates customer engagement into a single digital touchpoint and can lift conversion by reducing friction between product discovery, service needs, and checkout across channels.
- June 2026: Verkkokauppa.com refinanced its debt facilities with a new EUR 15 million term loan and a EUR 20 million revolving credit facility, both with three-year maturities. The updated financing structure strengthens liquidity headroom to support fulfillment, assortment investments, and operational upgrades amid competitive pressure.
- May 2026: Zalando launched a partnership with Vestiaire Collective to offer authenticated second-hand luxury items on its platform across 14 markets, including Finland. Adding verified pre-owned inventory expands selection in re-commerce and raises the competitive bar for local and regional fashion e-tailers competing on sustainability and assortment depth.


Research Methodology Framework and Report Scope
Market Definition and Coverage
For this report, the Finland e-commerce market is defined as the value of online purchases made by residents in Finland for physical goods and digitally delivered services, placed via websites or apps and paid for online, with fulfillment done locally or through cross-border shipping.
Scope exclusions: We exclude pure online banking activity, in-game micro-payments, and business-to-government procurement.
Segmentation Overview
- By Business Model
- B2C
- B2B
- By Device Type
- Smartphone / Mobile
- Desktop and Laptop
- Other Device Types
- By Payment Method
- Credit / Debit Cards
- Digital Wallets
- BNPL
- Other Payment Method
- By B2C Product Category
- Beauty and Personal Care
- Consumer Electronics
- Fashion and Apparel
- Food and Beverages
- Furniture and Home
- Toys, DIY and Media
- Other Product Categories
Data Sources, Market Sizing, and Validation
Desk Research
Desk research starts by mapping what is counted as online retail spend in Finland and what is not, and then aligning all inputs to that boundary. Public sources help us anchor internet access, digital purchasing behavior, and the macro context for household spend before we move to market math.
We referred to non-paywalled sources such as Statistics Finland for household consumption and retail indicators, Eurostat for digital economy and population series, and the OECD for comparable consumption and price trends. Trade and cross-border signals were checked using Finnish Customs and EU trade statistics where relevant, and policy and payments context was reviewed using central bank and regulator publications. Company annual reports, investor decks, and reputable business press were used to understand sales mix, category exposure, and promotional intensity, supported by a paid subscription covering company financials and another covering shipment-level trade records for validation checks. This list is illustrative, and many other public and paid sources were also used to collect data, validate assumptions, and clarify gaps.
Primary Interviews and Surveys
Primary work was used to confirm category-level demand patterns, online share shifts, and how cross-border orders are being counted in practice by merchants and logistics partners. We spoke with marketplace operators, multi-category e-retailers, brand-led webstores, payment ecosystem participants, and delivery stakeholders to pressure-test assumptions and to fill gaps where public data is not granular. For Finland, the input was balanced across domestic and cross-border selling models so our conversion rates, return behavior, and average order value logic stayed realistic.
Distribution of primary research fieldwork respondents
| Company type | Respondent position |
|---|---|
| Top tier: 31% | CXOs: 16% |
| Mid tier: 53% | Functional/Unit leaders: 31% |
| Smaller Players: 16% | Managers: 53% |
Market-Sizing & Forecasting
Sizing is built using a top-down and bottom-up blend, where a demand pool is first constructed and then cross-checked with supply-side reality checks. On the top-down side, we reconstructed online retail value by combining household consumption direction with e-commerce adoption indicators, and then narrowing it to what is truly ordered and paid online (including cross-border purchases that ship into Finland).
To keep the model grounded, a few market fingerprints were treated as key inputs, such as internet and smartphone penetration, the share of consumers purchasing online, average order value ranges by major retail groupings, delivery and return intensity (which impacts net value reporting), and the split between domestic and cross-border fulfillment. Primary inputs were used to calibrate how discounting and shipping fees are handled in reported sales, and to set realistic online share progression in categories that move slower.
Forecasting was done using scenario analysis, where macro drivers (income and inflation direction), digital adoption, and logistics capacity constraints were varied within ranges validated through interviews. When bottom-up checkpoints were incomplete, gaps were handled through conservative extrapolation from sampled merchants and category benchmarks, followed by an adjustment step so totals remain consistent with independent macro signals.
Data Validation & Update Cycle
Validation is done through several passes that look for mismatches between the model output and independent signals, such as retail sales direction, online purchase frequency, and cross-border activity indicators. If a variance is found, the drivers are revisited and the assumption is either corrected or explicitly justified, and then the math is re-run so the impact is traceable.
Before sign-off, the work is reviewed by another analyst to check arithmetic, definitions, and whether the final number aligns with the stated scope exclusions. Reports refresh annually, and interim updates are made when material events occur, such as step-changes in consumer spending, shipping costs, taxation rules, or platform policy changes. Right before delivery, we do a quick final scan of key inputs so clients receive an up-to-date view.
Mordor Intelligence's Finland Ecommerce Market Size Measured Against Other Published Estimates
Published values for Finland e-commerce can differ even when the topic name looks identical, because each publisher draws the market boundary differently and not everyone treats cross-border orders, fees, and returns in the same way. Timing choices also matter, since some estimates stick to a prior base year or use a different currency conversion point when reporting USD values.
By tracking fulfillment splits, checking how returns and shipping charges are treated in reported sales, and refreshing cross-border inclusion rules, Mordor Intelligence keeps the number tied to resident online purchases rather than broader digital transaction totals that can inflate the market.
Benchmark comparison
| Source | Market Size | Gaps in Research Methodology |
|---|---|---|
| Mordor Intelligence | USD 7.71 B (2025) | |
| Industry Association A | USD 8.60 B (2025) | May include a wider set of digital transaction value beyond online ordering of goods and digital services, and it can apply higher online shares in slower-moving categories without consistent checks to household consumption ceilings. |
| Global Consultancy B | USD 6.90 B (2025) | Often uses a narrower retail-only view that can undercount cross-border orders shipped into Finland, and it may hold conservative average order value growth that is not re-validated frequently with local merchant and delivery inputs. |
The spread across the table is largely explained by what gets counted as e-commerce and how cross-border and net sales adjustments are handled in practice. Our method stays repeatable, where each input ties back to a clear demand pool and then gets sanity-checked with merchant and delivery realities before the base-year total is finalized.


Key Questions Answered in the Report
What is the current Finland e-commerce market size and projected growth?
The market is valued at USD 8.18 billion in 2026 and is forecast to grow at a 6.12% CAGR to USD 10.99 billion by 2031.
Which segment is expanding fastest within the Finland e-commerce market?
B2B e-commerce is advancing at an 8.12% CAGR as enterprises accelerate digital procurement.
How dominant is mobile commerce in Finland?
Smartphones account for 68.10% of online transactions and continue to grow at 7.10% CAGR, reflecting a mobile-first consumer base.
Why are Buy Now Pay Later services gaining traction?
BNPL options are expanding at 9.66% CAGR as consumers seek flexible budgeting tools amid inflation pressures.
What regulatory change poses challenges for Finnish SMEs selling abroad?
From January 2025, SMEs exceeding EUR 100,000 (USD 117212.68) EU sales must comply with the VAT One-Stop-Shop regime, adding cross-border tax complexity.
How are logistics innovations impacting rural Finnish shoppers?
Nearly 2,000 automated parcel lockers cut delivery times and costs, increasing satisfaction and access in rural and sub-Arctic regions.
Page last updated on:


 Your data is secure and never sold or shared.


