
Finished Steel Products Market Size and Share
Market Overview
| Study Period | 2020 - 2031 |
|---|---|
| Market Volume (2026) | 1.89 Billion tons |
| Market Volume (2031) | 2.47 Billion tons |
| Growth Rate (2026 - 2031) | 5.50 % |
| Fastest Growing Market | Asia-Pacific |
| Largest Market | Asia-Pacific |
| Market Concentration | Low |
Major Players *Disclaimer: Major Players sorted in no particular order Image © Mordor Intelligence. Reuse requires attribution under CC BY 4.0. | |
Finished Steel Products Market Analysis by Mordor Intelligence
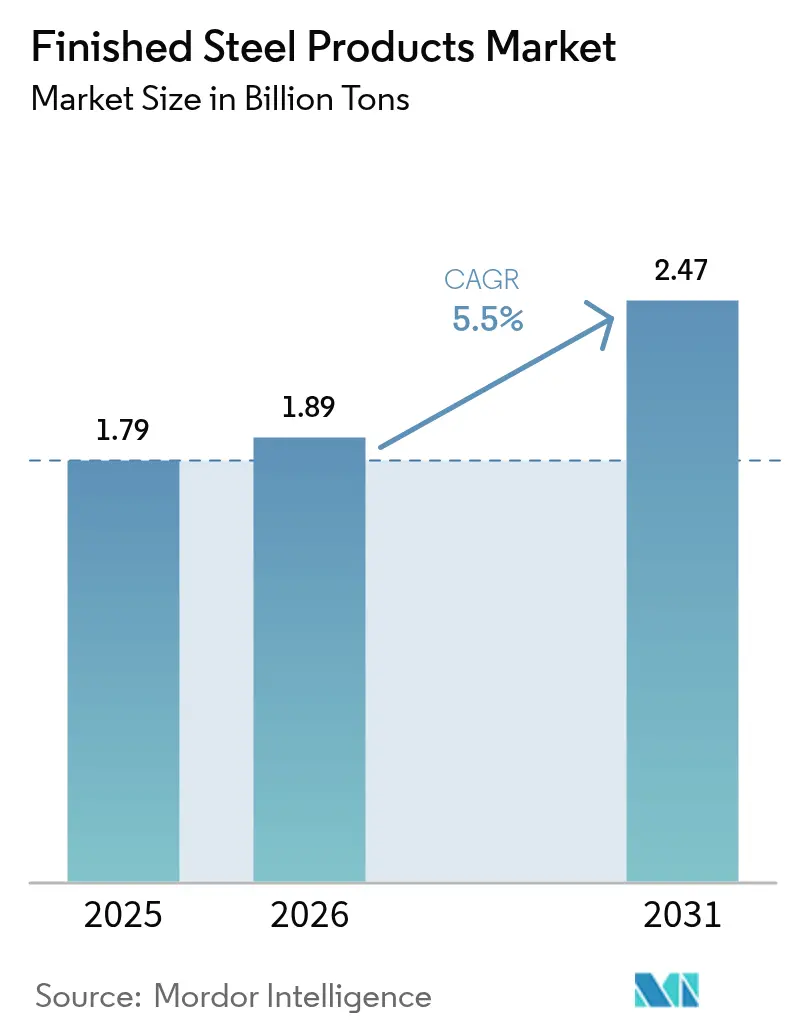
Finished Steel Products market size in 2026 is estimated at 1.89 billion tons, growing from 2025 value of 1.79 billion tons with 2031 projections showing 2.47 billion tons, growing at 5.50% CAGR over 2026-2031. Robust infrastructure pipelines in Asia and Africa, rising electric-vehicle (EV) penetration, and renewable-energy build-outs continue to anchor volume growth in the finished steel products market. Expanded electric-arc-furnace (EAF) capacity, supported by abundant metallic scrap, is improving regional cost competitiveness, while additive-manufacturing breakthroughs are opening new precision-engineering opportunities. Price volatility in iron ore and coking coal, coupled with trade-policy shifts, is reshaping sourcing strategies, yet sustained government spending on transport, energy, and housing projects buffers cyclical demand swings. The finished steel products market continues to benefit from defense re-armament, which drives premium demand for quenched-and-tempered (Q&T) grades, while rising carbon-pricing regimes accelerate capacity upgrades toward low-carbon production routes.
Key Report Takeaways
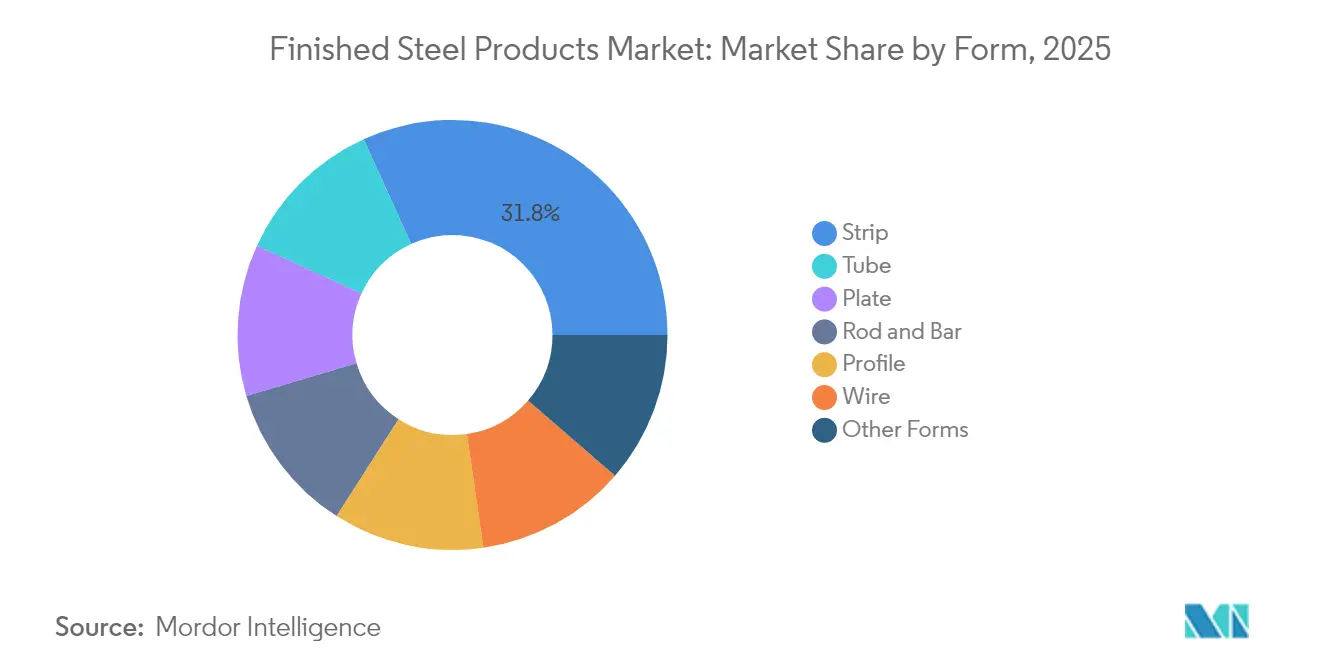
- By form, strip products led with a 31.78% revenue share in 2025, whereas tube products are forecast to expand at a 6.24% CAGR through 2031.
- By process, hot-rolling accounted for a 47.05% share of the finished steel products market size in 2025, while additive manufacturing is projected to grow at a 7.66% CAGR to 2031.
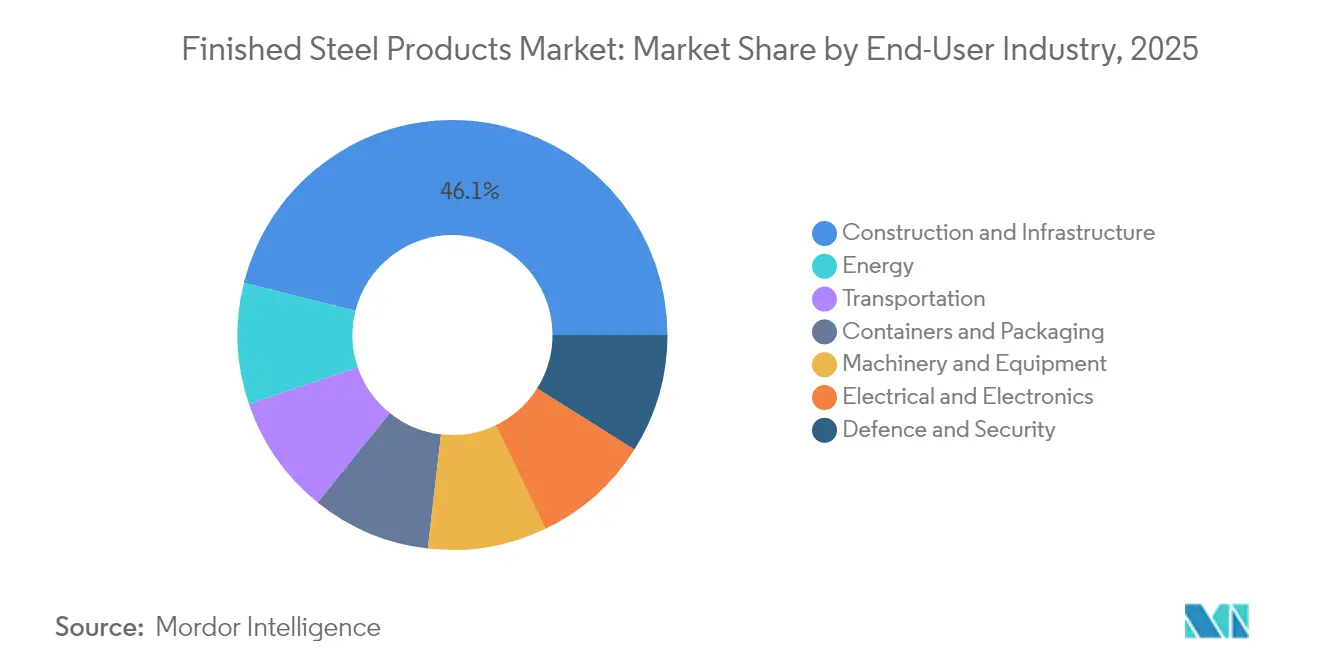
- By end-user industry, construction and infrastructure captured 46.10% of the finished steel products market share in 2025; energy applications represent the fastest-growing segment, advancing at a 5.95% CAGR during the forecast period.
- By geography, Asia-Pacific dominated with a 60.88% share of the finished steel products market in 2025 and is poised to record the highest regional CAGR of 6.12% through 2031.
Note: Market size and forecast figures in this report are generated using Mordor Intelligence’s proprietary estimation framework, updated with the latest available data and insights as of 2026.
Market Trends and Insights
Drivers Impact Analysis of Finished Steel Products Market*
| Driver | (~) % Impact on CAGR Forecast | Geographic Relevance | Impact Timeline |
|---|---|---|---|
| Infrastructure boom in Asia and Africa | +1.80% | Asia-Pacific core; Africa emerging | Medium term (2-4 years) |
| EV-driven demand for AHSS and electrical steels | +1.20% | Global; strongest in China, Europe, North America | Long term (≥ 4 years) |
| Renewable-energy build-out | +0.90% | Global | Long term (≥ 4 years) |
| Scrap-availability surge enabling EAF capacity growth | +0.70% | North America, Europe | Medium term (2-4 years) |
| Defense re-armament boosting Q&T armor plate | +0.40% | North America, Europe, Asia-Pacific | Short term (≤ 2 years) |
| Source: Mordor Intelligence | |||
Infrastructure boom in Asia and Africa
Annual infrastructure needs of USD 1.7 trillion in Asia and USD 67.6–107.5 billion in Africa are expanding demand for structural bars, beams, and rebar[1]. China’s Belt and Road Initiative spans 140 countries, funneling large tonnage orders to regional mills. India’s National Infrastructure Pipeline, valued at USD 1.4 trillion through 2025, continues to stimulate domestic capacity additions. Major producers are therefore establishing downstream finishing hubs nearer to project locations, shortening lead times and strengthening the finished steel products market. Intensified localization is also helping reduce CO₂ emissions tied to long-haul shipping.
EV-driven demand for AHSS and electrical steels
Advanced high-strength steel (AHSS) presently constitutes 35–40% of a typical EV body, up from 20% in conventional models. Tesla’s 2 million-unit capacity and BYD’s aggressive scaling point toward automotive steel consumption reaching 25–30 million tons by 2030. Grain-oriented electrical steels required for 800-volt traction motors are growing 15–20% annually, fetching premium price differentials. Suppliers are responding with rapid alloy-development cycles, hot-stamping expansions, and coating upgrades to safeguard market share against aluminum and composite alternatives. These investments enhance the finished steel products market as automakers recalibrate material balances for weight, safety, and cost.
Renewable-energy build-out driving steel intensity
Wind turbines consume 120–180 tons of steel per MW, while solar installations require 35–45 tons per MW. Global renewable additions exceeding 300 GW each year translate into more than 30 million tons of incremental annual demand, favoring plate, tower, and tubular products. Offshore wind development further boosts demand for corrosion-resistant and high-strength grades. Grid-modernization initiatives add sustained growth for transformer and power-transmission steels, reinforcing the finished steel products market outlook.
Scrap-availability surge enabling EAF capacity growth
Global scrap availability is projected to reach 800–900 million tons by 2030, lifting the EAF share of crude-steel production from 30% to 40%. Hyundai Steel’s USD 5.8 billion Louisiana plant, slated for 2029, exemplifies this drift toward flexible mini-mills. Greater scrap pools reduce dependence on iron ore and coking coal, lower operating emissions, and enable regional supply resilience.
Restraints Impact Analysis of Finished Steel Products Market*
| Restraint | (~) % Impact on CAGR Forecast | Geographic Relevance | Impact Timeline |
|---|---|---|---|
| Raw-material cost volatility | -0.80% | Global, acute in import-dependent regions | Short term (≤ 2 years) |
| Lightweight substitutes (Al, CFRP) in transport | -0.60% | North America, Europe, premium automotive segments | Long term (≥ 4 years) |
| EU-CBAM and green-premium cost divergence | -0.50% | Europe core, spillover to export-dependent producers | Medium term (2-4 years) |
| Structural over-capacity in China and GCC | -0.40% | Global, acute in Asia-Pacific and Middle East | Short term (≤ 2 years) |
| Source: Mordor Intelligence | |||
Raw-material cost volatility pressuring margins
Iron ore and coking coal prices fluctuated sharply during 2024 and 2025 as supply disruptions and currency changes intersected with uneven demand recovery. Vale, Rio Tinto, and BHP collectively control a significant share of seaborne ore, magnifying price swings during outages or weather events. Elevated power prices in Europe—often two to three times those in Asia or the United States—erode local mill competitiveness. These dynamics compel steelmakers to pursue long-term supply contracts, hedging programs, and vertical integration to shield EBITDA margins in the finished steel products market.
Lightweight substitutes challenging traditional applications
Aluminum content in premium passenger vehicles has risen to 180–200 kg per car, while carbon-fiber-reinforced plastics (CFRP) are displacing steel in aerospace fuselages and select automotive panels[2]. Lightweighting initiatives, driven by fuel-efficiency standards and EV range priorities, threaten steel penetration in transportation. Steelmakers counter with third-generation AHSS grades delivering comparable weight savings at lower cost, supported by established recycling loops and supply-chain familiarity. Continuous innovation remains essential to sustain competitiveness within the finished steel products market.
*Our forecasts treat driver/restraint impacts as directional, not additive. The impact forecasts reflect baseline growth, mix effects, and variable interactions.
Finished Steel Products Market Segment Analysis
By Form:
Strip Products Sustain Leadership While Tubes AccelerateStrip products generated the highest volume, capturing a 31.78% share in 2025 on the strength of automotive panels, appliance casings, and construction cladding. Robust demand from unibody vehicle platforms and standardized building components keeps mill utilization high. The finished steel products market size for strip products is forecast to maintain steady growth as surface-quality requirements rise. Tube products, although smaller in volume, are projected to achieve the fastest 6.24% CAGR through 2031, supported by pipeline expansions, renewable-energy towers, and HVAC installations. Precision tubes for automotive fuel lines and aerospace hydraulics command premium margins, encouraging investment in advanced welding and inspection systems.
Ongoing infrastructure spending in emerging markets supports heavy-section plate sales, whereas rod and bar benefit from reinforced-concrete demand. Profile and wire forms secure niche positions in engineered structures and electronic applications. Producers continue to optimize line flexibility to shift between strip and tube output as end-market signals evolve, preserving competitiveness within the finished steel products market.

By Process:
Hot-Rolling Dominates, Additive Manufacturing Gains MomentumHot-rolling retained a commanding 47.05% revenue share in 2025, fueled by its cost efficiency and suitability for bulk applications in automotive, construction, and heavy equipment. Modern continuous-casting and thin-slab technologies improve yield and reduce energy use, sustaining hot-rolling relevance even as decarbonization pressures mount. Additive-manufacturing output, though less than 1% of tonnage, is forecast to soar at a 7.66% CAGR. Aerospace engine brackets, medical implants, and tooling inserts lead early adoption, demonstrating the technology’s value in near-net-shape fabrication and rapid prototyping.
Hertha Metals’ single-step pyrometallurgical process, validated at its Texas pilot plant, underscores the disruptive potential of small-scale molten-metal printing, promising 30% energy savings and 98% emission cuts when powered by clean hydrogen. Cold-rolling, forging, casting, extrusion, and drawing remain integral, especially for high-precision or high-strength applications, yet capital allocation is gradually migrating toward hybrid lines capable of additive finishing. These shifts keep the finished steel products market adaptive to emerging technology platforms.
By End-user Industry:
Construction Leads; Energy SurgesConstruction and infrastructure consumed 46.10% of total volume in 2025, reflecting sustained urbanization and large-scale transport projects. Rapid residential development in emerging economies continues to underpin reinforcing bar sales, while commercial real-estate renovations drive beams and structural sections. The finished steel products market size linked to construction is expected to grow steadily as governments prioritize housing affordability and climate-resilient public works.
Energy applications represent the fastest-growing end-use, with a 5.95% CAGR forecast through 2031. Each MW of installed wind capacity requires up to 180 tons of steel, and over 300 GW of annual renewable additions translate into significant plate and tubular demand. Transmission-line upgrades and battery-storage projects further enhance electrical-steel consumption. Transportation, machinery, packaging, electronics, and defense add diversified volume streams, mitigating sector-specific volatility and reinforcing the robustness of the finished steel products market.
Geography Analysis
APAC Finished Steel Products Market
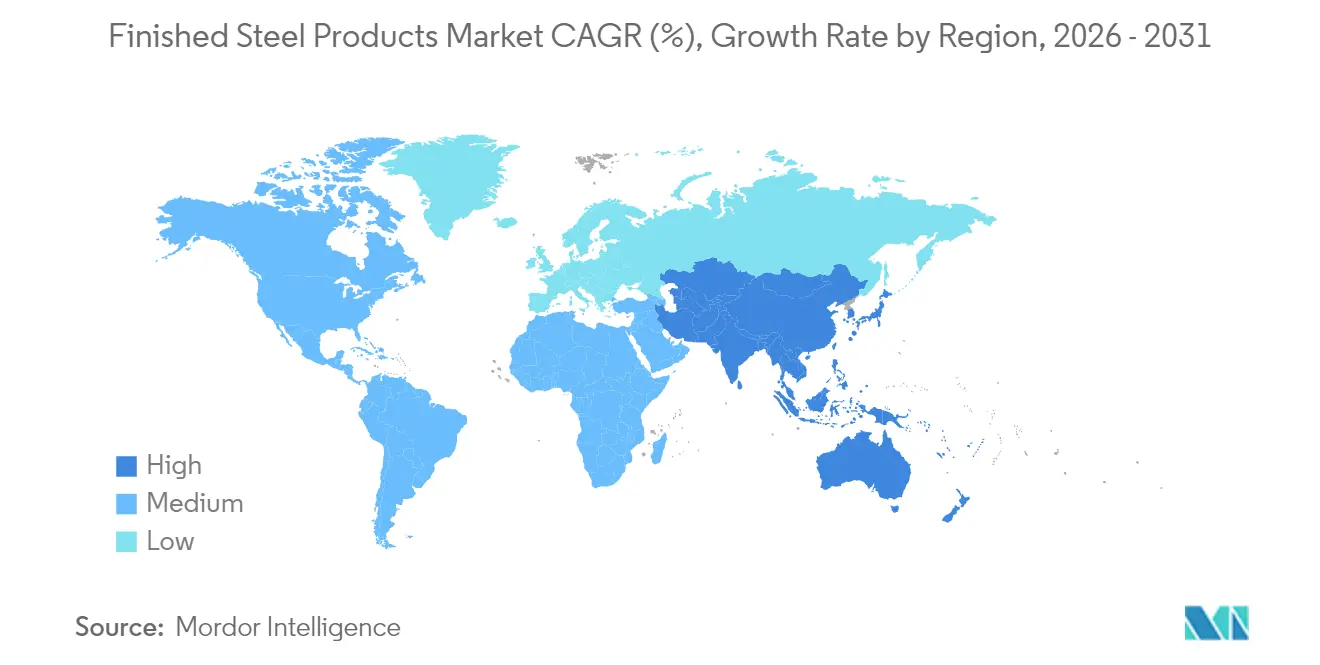
Asia-Pacific generated the largest share at 60.88% in 2025 and is forecast to expand at a 6.12% CAGR, combining massive domestic consumption with export capability. China’s crude-steel output exceeded 1 billion tons in 2024, though carbon-pricing trials and capacity-swap regulations are nudging mills toward high-quality finishing and green-steel projects. India’s USD 1.4 trillion National Infrastructure Pipeline accelerates domestic demand, while Southeast Asia benefits from rising electronics and appliance manufacturing. Policy incentives for hydrogen-based direct-reduced-iron (DRI) and scrap-based EAFs aim to balance growth with emission commitments, thereby sustaining the finished steel products market.
North America Finished Steel Products Market
North America is reorganizing around supply-chain security after the March 2025 imposition of 25% import tariffs. EAF expansions, such as Hyundai Steel’s Louisiana project, exploit abundant scrap and inexpensive energy. Regional OEMs increasingly favor local sourcing to mitigate tariff costs and geopolitical risk, supporting the finished steel products market despite cyclical construction softness.
EMEA and South America Finished Steel Products Market
Europe faces decarbonization and import-safeguard challenges under its Steel Action Plan, targeting a 15% reduction in non-EU inflows by 2026. Power-price differentials and carbon taxes pressure margins, yet hydrogen-driven DRI pilots and circular-economy scrap programs are positioning European mills as early movers in low-carbon premium grades. South America leverages abundant iron-ore reserves and renewable power to court green-steel investments, while Middle East and Africa, responsible for 45% of global DRI, aim to serve emerging green-iron corridors linking resource-rich regions with demand centers in Europe and Asia. These regional strategies collectively support long-term resilience in the finished steel products market.
Regulatory Landscape
Trade and carbon-compliance rules are increasingly shaping cross-border flows of finished steel products, particularly into Europe. The European Union moved to the definitive Carbon Border Adjustment Mechanism (CBAM) regime on January 1, 2026, requiring authorized declarants to buy CBAM certificates to cover embedded emissions in imported steel and to file annual declarations for the 2026 calendar year (due September 30, 2027). Safeguard and quota tools also remain active, with the WTO Committee on Safeguards reviewing 38 product-specific safeguard actions in April 2026, including 12 involving steel and metal products.
Europe has also tightened steel import management through quota design. Regulation (EU) 2026/1384 took effect on July 1, 2026, replacing prior safeguard measures with a revised tariff-rate quota (TRQ) system that reduces duty-free import volumes versus earlier levels and raises out-of-quota duties to 50%, which strengthens incentives for regional sourcing and for suppliers that can document lower-carbon production. The United Kingdom implemented a parallel steel trade defense measure on July 1, 2026, with similarly higher out-of-quota tariffs and added discussion around origin-tracing concepts such as melt-and-pour, increasing compliance and traceability requirements across the finished-steel supply chain.
Value Chain Analysis
The finished steel products value chain starts with upstream raw materials (iron ore, coking coal, metallics such as scrap and DRI, and alloys) and moves through ironmaking and steelmaking (BF/BOF and EAF routes), casting, primary rolling, and downstream finishing (including hot rolling, cold rolling, coating, tube making, wire drawing, and specialty processing such as additive manufacturing for select parts). Concentration in key upstream inputs, including major seaborne iron-ore suppliers, and volatility in bulk logistics can feed through quickly into finished-product lead times and pricing. Route choice, particularly whether production is scrap-based EAF or ore-based BF/BOF, increasingly affects emissions profiles and trade eligibility in regulated import markets.
Downstream, service centers, fabricators, EPC contractors, and OEMs convert finished steel into construction components, energy infrastructure (towers, pipes, plate), transportation parts, and packaging, with distribution shaped by trade actions and regionalization. OECD tracking points to structural excess capacity (over 600 mmt in 2024) and elevated export pressure (China exported 118.2 mmt in 2024), intensifying competition and pushing producers to rebalance networks toward localized finishing and nearer-to-customer supply. Supply-chain repositioning is visible in Hyundai Steel's USD 5.8 billion, 2.7 mmt EAF-based integrated mill in Louisiana (targeting 2029) and Nippon Steel's USD 14.9 billion acquisition of U.S. Steel finalized in June 2025 under a U.S. national security agreement framework that includes an investment plan through 2028, both of which tighten the link between domestic production footprints and finished-steel availability in key consuming regions.
Competitive Landscape
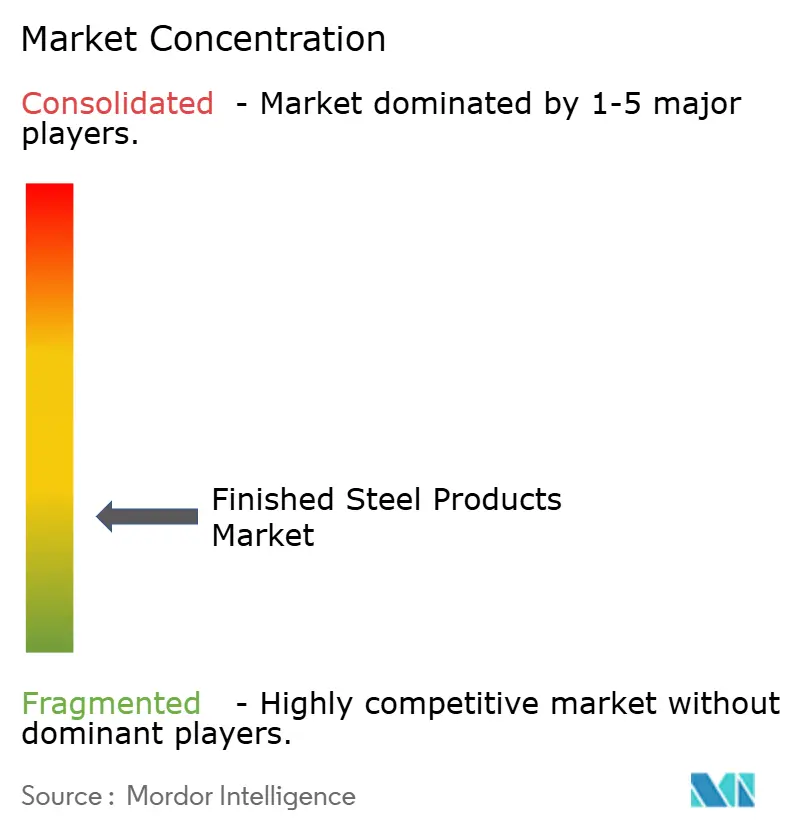
The finished steel products market exhibits highly fragmented concentration. China Baowu Steel Group leads global output, followed by ArcelorMittal, POSCO, HBIS, and Nippon Steel, yet specialized grades and regional proximity grant smaller mills competitive pockets.
Strategic moves center on vertical integration, decarbonization, and digitalization. U.S. Steel entered an AI-enabled maintenance partnership with Gecko Robotics in 2025 to boost asset uptime and reduce inspection costs. Nucor invested in Electra’s zero-carbon iron technology to secure low-emission feedstock for its EAF network. ArcelorMittal and BHP jointly advanced green-steel pilot trials featuring hydrogen injection into blast furnaces, targeting 30% emission cuts by 2030.
Trade policy shifts also reshape competitive dynamics. The Biden administration blocked Nippon Steel’s proposed USD 14.9 billion acquisition of U.S. Steel on national-security grounds in 2025, signaling heightened scrutiny of cross-border consolidation. Meanwhile, European safeguard measures deter low-priced imports, accelerating regional mini-mill capacity additions. Breakthroughs such as Hertha Metals’ fast-cycle pyrometallurgical technology threaten to disrupt legacy scale economics by enabling profitable 500,000-ton micro-mills. These developments keep the finished steel products market dynamic and innovation-driven.
Finished Steel Products Industry Leaders
-
ArcelorMittal
-
Baosteel Group
-
Nippon Steel Corporation
-
HBIS Group
-
POSCO
- *Disclaimer: Major Players sorted in no particular order
Finished Steel Products Market Companies Covered in this Report
- ArcelorMittal
- Baosteel Group
- BMWIL
- China Ansteel Group Corporation Limited
- Gerdau S/A
- HBIS Group
- Hyundai Steel
- JFE Steel Corporation
- Jiangsu Shagang Group
- JSW Steel Ltd
- Nippon Steel Corporation
- Nucor
- Outokumpu
- POSCO
- Shougang Group
- SSAB AB
- Steel Authority of India Limited (SAIL)
- Tata Steel
- ThyssenKrupp AG
- United States Steel
- Voestalpine AG
Market Opportunities and Future Outlook
A key opportunity set is emerging around compliance-ready and traceable finished steel supply into regulated import markets, especially Europe. The EU definitive CBAM regime from January 1, 2026 and the July 1, 2026 implementation of Regulation (EU) 2026/1384, including tighter TRQs and higher out-of-quota duties, raises the value of documented embedded-emissions data and origin transparency. This increases room for producers and processors that can deliver auditable product carbon footprints, improve scrap-based feedstock control, and integrate digital reporting across the mill-to-service-center chain.
A second opportunity is the build-out of domestic and regional finished-steel capacity in high-demand corridors where infrastructure and manufacturing localization are driving new projects and product-mix upgrades. India provides concrete investment proof points in 2026, including JSW Steel initiating development of a 13.2 mtpa integrated steel plant at Paradeep, Odisha (May 2026) and ArcelorMittal Nippon Steel India starting work on an 8.2 mtpa integrated plant in Visakhapatnam, Andhra Pradesh (March 2026), alongside Tata Steel outlining FY2027 capital expenditure allocations to Indian operations such as tinplate and wire expansions (July 2026). These programs support downstream finishing additions for value-added strip, coated products, tubes, and wire, aligning with construction and energy demand while also addressing barriers for qualified, higher-grade automotive and electrical-steel applications that are difficult to replace with commoditized imports.
Recent Industry Developments in Finished Steel Products Market
- July 2026: Baosteel and Primetals Technologies started up a new caster in Shanghai. The upgrade improves downstream slab supply quality and throughput, supporting higher-spec strip and plate production as surface and consistency requirements tighten across automotive, appliances, and energy applications.
- June 2026: ArcelorMittal announced a strategic collaboration with Amazon Web Services (AWS) focused on accelerating industrial automation and enabling lower-carbon construction solutions. The partnership links digitalization to yield, uptime, and emissions reporting, which can influence competitiveness for certified and compliance-ready finished steel products.
- March 2026: Nippon Steel completed a permanent financing arrangement related to its acquisition of U.S. Steel, raising approximately 900 billion yen through co-financing led by JBIC and other institutions. Secured financing supports the post-deal investment agenda and capacity modernization pathway that can expand availability of higher-grade finished steel within the United States.
Finished Steel Products Market Report Scope and Research Methodology
Market Definition and Coverage
This market covers finished steel products that are ready for sale and use after steel is converted from semi-finished inputs into final commercial forms through rolling, forging, casting, and related finishing steps, and it is measured as physical volume shipped and consumed across major end-use industries.
Scope exclusions: We exclude upstream iron ore, coking coal, scrap collection, and semi-finished steel (blooms, billets, and slabs) that have not yet been converted into finished forms.
Segments Covered in This Report
- By Form
- Plate
- Strip
- Rod and Bar
- Profile
- Tube
- Wire
- Other Forms
- By Process
- Hot-Rolling
- Cold-Rolling
- Forging
- Casting
- Extrusion and Drawing
- Additive Manufacturing of Steel
- By End-user Industry
- Construction and Infrastructure
- Transportation
- Energy
- Containers and Packaging
- Electrical and Electronics
- Machinery and Equipment
- Defence and Security
- By Geography
- Asia-Pacific
- China
- India
- Japan
- South Korea
- ASEAN Countries
- Australia and New Zealand
- North America
- United States
- Canada
- Mexico
- Europe
- Germany
- United Kingdom
- Italy
- France
- Spain
- Russia
- Rest of Europe
- South America
- Brazil
- Argentina
- Rest of South America
- Middle-East and Africa
- Saudi Arabia
- South Africa
- Turkey
- Rest of Middle-East and Africa
- Asia-Pacific
Data Sources, Market Sizing, and Validation
Desk Research
Desk research starts with building a clear view of steel output, trade flows, and downstream use so the demand pool can be explained in simple terms. We reference public sources such as World Steel Association publications, national statistics offices, customs and trade statistics portals, central bank FX time series for currency conversion, and energy and infrastructure datasets from agencies such as the IEA and the World Bank for context.
Alongside these, company annual reports, investor presentations, and production updates are used to understand product mix shifts between flat and long products, and also how utilization and maintenance cycles affect supply. Patent databases and peer-reviewed metallurgy and manufacturing journals are used to check process trends that can change yield and finished output. For company financials and for shipment-level import and export checks, we also use selected paid database subscriptions where relevant. The sources listed above are illustrative, and other public and internal reference points are reviewed to collect data, validate it, and clarify open questions.
Primary Interviews and Surveys
Primary interviews and surveys are used to sanity-check what finished steel is counted as, and how volumes are recorded across mills, processors, distributors, and large end users. We speak with commercial and operations respondents, and also with procurement and technical teams, covering demand centers across APAC, EMEA, and the Americas so assumptions on mix, utilization, and trade leakage can be corrected before the final model is built.
Distribution of primary research fieldwork respondents
| Company type | Respondent position | Region |
|---|---|---|
| Top tier: 35% | CXOs: 16% | APAC: 42% |
| Mid tier: 43% | Functional/Unit leaders: 25% | EMEA: 32% |
| Smaller Players: 22% | Managers: 59% | Americas: 26% |
Market-Sizing & Forecasting
The core build uses a top-down approach where production and trade data are reconstructed into apparent consumption, then filtered into finished steel volumes after accounting for processing yields and product mix. To keep totals realistic, results are corroborated through selective bottom-up approximations such as sampled mill output run rates, distributor throughput checks, and typical tons-by-sector demand splits shared by industry participants.
Key inputs in the model include crude steel and finished steel output trends, import and export balances by product group, capacity additions and utilization rates, and end-use indicators such as construction starts and automotive production. Price and value signals are treated carefully, since finished steel moves with grade mix and contract timing. As a result, ASP logic is applied only after the volume base is stable and checked against the modeled shipment pattern.
For forecasting, scenario analysis is used around macro demand drivers and capacity shifts, and scenarios are then narrowed using expert consensus from interviews on expected restocking cycles, trade policy impacts, and lead time normalization. Where bottom-up checkpoints are thin in certain countries or for smaller product forms, proxy ratios from similar markets are applied and then adjusted using trade intensity and utilization signals.
Data Validation & Update Cycle
Outputs are validated by comparing modeled consumption against independent signals such as reported steel use by sector, utilization trends, and observed trade shifts, and by reviewing any unusual jumps at the country and regional level. When differences fall outside expected bounds, assumptions are revisited and, if needed, respondents are re-contacted to confirm whether the change is real or a timing effect.
Before sign-off, the model goes through multi-step analyst reviews that check arithmetic consistency, unit handling, and whether key variables move in the right direction together. The report is refreshed annually, and interim updates are made when material events occur such as major capacity ramp-ups, trade restrictions, or sharp currency moves. Right before delivery, a final pass is completed so clients receive the most current view available.
Mordor Intelligence's Finished Steel Products Market Size Compared With Other Published Estimates
Published market sizes for finished steel products can look far apart because authors do not always measure the same thing, and sometimes the unit (value versus volume) is mixed into the headline without being obvious. Differences also come from how trade is treated, how product mix is handled, and how quickly assumptions are refreshed when steel prices and FX rates move.
A common gap driver is the choice between revenue-based sizing and tonnage-based sizing, since one can move sharply with ASP swings even when volumes stay steadier. Another driver is refresh cadence and currency timing, where exchange rates and quarterly price resets can shift the reported number, and those checks are updated more frequently in the validation loop used by Mordor Intelligence.
Benchmark comparison
| Source | Market Size | Gaps in Research Methodology |
|---|---|---|
| Mordor Intelligence | USD 1.89 B (2026) | |
| Industry Publisher A | USD 2.10 B (2024) | Uses a value headline for a different base year and appears to mix revenue framing with a broad segmentation narrative, which can understate the impact of steel ASP and FX timing on year-to-year comparability. |
| Consultancy B | USD 510.92 B (2025) | Represents a much wider value scope that likely covers broad steel product revenues across regions, so the number is not directly comparable to a finished steel volume-defined boundary and can expand with price cycles. |
Taken together, the spread mostly reflects unit choice and scope boundaries, more than a true disagreement on underlying steel demand direction. By keeping the demand pool tied to production plus trade, and then layering transparent yield and mix adjustments, the estimate stays traceable to repeatable inputs that can be revisited each refresh.
Key Questions Answered in the Report
How large will global demand be for finished steel products by 2031?
Volume is projected to reach 2.47 billion tons by 2031, reflecting a 5.50% CAGR from 2026 levels.
Which region contributes most to finished steel growth?
Asia-Pacific dominates with 60.88% of 2025 volume and is forecast to grow at 6.12% CAGR through 2031, driven by China, India, and Southeast Asia.
What segment of finished steel is expanding fastest?
Tube products, supported by energy-infrastructure projects and precision industrial uses, are forecast to post a 6.24% CAGR to 2031.
How is decarbonization influencing steelmaking processes?
Investment is shifting toward EAF capacity and hydrogen-based direct-reduction, while additive manufacturing offers energy-efficient near-net-shape fabrication.
What are the key risks facing producers?
Raw-material cost volatility, trade-policy uncertainty, and competition from lightweight substitutes such as aluminum and CFRP present headwinds.