
Filter Integrity Test Market Size and Share
Market Overview
| Study Period | 2022 - 2031 |
|---|---|
| Market Size (2026) | USD 88.79 Million |
| Market Size (2031) | USD 114.29 Million |
| Growth Rate (2026 - 2031) | 5.16 % |
| Fastest Growing Market | Asia Pacific |
| Largest Market | North America |
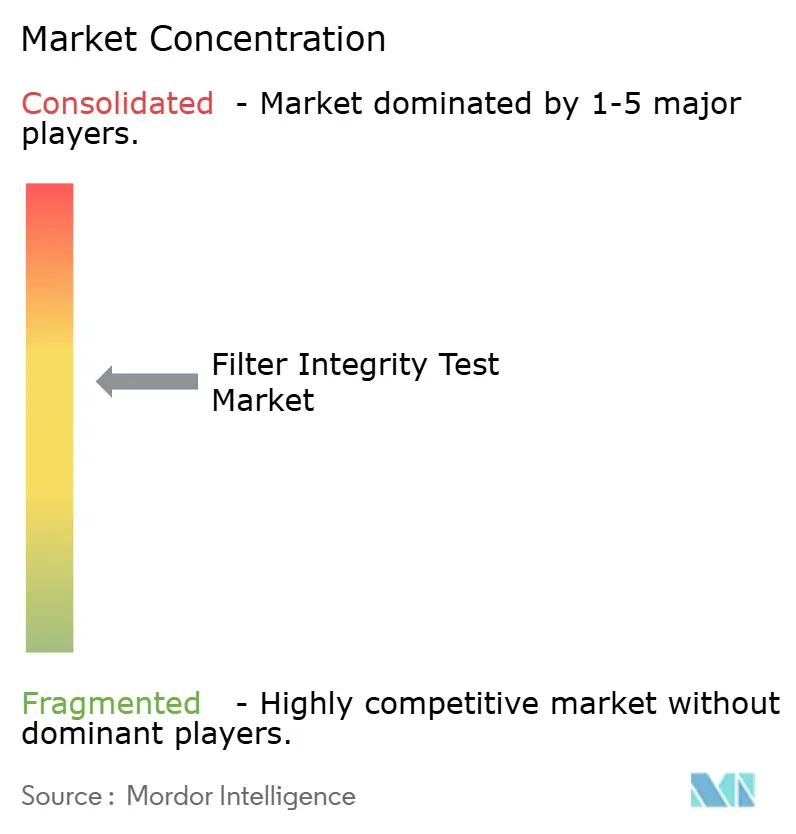
| Market Concentration | Medium |
Major Players *Disclaimer: Major Players sorted in no particular order Image © Mordor Intelligence. Reuse requires attribution under CC BY 4.0. | |
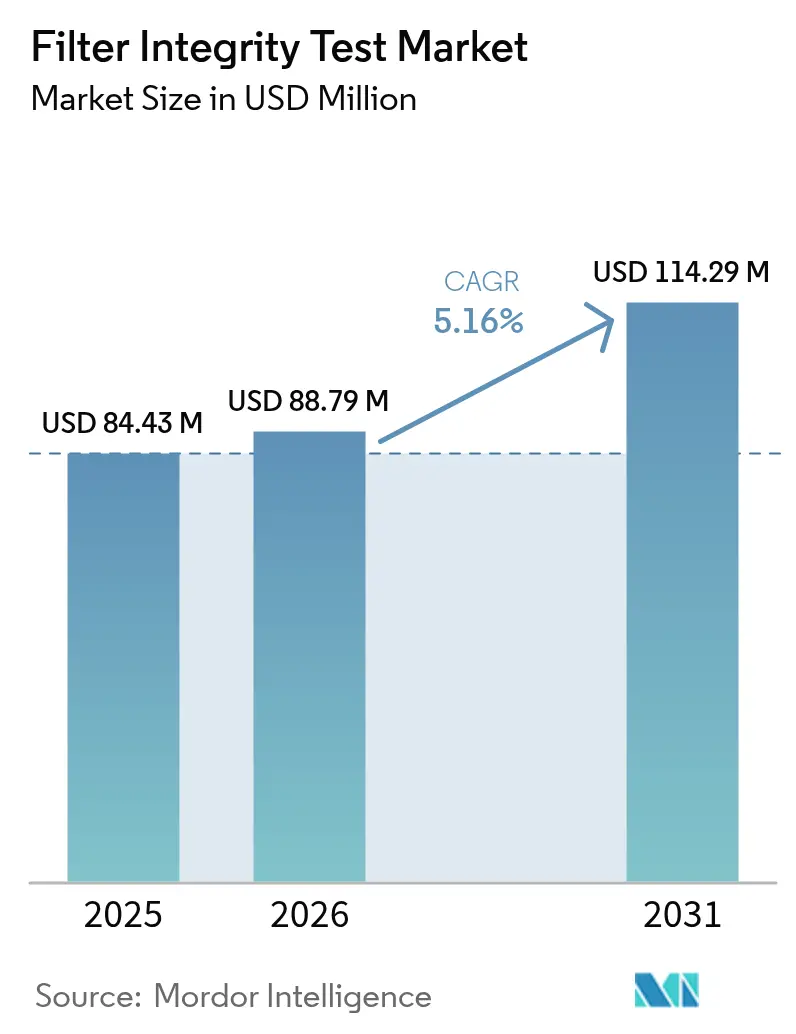
Filter Integrity Test Market Analysis by Mordor Intelligence
The filter integrity test market size in 2026 is estimated at USD 88.79 million, growing from 2025 value of USD 84.43 million with 2031 projections showing USD 114.29 million, growing at 5.16% CAGR over 2026-2031. Intensifying regulatory oversight over sterile manufacturing, rapid bioprocess capacity build-outs, and widespread digitalization of quality control workflows underpin this steady expansion. Heightened investments in cell- and gene-therapy facilities demand more sophisticated validation protocols, while the pivot toward single-use filtration assemblies amplifies testing volumes. Automated systems that generate tamper-proof audit trails are increasingly preferred because they minimize human error, uphold data integrity, and accelerate batch-release timelines. In parallel, emerging acoustic test technologies promise non-destructive, high-sensitivity defect detection that strengthens contamination-control strategies in advanced therapeutics manufacturing.
Key Report Takeaways
- By product type, automated systems led with 56.88% revenue share in 2025 and are advancing at a 7.52% CAGR through 2031.
- By test type, bubble point testing held 40.75% of the Filter Integrity Test market share in 2025, while water intrusion testing records the fastest 7.12% CAGR to 2031.
- By mechanism, pressure-based methods commanded 61.72% share in 2025, whereas acoustic technologies expand at an 8.05% CAGR through 2031.
- By filter type, liquid filters accounted for 67.90% of the Filter Integrity Test market size in 2025 and are forecast to grow 7.27% annually to 2031.
- By application, liquid filtration integrity testing captured 60.98% share in 2025 and is progressing at an 8.34% CAGR to 2031.
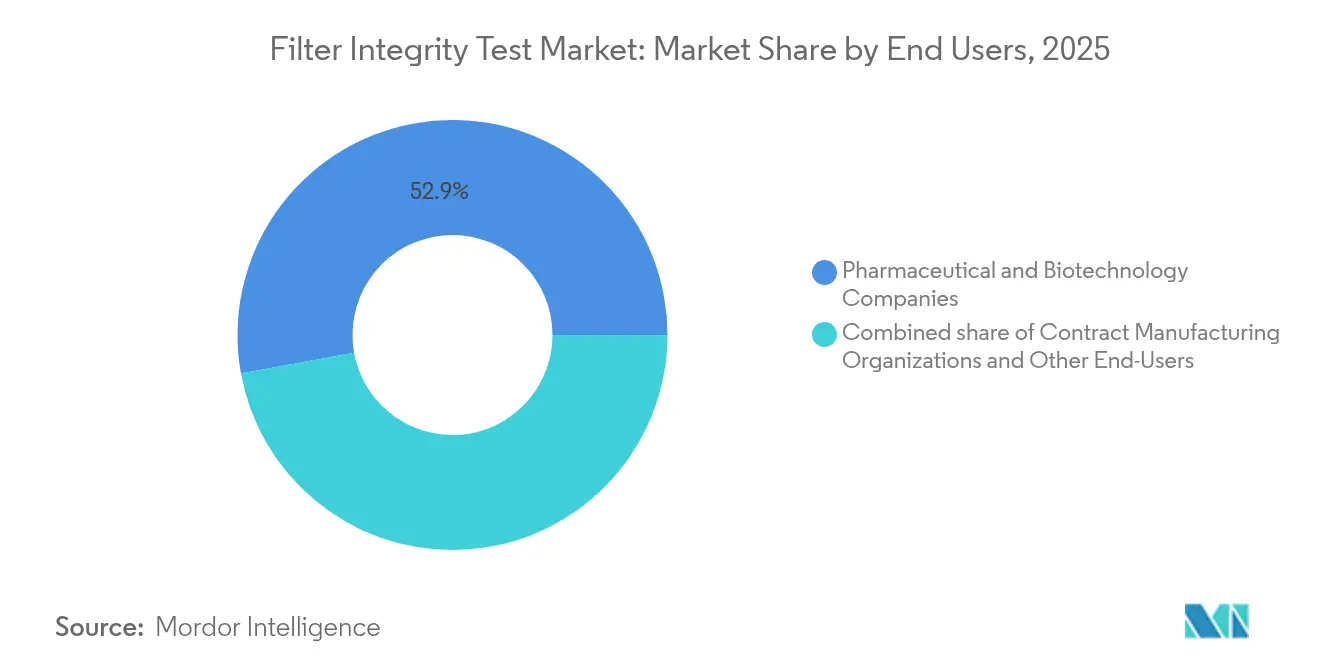
- By end user, pharmaceutical and biotechnology firms contributed 52.86% demand in 2025; contract manufacturing organizations post the highest 8.55% CAGR through 2031.
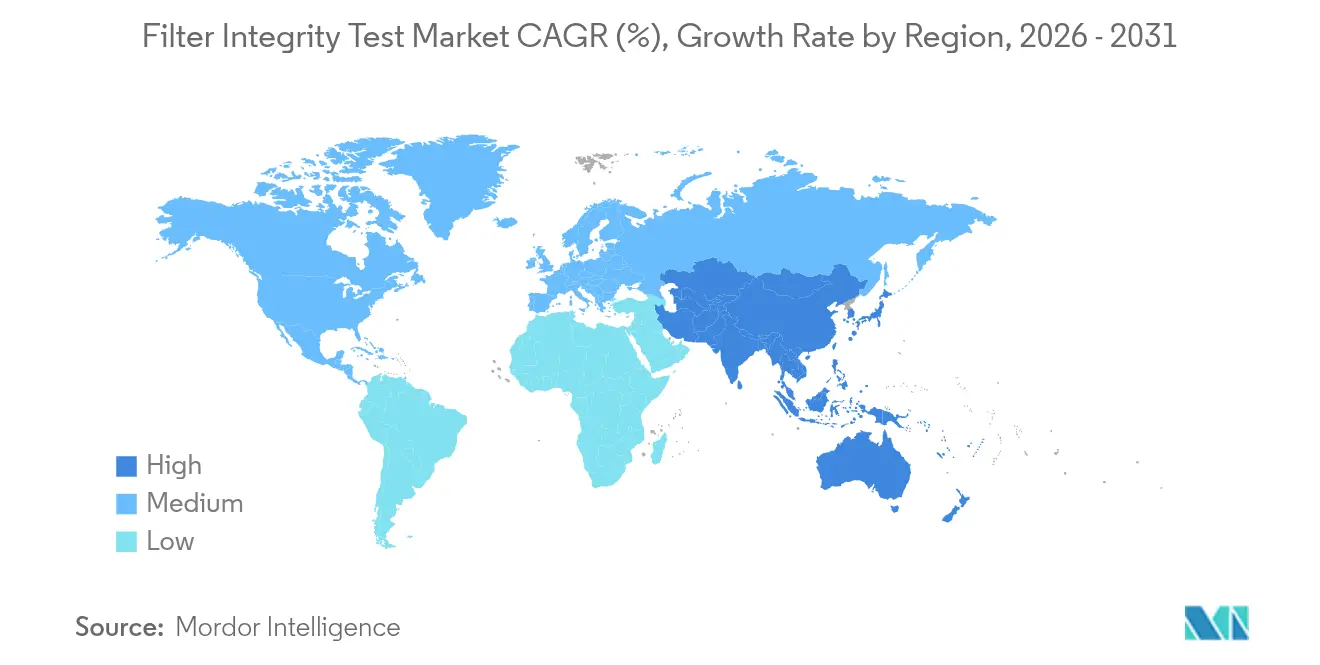
- By geography, North America retained leadership with 39.10% share in 2025, whereas Asia-Pacific is projected to record a 6.41% CAGR to 2031.
Note: Market size and forecast figures in this report are generated using Mordor Intelligence’s proprietary estimation framework, updated with the latest available data and insights as of 2026.
Market Trends and Insights
Drivers Impact Analysis of Filter Integrity Test Market*
| Driver | % Impact on CAGR Forecast | Geographic Relevance | Impact Timeline |
|---|---|---|---|
| Growth in global biopharmaceutical capacity | +1.2% | APAC, North America, EU | Medium term (2-4 years) |
| Regulatory mandates for sterile compliance | +0.9% | North America, EU, Global | Short term (≤ 2 years) |
| Rising adoption of single-use filtration | +0.8% | Developed markets, Global | Medium term (2-4 years) |
| Food and beverage safety investments | +0.5% | EU, Global | Long term (≥ 4 years) |
| Expansion of high-potency & advanced therapies | +0.7% | North America, EU, APAC | Long term (≥ 4 years) |
| Digitalization of quality control analytics | +0.6% | Developed markets, Global | Medium term (2-4 years) |
| Source: Mordor Intelligence | |||
Growth in Global Biopharmaceutical Production Capacity
Surging construction of large-scale bioreactors amplifies demand for Filter Integrity Test market solutions as firms validate ever-greater filtration surface areas. More than 16.5 million L of active capacity now spans 1,500+ facilities worldwide, with APAC adding the largest blocks of stainless-steel and single-use suites[1]. Chinese producers report that 90% plan to export globally within a decade, mirroring 100% of surveyed Indian peers. High-profile projects such as Samsung Biologics’ USD 1.46 billion fourth plant in Incheon and Fujifilm Diosynth’s USD 3.2 billion expansions in Denmark and North Carolina illustrate the multi-site build-outs that each require hundreds of automated testers. These installations emphasize throughput, driving preference for self-diagnosing systems capable of parallel test execution and instant electronic release.
Regulatory Mandates for Sterile Manufacturing Compliance
Regulators elevate integrity testing from best practice to explicit requirement, tightening timelines for market authorization. EMA Annex 1 now obliges Pre-Use Post-Sterilization Integrity Testing for sterile drug filters, materially increasing test frequency in European plants. U.S. FDA guidance on data integrity for bioequivalence studies stipulates complete, accurate, contemporaneous electronic records, spurring upgrades to 21 CFR Part 11-compliant instruments[2]. Harmonized microbial limits, such as the FDA’s ≤ 10 CFU/100 mL bioburden threshold before final filtration, institutionalize routine verification cycles across biologics and vaccine lines.
Rising Adoption of Single-Use Filtration Systems
Disposable assemblies reshape the Filter Integrity Test market by introducing sealed, gamma-irradiated filter capsules that cannot undergo repeated wetting-drying cycles. FDA endorsements during COVID-19 response highlighted their role in rapid scale-up. Yet integrity verification must occur once, pre-use, without compromising sterility. Automated testers with low internal volume and remote-connectivity firmware execute short, non-destructive assessments while logging full results directly into Manufacturing Execution Systems. Suppliers integrate inline sensors to enable point-of-use leak detection, reducing operator intervention and accelerating release.
Digitalization of Quality Control and Process Analytics
Manufacturers accelerating toward Pharma 4.0 embed integrity testers into plant-wide data lakes so quality metrics update dashboards in real time, a shift that adds +0.6% to projected CAGR. Edge-enabled instruments now push JSON outputs directly to MES and LIMS platforms, shaving hours off deviation investigations and facilitating continuous-quality-verification strategies approved by regulators. Artificial-intelligence algorithms overlay live diffusion curves with historian baselines to flag drift before it triggers an out-of-spec result, letting maintenance teams rotate filter housings proactively. Suppliers bundle cyber-security hardening and encrypted time-stamps to meet 21 CFR Part 11 and EU Annex 11 clauses, ensuring electronic records remain tamper-evident. Together these features reduce manual data handling, cut transcription errors, and support real-time release testing, reinforcing the commercial case for automated platforms across both legacy and greenfield sites within the Filter Integrity Test market.
Restraints Impact Analysis of Filter Integrity Test Market*
| Restraints Impact Analysis | (~) % Impact on CAGR Forecast | Geographic Relevance | Impact Timeline |
|---|---|---|---|
| High capital cost of automated instruments | -0.8% | Emerging markets, Global | Short term (≤ 2 years) |
| Limited skilled GMP testing workforce | -0.6% | APAC, Global | Medium term (2-4 years) |
| Data-integrity risks in legacy software | -0.4% | Mature markets, Global | Medium term (2-4 years) |
| Environmental concerns over single-use waste | -0.3% | EU, North America | Long term (≥ 4 years) |
| Source: Mordor Intelligence | |||
High Capital Cost of Automated Test Instruments
Cutting-edge integrity testers that conform to EMA Annex 1 can exceed USD 100,000 per unit, discouraging smaller facilities from immediate adoption. Instruments such as the explosion-proof Sartocheck 5 Plus bundle risk-management software, auto-fail-safe logic, and encrypted audit-trails, but the upfront cash outlay remains substantial. Leasing models and pay-per-test service contracts have emerged to lower entry barriers, although uptake in price-sensitive regions still lags.
Limited Skilled Workforce for GMP Integrity Testing
Accelerated facility builds, specifically in Asia-Pacific, outpace the availability of certified QC analysts versed in Annex 1, ICH Q9, and 21 CFR Part 11. Retirements in North American plants compound shortages. ISPE benchmarking highlights elevated overtime rates in microbiology labs, raising data-integrity risk profiles[3]. Companies respond with digital SOP platforms and augmented-reality training that halve onboarding time yet require capital and cultural change.
*Our forecasts treat driver/restraint impacts as directional, not additive. The impact forecasts reflect baseline growth, mix effects, and variable interactions.
Filter Integrity Test Market Segment Analysis
By Product Type:
Automated Systems Drive Market EvolutionAutomated testers captured 56.88% of Filter Integrity Test market share in 2025 on the back of universal data-integrity mandates. They are simultaneously the fastest-growing at a 7.52% CAGR through 2031 as firms phase out manual rigs that lack electronic record keeping. Leading platforms integrate pre-programmed PUPSIT cycles, remote diagnostics, and predictive maintenance alerts, boosting equipment uptime and batch-release velocity. Manual devices persist in pilot plants and low-volume nutraceutical operations where budget constraints outweigh compliance pressure. Nevertheless, falling sensor costs and cloud-native analytics narrow the total-cost-of-ownership gap, accelerating the switch to automation during facility refurbishments. Across global installations, automated instruments now represent the default specification for any greenfield biologics expansion.
Second-generation units embed artificial-intelligence algorithms that recognize atypical diffusion curves, auto-flagging potential membrane damage before a catastrophic breach can contaminate product. Suppliers validate firmware under GAMP 5 to streamline 510(k) approvals for devices shipped into regulated U.S. lines. This evolution positions automated systems as the linchpin of enterprise-wide electronic Quality Management Systems, cementing their dominance in the filter integrity test market.


By Test Type:
Water Intrusion Testing Gains MomentumBubble point remains the gold-standard hydrophilic membrane assay with 40.75% share; however water intrusion testing (WIT) leads growth at a 7.12% CAGR. WIT verifies hydrophobic filters without the wetting and drying steps that jeopardize sterility, making it indispensable for cell- and gene-therapy suites running multi-product campaigns. Enhanced algorithmic baselining compensates for humidity fluctuations, broadening WIT’s deployability across climate zones. Diffusion/forward-flow protocols retain relevance for validating low-surface-area filters in high-potency drug manufacture, while pressure-hold tests confirm mechanical stability under surge conditions. Over the forecast horizon, WIT adoption is poised to eclipse diffusion in new hydrophobic filter installations, reinforcing its status as the segment’s growth engine within the Filter Integrity Test market size.
By Mechanism :
Acoustic Technologies Reinforce Non-Destructive Testing GoalsPressure-based techniques commanded 61.72% of Filter Integrity Test market share in 2025 because regulators have long accepted their reliability and straightforward validation protocols. In day-to-day biopharmaceutical operations they remain the default choice for hydrophilic and hydrophobic membranes alike, especially in high-throughput vaccine-fill suites where cycle time is tightly controlled. Continuous software refinements now let modern pressure rigs auto-compensate for temperature drift, tightening test repeatability margins and shortening engineer sign-off loops. The 61.72% dominance nonetheless masks a subtle shift in customer wish-lists: manufacturers want methods that probe microscopic defects without wetting membranes or exposing sterile assemblies to external gases.
That preference fuels the 8.05% CAGR logged by acoustic/sonic approaches through 2031, positioning them as the most dynamic slice of the Filter Integrity Test market. Ultrasonic bubble-detection arrays and resonance-frequency scans supply contact-free verification, a feature prized in cell-therapy plants that cannot tolerate even trace contaminants. Vendors pair these probes with cloud dashboards that trace resonance signatures batch-by-batch, enabling predictive analytics that spot gradual membrane fatigue weeks before yield dips. Marker-based and visualization methods hold niche roles—such as fluorescent dyes for academic method development—but their combined footprint stays modest because they lack the throughput and data-integrity automation of pressure and acoustic platforms. Over the forecast horizon, suppliers are expected to embed dual-mode heads that let operators toggle between pressure and acoustic modes, allowing one instrument to satisfy legacy compendial tests while future-proofing against next-generation non-destructive standards.
By Filter Type :
Liquid Filtration Remains the Volume EngineLiquid filters generated 67.90% of the Filter Integrity Test market size in 2025 due to the pharmaceutical sector’s near-universal use of sterile liquid processing for injectables, monoclonal antibodies, and mRNA therapeutics. Each aseptic fill line may deploy up to five sequential sterile liquid filters, a configuration that amplifies integrity-test counts and cements liquids as the segment’s revenue anchor. Rising titres in fed-batch and perfusion bioreactors raise viscosity, prompting manufacturers to install larger surface-area cartridges that—once sterilized—require bubble-point or diffusion confirmation before every lot release. Regulatory guidelines insisting on Pre-Use Post-Sterilization Integrity Testing intensify test frequency and sustain the 7.27% CAGR forecast for liquid filters through 2031.
Air and gas filters play a smaller but indispensable role in maintaining Grade A laminar-flow zones, venting bioreactors, and protecting lyophilizers from airborne bioburden. Although this niche commands fewer units, it demands high-sensitivity instruments capable of detecting sub-micron breaches that could trigger costly batch losses. Device makers respond with modular test modules that switch seamlessly between liquid and gas modes, letting QC teams consolidate equipment fleets while meeting both liquid- and air-filtration protocols. Long term, environmental monitoring initiatives inside isolators may divert a fraction of budget toward real-time, in-line aerosol particle sensors, yet liquid filtration will continue to deliver the bulk of absolute unit growth for the Filter Integrity Test market.
By End Users :
CDMOs Shape Outsourcing-Led GrowthPharmaceutical and biotech license-holders generated 52.86% of 2025 demand, reflecting their legal accountability for product sterility and their entrenched investment in on-site QC laboratories. These firms standardize on automated testers that interface with electronic batch records, limiting reviewer cycle times and reducing FDA Form 483 observations tied to paper data. However, contract manufacturing organizations are expanding fastest, posting an 8.55% CAGR that reshapes buying power dynamics within the Filter Integrity Test industry. Multi-client campuses in China, India, and the United States scale up single-use processing suites to woo advanced-therapy sponsors, and every added cleanroom bay requires its own fleet of integrity testers compliant with Annex 1 PUPSIT clauses.
CDMOs’ business model relies on audit readiness across a spectrum of international guidelines, so they gravitate to platforms offering one-click retrieval of 21 CFR Part 11 audit trails and harmonized SOP libraries. Food-and-beverage processors, medical-device assemblers, and specialist micro-electronics fabs round out the customer base but each has unique validation scripts centred on HACCP, ISO 13485, or IEST standards. Suppliers increasingly package sector-specific firmware and calibration kits, enabling a single tester chassis to pivot among end-market verticals by swapping test recipes. This configurability helps vendors defend margins while addressing the heterogenous workflow needs of an outsourcing-heavy marketplace.
By Application :
Liquid Filtration Integrity Testing Dominates Regulatory WorkflowsLiquid filtration integrity testing represented 60.98% Filter Integrity Test market share in 2025 and is growing at an 8.34% CAGR because injectable-drug manufacturers must certify sterility for every lot released to the public. Annex 1 expressly labels pressure monitoring a critical process parameter, obliging QC teams to confirm acceptable diffusion limits under worst-case flow and pressure settings for each filter train. Modern auto-testers store individual membrane serial numbers and tie result files directly to batch IDs, giving Qualified Persons immediate visibility for disposition decisions.
Air-filtration integrity checks, while fewer per plant, are mission-critical in freeze-drying, lyophilization, and aseptic isolator applications where airborne spores threaten product sterility. Failures here often force terminal sterilisation or outright batch discard, so operators rely on hypersensitive acoustic modules fine-tuned for low-flow vent filters. Looking forward, integrators plan to co-locate integrity analytics with real-time pressure and conductivity sensors, forming closed-loop control networks that can trigger automated hold-points if mid-batch filter stress exceeds validated envelopes. Such digital twins will extend the leadership of liquid filtration in the Filter Integrity Test market while giving air-side applications a more predictive QA toolset.
Geography Analysis
North America Filter Integrity Test Market
North America led the Filter Integrity Test market with 39.10% share in 2025, anchored by stringent FDA oversight and continuous biologics pipeline funding. Mandated data-integrity audits catalyze replacement cycles toward 21 CFR Part 11-ready instruments. Biotech clusters across Massachusetts and North Carolina embed automated testers into digitally native “factory-of-the-future” footprints, raising regional penetration rates. High vaccine-fill volumes sustain recurrent service contracts that boost aftermarket revenue streams.
Europe Filter Integrity Test Market
Europe follows closely, propelled by EMA Annex 1’s compulsory PUPSIT clause that elevates test counts per filter to an all-time high. Investments such as Merck KGaA’s €62 million Darmstadt QC facility expand local capacity for on-site calibration, shortening downtime for German and Swiss manufacturers. Sustainability discourse intensifies R&D into recyclable polymer housings and bio-based membranes, offering longer-term differentiation to European suppliers.
APAC Filter Integrity Test Market
Asia-Pacific is the fastest-growing region with a 6.41% CAGR projected through 2031 as China, India, and South Korea race toward global GMP parity. Large-scale CDMO campuses in Shanghai, Hyderabad, and Daejeon standardize on automated testers to satisfy prospective U.S. and EU regulators. Government incentives covering up to 40% of equipment expenditures accelerate adoption, positioning APAC to narrow the installed-base gap with mature markets. Simultaneously, rising semiconductor fabrication in Singapore and Taiwan opens adjacent revenue channels for ultrapure-water filter testing, broadening geographic demand diversity across the Filter Integrity Test market.
Regulatory Landscape
Sterilizing-grade filtration integrity testing operates within global sterile manufacturing GMP expectations, with regional differences in how pre-use verification is handled. In Europe, the EU GMP Annex 1 revision (effective August 2023) explicitly requires Pre-Use Post-Sterilization Integrity Testing (PUPSIT) for sterilizing-grade filters in aseptic processing unless an alternative is justified through documented risk assessment. This requirement pushes manufacturers toward automated, recipe-driven testing and full electronic record retention.
In the United States, FDA guidance for sterile drug products produced by aseptic processing treats integrity testing as a core control (commonly at installation and post-use), but it does not mandate PUPSIT in the same prescriptive way as Annex 1. This creates a planning gap for global supply chains serving both EU and US markets. Standards used across sterile barrier and aseptic processing validation, including ISO 11607-1:2020/A1:2023 for sterile barrier systems and ISO 13408-2 for sterilizing filtration, reinforce risk management, validated test methods (for example, bubble point and forward flow/diffusive flow), and traceable documentation. As a result, demand increases for integrity test platforms that support 21 CFR Part 11 and EU Annex 11 data integrity requirements.
Competitive Landscape
The Filter Integrity Test industry displays moderate concentration, with the top five vendors controlling roughly 55% of global revenue. Strategic M&A reinforces scale advantages: Thermo Fisher’s USD 4.1 billion purchase of Solventum’s filtration assets augments its chromatography and testing portfolio and deepens end-to-end biologics workflows. Danaher combined Cytiva and Pall into a USD 7.5 billion bioprocess entity, unifying media, filtration, and integrity-test offerings and pledging USD 1.5 billion for capacity expansions across 13 sites.
Technology differentiation centers on embedded analytics, AI-driven anomaly detection, and Ethernet-enabled edge connectivity. New patents cover acoustic resonance methods that can detect micro-cracks below 2 µm without wetting agents.
Vendors pair hardware with cloud-based compliance dashboards offering real-time audit readiness, an increasingly decisive factor in CDMO purchasing. Smaller specialists emphasize service responsiveness and filter-specific calibration libraries to remain competitive. Overall, pricing remains stable as quality-assurance imperatives outweigh cost savings in purchasing decisions.
Filter Integrity Test Industry Leaders
-
Merck KGaA
-
3M
-
Sartorius AG
-
Meissner Filtration Products Inc.
-
Thermo Fisher Scientific, Inc.
- *Disclaimer: Major Players sorted in no particular order
Filter Integrity Test Market Companies Covered in this Report
- 3M
- Donaldson Company
- Eaton
- Filter Integrity
- Meissner Filtration Products
- Merck
- Pall
- Parker Hannifin
- Sartorius
- Thermo Fisher Scientific
- Danaher
- Porvair Filtration Group
- Critical Process Filtration Inc.
- Cobetter Filtration Group
- Single Use Support GmbH
- Sterlitech
- Ace Filtration Systems
Market Opportunities and Future Outlook
A requirement-driven opportunity sits at the intersection of Annex 1-linked PUPSIT adoption and contamination-risk minimization during sterile-side setup. That creates demand for integrated solutions that reduce manual handling while preserving validated integrity verification. Evidence from industry and peer-reviewed work in 2025-2026 points to risk-based validation designs that simulate PUPSIT, along with operational requirements such as error-proofing and automated wetting and flushing for single-use or preassembled flow paths. Providers that bundle integrity testing with simplified, closed processing steps are therefore positioned to meet buyer priorities.
Digital compliance and audit-readiness features also influence purchasing decisions as manufacturers align integrity testing with electronic batch records, MES/LIMS connectivity, and tamper-evident data capture to meet regulators' data integrity expectations. Systems that support automated PUPSIT-capable workflows and standardized, non-destructive methods (bubble point, diffusive flow/forward flow, pressure hold/decay, and water intrusion where relevant), backed by robust validation packages aligned to recognized filtration standards (for example, ASTM F838 correlations used in bacterial retention validation), tend to fit active upgrade cycles. This is particularly relevant in multi-site biopharmaceutical networks and fast-scaling outsourced manufacturing footprints.
Recent Industry Developments in Filter Integrity Test Market
- April 2026: Merck KGaA announced an expansion of its Peenya, Bengaluru manufacturing facility to add new production lines for filtration hardware systems and Pellicon 2 ultrafiltration cassettes. The added local capacity supports bioprocess filtration supply continuity and shortens lead times for aseptic manufacturing supply chains that depend on validated filtration components.
- February 2025: Thermo Fisher Scientific acquired Solventum’s purification and filtration business for USD 4.1 billion, adding membrane and filtration assets oriented to biologics manufacturing workflows. The deal broadened Thermo Fisher’s filtration and related testing portfolio, strengthening integration across upstream and downstream processing steps that drive integrity test volumes.
- October 2024: Asahi Kasei Medical launched the Planova FG1 virus-removal filter with higher flux for biologics processing. Higher-throughput virus filtration shifts process design toward larger campaign volumes and higher filter utilization, which raises the need for robust integrity testing and validation practices around critical filtration steps.
Filter Integrity Test Market Report Scope and Research Methodology
Market Definition and Coverage
This market is defined as revenues earned from equipment and systems used to verify whether air or liquid filters meet integrity requirements before or during use, mainly in regulated and quality-sensitive processes. We include both manual and automated testing sold for routine quality control and validation needs.
Scope exclusions: We exclude upstream filtration media manufacturing, broader cleanroom monitoring tools, and generic lab test instruments that are not primarily used for filter integrity verification.
Segments Covered in This Report
- By Product Type
- Manual
- Automated
- By Test Type
- Bubble Point Test
- Diffusion / Forward-Flow Test
- Pressure / Hold Test
- Water Intrusion Test
- Other Tests Types
- By Mechanism
- Pressure-based
- Marker-based
- Visualization
- Acoustic / Sonic
- By Filter Type
- Liquid Filters
- Air / Gas Filters
- By End Users
- Pharmaceutical and Biotechnology Companies
- Contract Manufacturing Organizations
- Other End Users
- By Application
- Liquid Filtration Integrity
- Air Filtration Integrity
- Geography
- North America
- United States
- Canada
- Mexico
- Europe
- Germany
- United Kingdom
- France
- Italy
- Spain
- Rest of Europe
- Asia-Pacific
- China
- Japan
- India
- Australia
- South Korea
- Rest of Asia-Pacific
- Middle East & Africa
- GCC
- South Africa
- Rest of Middle East & Africa
- South America
- Brazil
- Argentina
- Rest of South America
- North America
Data Sources, Market Sizing, and Validation
Desk Research
Desk work starts by mapping where integrity testing is expected, then outlining how testing is carried out across sterile processing and other filtration-heavy lines. We reference public sources such as US FDA guidance pages, USP chapters, EMA documents, and WHO technical reports to track when integrity tests are expected and how often they appear in standard operating practices.
On the supply side, we reviewed SEC filings and annual reports, investor decks, product catalogs, and reputed press, then used patent databases and import-export statistics where available to understand shipment direction and product mix. A paid subscription focused on company financials and a separate paid patent data subscription were used selectively to speed up validation checks. The sources mentioned above are illustrative rather than exhaustive, and we also used additional public materials for data collection, validation, and research clarification.
Primary Interviews and Surveys
Primary inputs were collected through expert discussions and structured questionnaires with a mix of equipment suppliers, service providers, and end users that perform filtration steps in regulated environments. These interviews were used to confirm adoption of automated systems versus manual methods, typical testing frequency by filter type, and the practical price bands by region before final assumptions were set.
Distribution of primary research fieldwork respondents
| Company type | Respondent position | Region |
|---|---|---|
| Top tier: 38% | CXOs: 18% | APAC: 42% |
| Mid tier: 43% | Functional/Unit leaders: 24% | EMEA: 37% |
| Smaller Players: 19% | Managers: 58% | Americas: 21% |
Market-Sizing & Forecasting
Sizing is built using a top-down and bottom-up combination, where the main build starts from the regulated filtration demand pool and converts it into test volumes and value. For the top-down path, we reconstruct expected testing activity using indicators such as biopharma production capacity additions, the installed base of filtration skids and single-use assemblies, the typical integrity test frequency per batch or campaign, and the mix shift between liquid and air filter testing.
To keep the totals realistic, we then corroborate them with selective bottom-up approximations, including sampled ASP bands for manual versus automated systems, channel feedback on replacement cycles, and supplier-side splits by region where interview inputs were consistent. When a country or small end-user group has thin data, we handle it through proxying from similar regulatory maturity and manufacturing intensity, then adjust using local price and adoption feedback.
For forecasting, scenario analysis is applied around capacity expansion timing and the speed of automation adoption, and then the central case is aligned to expert consensus on how audit trail expectations and validation workload are shifting. Key variables tracked include GMP inspection intensity signals, expansion of sterile fill-finish lines, single-use penetration, and the automation share within installed test systems.
Data Validation & Update Cycle
Validation checks whether the model outputs align with independent signals such as regional bioprocess expansion news, import trends for testing equipment categories, and observed pricing and product availability patterns. If a jump appears inconsistent, we re-check unit assumptions, currency conversion timing, and whether a one-time project is incorrectly treated as recurring demand.
Before sign-off, results are reviewed through multi-step analyst checks, and follow-up calls are triggered when interview feedback shows a clear variance on ASP ranges or adoption shares. The reports are refreshed annually, with interim updates when material events occur, such as major regulatory changes or large capacity buildouts. Right before delivery, a final pass is done so clients receive the latest updated view.
Mordor Intelligence's Filter Integrity Test Market Size Compared With Other Published Estimates
Published market sizes for filter integrity testing can vary because different studies mix products and services differently, choose different base years, and handle automation and validation demand assumptions in their own ways. Currency timing and how regional adoption is averaged also affect whether the total is higher or lower.
The main gap comes from whether recurring integrity testing tied to regulated filtration runs is counted separately from broader filtration quality checks, and Mordor Intelligence only counts revenue directly linked to integrity verification for air and liquid filters, with manual and automated systems kept as distinct price patterns.
Benchmark comparison
| Source | Market Size | Gaps in Research Methodology |
|---|---|---|
| Mordor Intelligence | USD 0.09 B (2026) | |
| Global Consultancy A | USD 0.10 B (2025) | Uses a 2025 base year and a broader end-use mix that can pull in adjacent filtration quality-control spending, which lifts the value even when integrity testing intensity per line stays flat. |
| Industry Publisher B | USD 0.09 B (2026) | Starts from 2026 but applies a higher uniform automation ASP progression across regions, which can reduce visible method-level differences between manual and automated systems. |
The spread across sources is mostly explained by scope edges and how pricing and automation shares are carried forward year to year. By keeping the demand pool tied to regulated filtration activity and then checking it against practical ASP and replacement signals, we provide a transparent total that can be replicated with clear inputs.
Key Questions Answered in the Report
What is the projected value of the Filter Integrity Test market by 2031?
The Filter Integrity Test market is set to reach USD 114.29 million by 2031, expanding at a 5.16% CAGR.
Which test type is growing fastest in upcoming years?
Water intrusion testing is the fastest-growing test type, posting a 7.12% CAGR through 2031.
Why are automated integrity testers gaining traction?
Automated systems generate electronic audit trails, cut human error, and now account for 56.88% market share with a 7.52% growth rate.
Which region will expand quickest?
Asia-Pacific is forecast to grow at a 6.41% CAGR thanks to large-scale biopharmaceutical capacity expansion and GMP harmonization.
How are sustainability concerns affecting integrity testing?
EU and North American regulations focusing on plastic waste spur R&D into recyclable filter housings and bio-based membranes, influencing future equipment specifications.
Who recently invested heavily in filter technology capacity?
Danaher earmarked USD 1.5 billion to expand Cytiva and Pall manufacturing across 13 locations, underscoring confidence in long-term demand.