
Fiberglass Fabric Market Size and Share
Market Overview
| Study Period | 2020 - 2031 |
|---|---|
| Market Size (2026) | USD 12.53 Billion |
| Market Size (2031) | USD 16.88 Billion |
| Growth Rate (2026 - 2031) | 6.13 % |
| Fastest Growing Market | Asia Pacific |
| Largest Market | Asia Pacific |
| Market Concentration | High |
Major Players *Disclaimer: Major Players sorted in no particular order Image © Mordor Intelligence. Reuse requires attribution under CC BY 4.0. | |
Fiberglass Fabric Market Analysis by Mordor Intelligence
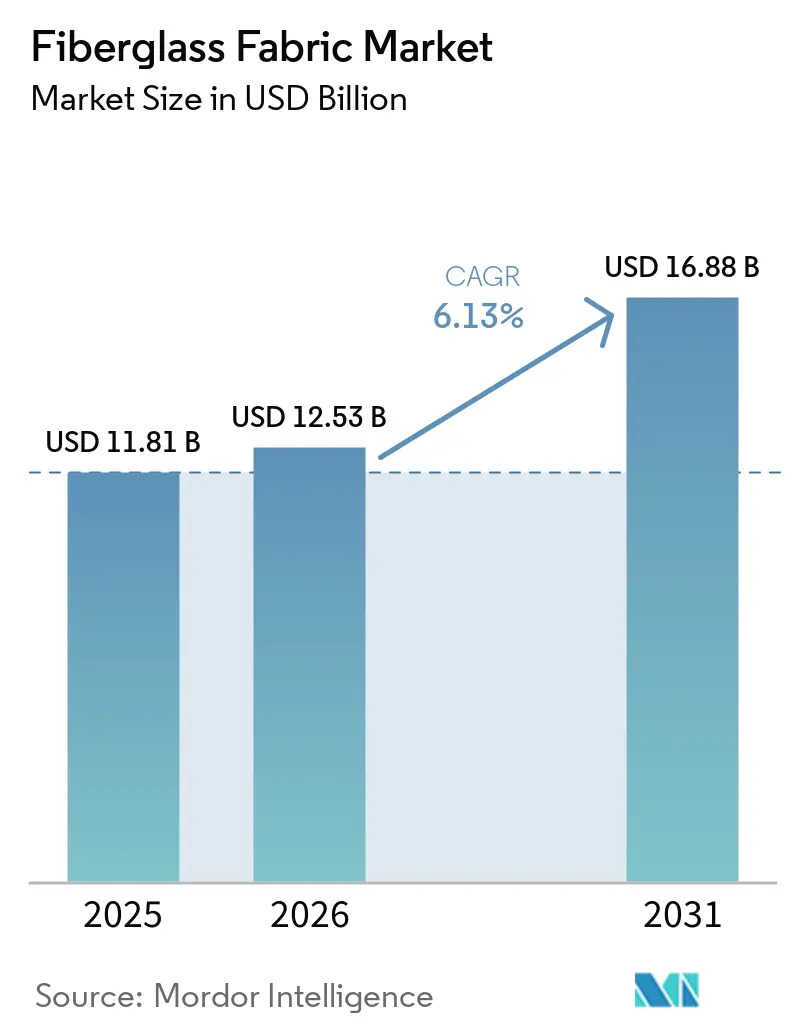
The fiberglass fabric market size is expected to grow from USD 11.81 billion in 2025 to USD 12.53 billion in 2026 and is forecast to reach USD 16.88 billion by 2031 at 6.13% CAGR over 2026-2031. Broadly adopting lightweight composites in wind-turbine blades, automotive structures, and aerospace interiors underpins steady volume gains as end users pursue fuel efficiency and lower life-cycle costs. Cost-effectiveness and ample raw-material availability give fiberglass fabrics a competitive edge over carbon-fiber and aramid reinforcements, while progress in zero-carbon melting furnaces reduces manufacturing emissions and strengthens the material’s sustainability profile. OEMs in construction, electronics, and marine sectors also leverage woven and non-woven fiberglass to meet tightening energy-efficiency and durability codes, expanding overall addressable demand. Meanwhile, regulatory scrutiny—such as California’s 2027 ban on fiberglass in mattresses—prompts producers to accelerate recycling programs and bio-based product lines, keeping the fiberglass fabric market resilient and adaptable.
Key Report Takeaways
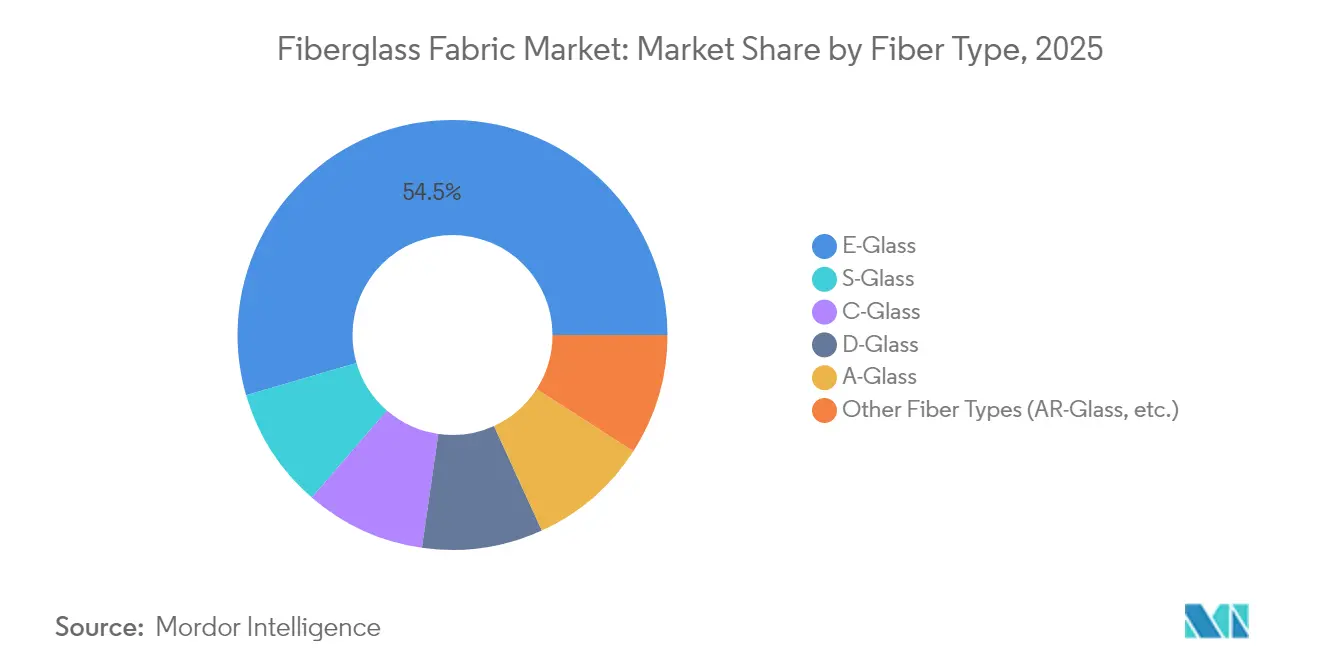
- By fiber type, E-Glass held 54.52% of the fiberglass fabric market share in 2025, while S-Glass is advancing at a 6.69% CAGR through 2031.
- By fabric type, woven structures accounted for 48.62% of the fiberglass fabric market size in 2025; non-woven fabrics exhibit the fastest CAGR at 6.39% through 2031.
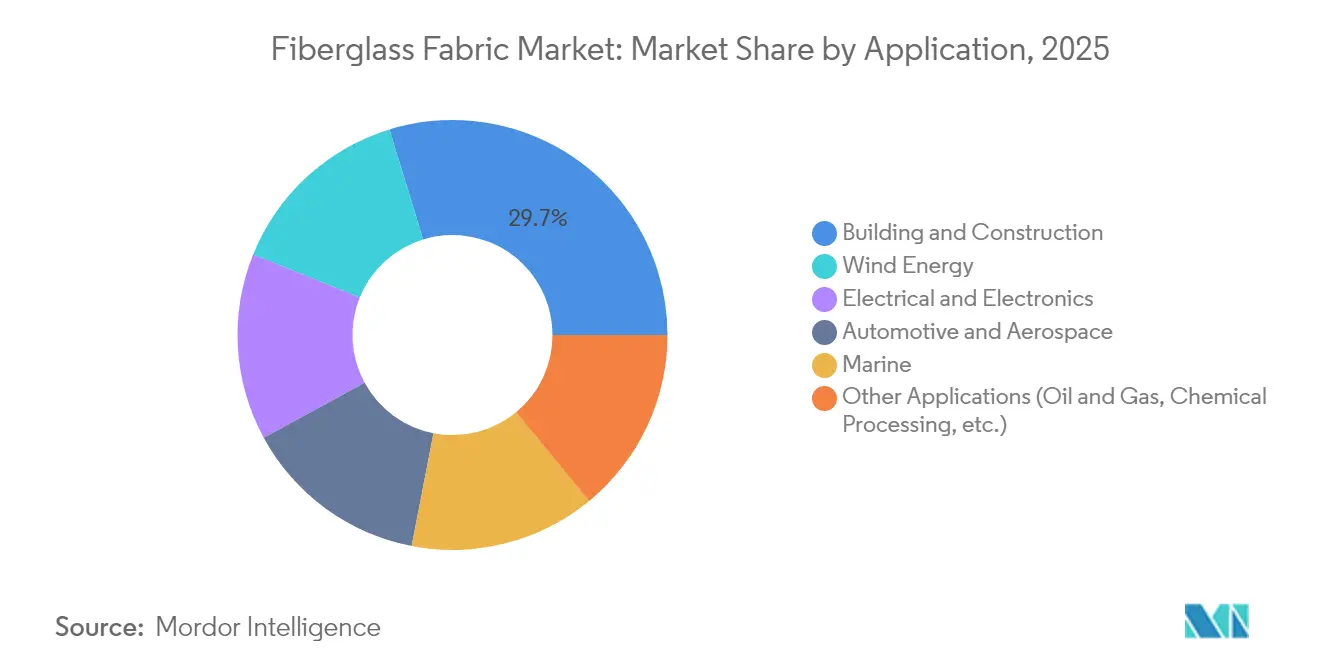
- By application, building and construction led with 29.74% revenue share in 2025, whereas wind energy is projected to grow at a 7.02% CAGR to 2031.
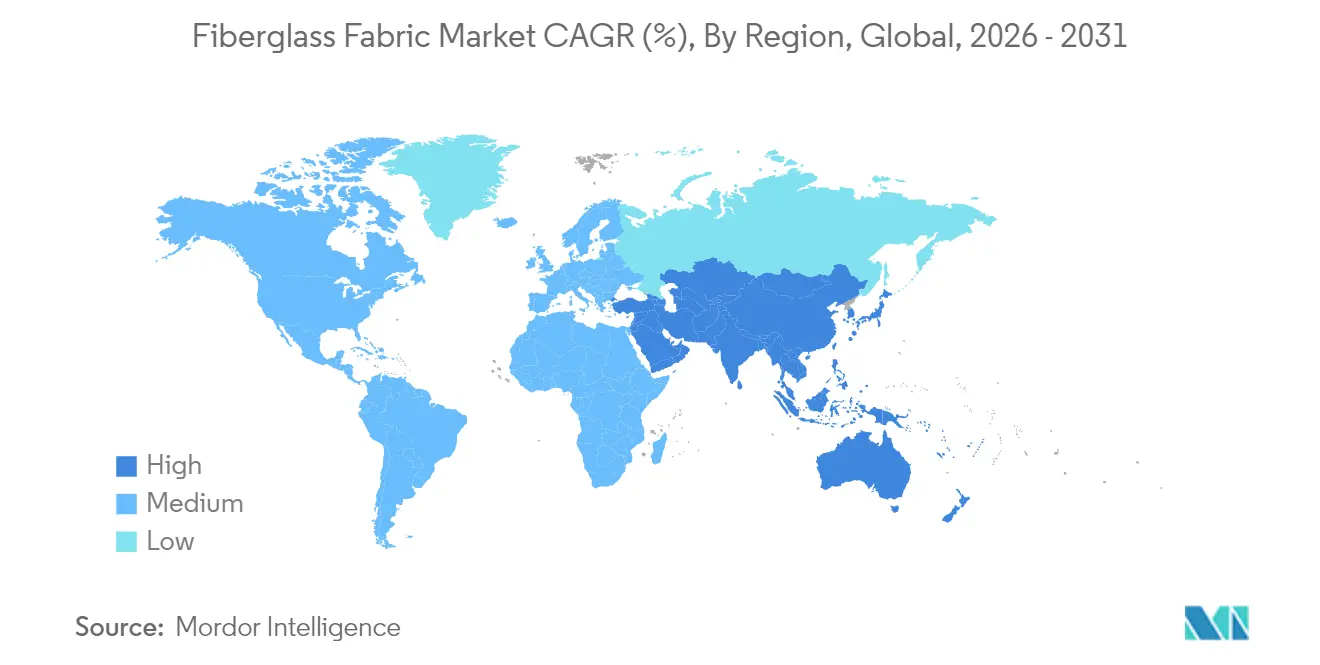
- By geography, Asia-Pacific commanded 41.47% share of the fiberglass fabric market in 2025 and is expanding at a 6.93% CAGR to 2031.
Note: Market size and forecast figures in this report are generated using Mordor Intelligence’s proprietary estimation framework, updated with the latest available data and insights as of 2026.
Market Trends and Insights
Drivers Impact Analysis of Fiberglass Fabric Market*
| Driver | (~) % Impact on CAGR Forecast | Geographic Relevance | Impact Timeline |
|---|---|---|---|
| Growing demand for lightweight, high-strength materials in automotive & aerospace | +1.8% | Global, with concentration in North America, Europe, and Asia-Pacific | Medium term (2-4 years) |
| Expansion of wind-energy installations | +2.1% | Global, led by Asia-Pacific and Europe offshore markets | Long term (≥ 4 years) |
| Energy-efficient buildings boost insulation textiles demand | +1.2% | North America & Europe, expanding to Asia-Pacific urban centers | Medium term (2-4 years) |
| Electronics miniaturization driving EMI-shielding fabrics | +0.9% | Asia-Pacific core, spill-over to North America tech hubs | Short term (≤ 2 years) |
| Retrofitting of industrial chimneys | +0.6% | Europe and North America industrial regions | Long term (≥ 4 years) |
| Source: Mordor Intelligence | |||
Growing demand for lightweight materials in automotive & aerospace
Automakers and aerospace firms increasingly use lightweight materials to meet stringent regulations and enhance performance. In the United States, new fuel-economy and emissions rules for 2027-2032 are driving global supply chains to prioritize weight reduction. Ford exemplifies this trend with its composite C-brace in the Bronco Raptor, incorporating fiberglass-reinforced brackets and under-body panels that reduce mass without compromising safety. In civil aviation, a Dutch consortium is progressing toward validating fully composite liquid-hydrogen tanks by 2025, emphasizing the industry's reliance on high-strength glass fabrics for cryogenic containment. The strategic importance of these materials is further highlighted by private-equity investments, such as AURELIUS acquiring Teijin Automotive Technologies North America in 2024 for over USD 1 billion to leverage their lightweighting expertise. While natural-fiber composites offer up to 60% lower greenhouse gas emissions, they currently lack the mechanical consistency of fiberglass, reinforcing fiberglass's position in safety-critical applications.
Expansion of wind-energy installations
The Global Wind Energy Council recorded 117 GW of new capacity in 2024, with 8.8% annual growth expected through 2030. Blade lengths surpassing 115 m, such as Vestas’ V236 design, elevate material-volume requirements per turbine and favor hybrid E-Glass and S-Glass lay-ups that manage cost and stiffness targets. Local content policies accelerate manufacturing shifts; Kineco Exel Composites began supplying pultruded glass–carbon planks from Goa in late 2025 for Asian offshore projects. Polyurethane-carbon spar-cap technology, qualified by Dow and Vestas, achieves cure rates above 90%, yet most shear webs retain glass-fiber cores for robustness. Although SGL Carbon noted a 35.2% sales decline to wind customers due to raw-material inflation, glass-fiber suppliers benefit from substitution to lower-price reinforcements, bolstering the fiberglass fabric market.
Energy-efficient buildings boost insulation textiles demand
Fiberglass insulation captures 71% of U.S. residential installations because it meets ENERGY STAR targets at a competitive cost[1]. Retrofit activity in commercial metal buildings broadens sales, especially for laminated glass-fiber rolls specified under ASHRAE 90.1 standards. California’s Assembly Bill 1059 bans textile fiberglass in mattresses and upholstered furniture from 2027, influencing manufacturers to develop encapsulated or surface-treated formats that mitigate fiber-emission concerns[2]. New polyurea resins also reduce labor and mold costs by replacing certain fiberglass lay-ups in architectural elements, yet glass fabrics remain preferred for fire-resistant insulation jackets in high-rise façades. Improving furnace efficiency and higher recycled cullet ratios further lower embodied energy, aligning the material with green-building schemes.
Electronics miniaturization driving EMI-shielding fabrics
Next-generation 5G and IoT devices raise electromagnetic-compatibility thresholds, stimulating demand for glass cloths coated with nanocarbon or metal oxides that provide >20 dB shielding effectiveness at gigahertz frequencies. Asian contract manufacturers integrate these fabrics into flexible printed-circuit laminates for smartphones and vehicle control units. Research into non-circular glass-fiber cross-sections shows 15-20% higher transverse stiffness, enabling thinner laminates without sacrificing rigidity. Commercial viability depends on scaling modified bushing plates; producers that master such technologies can access premium niches while defending share against conductive polymer films.
Restraints Impact Analysis of Fiberglass Fabric Market*
| Restraint | (~) % Impact on CAGR Forecast | Geographic Relevance | Impact Timeline |
|---|---|---|---|
| Raw-material & energy cost volatility | -1.4% | Global, with acute impact in energy-intensive regions | Short term (≤ 2 years) |
| Rising competition from carbon & basalt fiber fabrics | -0.8% | High-performance applications globally, concentrated in aerospace and automotive | Medium term (2-4 years) |
| Costly end-of-life fiberglass disposal regulations | -0.6% | Europe and North America, expanding to Asia-Pacific developed markets | Long term (≥ 4 years) |
| Source: Mordor Intelligence | |||
Raw-material & energy cost volatility
Glass melting consumes significant natural-gas and electricity inputs; spikes in European energy prices during 2023-2024 squeezed margins despite Sibelco’s 22% EBITDA rise from portfolio mix improvements. Silica-sand prices trend upward as 380 million t global output faces higher logistics and permitting costs[3]. U.S. EPA rules for wool-fiberglass furnaces require continuous chromium-emission monitoring, adding compliance capital to North American plants[4]. Producers hedge volatility through captive renewable-energy assets; China Jushi’s zero-carbon plant integrates a 200 MW wind farm to stabilize power supply. Process scrap recycling, such as Johns Manville’s 10,000 t program in Slovakia, offsets virgin-glass demand and buffers cost swings.
Rising competition from carbon & basalt fiber fabrics
Automotive demand for carbon fiber may triple to 32,000 t by 2025, enticing large investments like Zhongfu Shenying’s USD 866 million expansion that adds 30,000 t annual capacity. Basalt fiber offers roughly 15% greater tensile strength than E-Glass at room temperature, although it loses more stability above 300 °C, limiting turbine-exhaust applications. Wind-blade OEMs increasingly specify carbon-fiber spar caps; Nordex awarded Fiberline its biggest contract yet for Delta4000 blades, eroding some glass demand. Nevertheless, recycled carbon fiber still struggles with length-consistency and cost, and many mass-market products stay anchored to glass reinforcement, sustaining the fiberglass fabric market.
*Our forecasts treat driver/restraint impacts as directional, not additive. The impact forecasts reflect baseline growth, mix effects, and variable interactions.
Fiberglass Fabric Market Segment Analysis
By Fiber Type:
E-Glass dominance faces S-Glass innovationE-Glass maintained 54.52% market share in 2025 due to mature global supply networks and unit costs below USD 5/lb that meet mainstream engineering targets. S-Glass, advancing at the fastest CAGR of 6.69%, captures aerospace, defense, and rotorcraft parts where 30-35% higher tensile strength justifies its premium pricing. Specialty grades such as E6 enhanced glass bridge some performance gaps, while bioabsorbable glass fibers add opportunities in medical textiles. Suppliers balancing E- and S-Glass capacity can flex volume toward the most profitable mixes through 2031.
Adoption of AR-Glass for cement reinforcement and C-Glass for chemical containment remains steady, whereas D-Glass continues niche growth in high-dielectric radar radomes. Developers of non-circular cross-sections seek to commercialize kidney-shaped and trilobal filaments that exhibit 12-18% higher flexural stiffness at similar weight, yet require new weaving parameters. E-Glass remains the anchor product, and the fiberglass fabric market preserves supply security via multi-continent melter networks.

By Fabric Type:
Woven structures lead despite non-woven growthWoven fabrics captured 48.62% of revenue in 2025, underscoring their versatility for uni- and biaxial laminates in hulls, automotive hood liners, and aircraft flooring panels. Plain-weave and twill styles offer predictable drape and dimensional accuracy, and recent multi-end rovings enhance surface aesthetics for Class-A exterior panels.
Non-woven fabrics expand at the fastest CAGR of 6.03% as battery separators, filtration elements, and non woven glass fiber prepreg applications scale. Continuous-filament mats achieve isotropic strength, favoring large-surface insulation jackets, whereas chopped-strand mats support closed-mold pool production. Additive manufacturing opens a frontier: 3D-printed glass-fiber preforms reduce waste by matching load paths directly, and prototype boats built via Continuous Fiber Manufacturing validate marine potential. Woven and non-woven innovations widen fabric-type choices and strengthen the fiberglass fabric market against competitive substitutes.
By Application:
Construction Dominance Challenged by Wind Energy SurgeBuilding and construction applications command 29.74% market share in 2025, driven by fiberglass's dominance in residential insulation, accounting for 71% of US home installations due to superior thermal conductivity properties and regulatory compliance with ENERGY STAR standards. The segment's strength extends to commercial applications, including metal building insulation systems that enhance energy efficiency in industrial structures. However, regulatory headwinds from California's 2027 ban on textile fiberglass in mattresses and furniture are prompting innovation in alternative materials and safer production processes.
Wind energy emerges as the fastest-growing application at 7.02% CAGR through 2031, propelled by the Global Wind Energy Council's reported 117 GW of new installations in 2024 and projected 8.8% industry growth through 2030. Automotive and aerospace applications benefit from lightweighting mandates, with EPA emissions standards and CAFE requirements driving composite adoption in chassis components and structural elements. Electrical and electronics applications are expanding due to miniaturization trends requiring EMI shielding capabilities, while marine applications are experiencing innovation through 3D printing technologies and sustainable material development. Oil and gas, chemical processing, and other industrial applications continue to rely on fiberglass for corrosion resistance and structural integrity in harsh operating environments.
Geography Analysis
APAC Fiberglass Fabric Market
Asia-Pacific generated 41.47% of 2025 global revenue and leads future growth with a 6.93% CAGR, propelled by China’s scale and India’s infrastructure stimulus. China Jushi’s USD 812 million zero-carbon furnace complex elevates regional capacity to 400,000 t and provides local customers faster delivery cycles. Southeast Asian economies attract foreign OEMs seeking tariff advantages, and Vietnam’s coastal industrial parks host new woven-fabric looms that shorten European wind-blade lead times. India’s “Make in India” push encourages glass-fiber producers to partner with state governments on greenfield melts, ensuring raw-material availability for domestic rotor factories.
North America Fiberglass Fabric Market
North America benefits from federal tax credits that extend wind-farm deployments and building-insulation retrofits. U.S. composite shipbuilders also stimulate demand for stitched multiaxial glass fabrics that lower weight while improving impact tolerance in workboats. Meanwhile, the fiberglass fabric market size for the region remains under expansion as automotive OEMs prototype glass-thermoplastic door modules to comply with updated CAFE standards.
Europe Fiberglass Fabric Market
Europe experiences mixed signals: a softer residential-construction cycle restrains short-term insulation textiles, yet offshore-wind targets and aerospace ramp-ups sustain baseline volume. The U.K. enforces anti-dumping duties up to 99.7% on Chinese and Egyptian fabrics, prompting EU buyers to diversify toward Turkish and local producers, thereby adjusting supply chains. Regulatory focus on circularity spurs investments in glass recycling, with German plants piloting high-purity cullet streams that feed new E-Glass pulls.
South America and MEA Fiberglass Fabric Market
South America’s composite pipe and tank markets grow gradually as oil majors modernize corrosion-resistant infrastructure in Brazil. Regional wind-farm auctions in Chile and Colombia call for 100-m onshore blades, opening opportunities for local fabric conversion. The Middle East & Africa region remains a smaller slice, yet United Arab Emirates desalination projects specify glass-fiber composite gratings for corrosion resistance, anchoring a steady, if niche, demand profile across arid climates.
Regulatory Landscape
Fiberglass fabric manufacturing and downstream conversion are shaped by air-emissions, worker-safety, product-standard, and trade measures across major regions. In the United States, the Environmental Protection Agency maintains National Emission Standards for Hazardous Air Pollutants for fiberglass operations under 40 CFR Part 63 Subpart HHHH (updated through March 2026), reinforcing monitoring and control requirements at qualifying facilities. Workplace exposure and handling requirements are governed through OSHA regulations under 29 CFR 1910 and general hazard communication expectations for fibrous glass and composites in production and fabrication settings.
Quality and performance requirements increasingly reference harmonized test methods and national standards for textile glass and prepreg products. China issued GB/T 44295-2024 for epoxide woven E-glass prepreg (effective December 1, 2024) and GB/T 25042-2024 for fiberglass membrane materials (effective May 1, 2025), supporting consistent specifications in electronics and construction-adjacent uses. In Europe, trade policy remains a key variable for woven and stitched fiberglass fabrics, with the European Commission cited as implementing definitive anti-dumping duties in June 2026 on certain imports from multiple origins, influencing sourcing strategies and intra-regional supply chain planning.
Value Chain Analysis
The value chain spans mineral and chemical inputs (silica-rich feedstocks and additives), energy-intensive melting and fiberizing, yarn or roving conversion, weaving or non-woven formation, and finishing or coating (including resin-compatible sizings), before reaching composite part fabricators and end-use OEM supply chains. Capacity and cost positioning are heavily influenced by furnace energy economics and access to stable power. Upstream petrochemical dynamics also affect binders and compatible resin systems used in coated or laminated fiberglass fabrics. Equipment availability can further constrain output, since high-precision loom installations can involve multi-year lead times, limiting how quickly producers can relieve tightness in specialized fabric categories such as electronic-grade glass cloth.
Downstream, converters and composite manufacturers incorporate fabrics into prepregs, laminates, insulation jackets, and reinforcement kits, then supply sectors including wind energy, automotive and aerospace composites, electronics laminates, and construction reinforcements. Industry signals point to more indexed and risk-managed procurement approaches to manage energy and petrochemical volatility, alongside price actions in Europe during 2026 amid tighter import availability. Vertically integrated players, and firms adding smart-manufacturing capability such as China Jushi expanding electronic-grade output in Huai'an, are reinforcing tighter coupling between fiber production and high-spec fabric supply for electronics and advanced applications.
Competitive Landscape
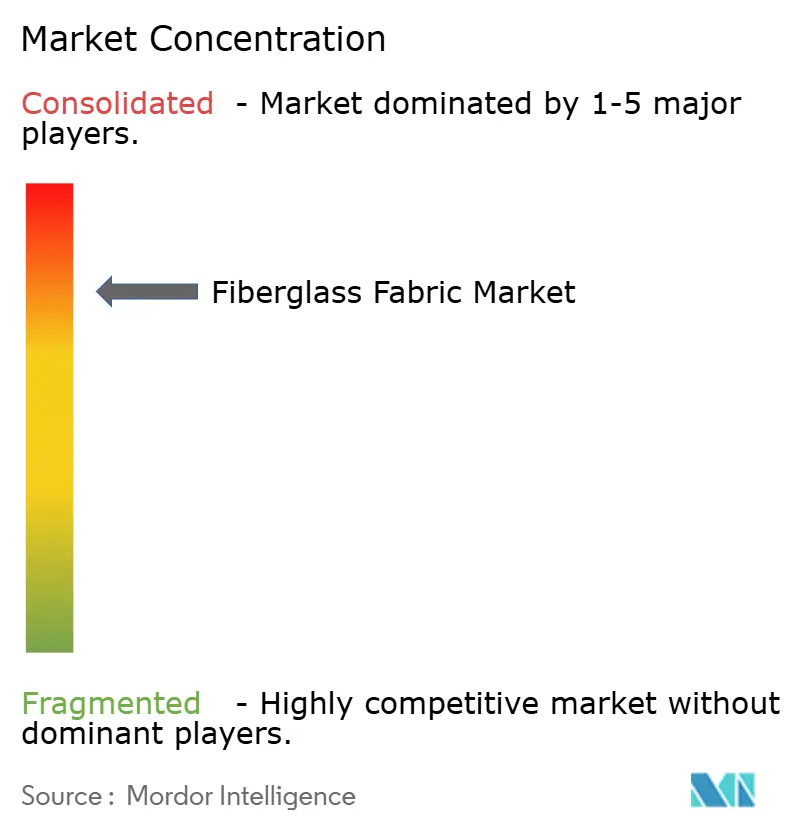
The global supply chain is highly consolidated and dominated by a few vertically integrated players managing melting, yarn production, and fabric weaving, ensuring cost efficiency and quality control. Owens Corning’s USD 755 million divestiture of its glass-reinforcements division to Praana Group in 2024 reshaped North American leadership and emphasized building-material synergies. China Jushi maintains cost leadership through scale, backward integration, and renewable energy use. Competitive differentiation focuses on low-carbon production, closed-loop recycling, and advanced fabric architectures like ±45° triaxials. Technological advancements, including AI-driven batching and digital twin modeling, enhance operational efficiency, while EMI shielding and compostable glass opportunities attract agile innovators.
Fiberglass Fabric Industry Leaders
-
Owens Corning
-
Hexcel Corporation
-
China Jushi Co., Ltd.
-
Saint-Gobain
-
Chongqing Polycomp International (CPIC)
- *Disclaimer: Major Players sorted in no particular order
Fiberglass Fabric Market Companies Covered in this Report
- Ahlstrom
- BGF Industries Inc.
- Central Glass Co. Ltd
- China Jushi Co., Ltd.
- Chongqing Polycomp International (CPIC)
- CTG Group
- Fulltech Industries Corp.
- Hexcel Corporation
- Johns Manville
- Mid-Mountain Materials Inc.
- Owens Corning
- Saertex GmbH & Co. KG
- Saint-Gobain
- Taiwan Electric Insulator Co. Ltd
Market Opportunities and Future Outlook
Electronic-grade fiberglass and specialty fabrics for electronics and electrification create specific whitespace, particularly where capacity additions and localization initiatives are already taking shape. China Jushi commissioned a major electronic-grade fiberglass and electronic fabric line in Huai'an in March 2026 (100,000 metric tons of electronic-grade fiberglass and 390 million meters of electronic fabric), and followed with a May 2026 investment announcement to add another Huai'an line (50,000 tons of electronic-grade glass fibers and 320 million meters of electronic cloth). These moves support a shift toward higher-frequency, thinner, and tighter-tolerance materials used in advanced electronics infrastructure and connected-vehicle supply chains, which expands the addressable need for premium glass cloth formats and surface-treated fabrics.
Sustainability-linked manufacturing and circularity also offer differentiation opportunities as disposal and emissions scrutiny tightens. Owens Corning commissioned its first circular glass fiber production line (SUSTAINA LOOP) at L’Ardoise, France in December 2025 after a USD 7.5 million investment, offering a concrete pathway for lower-waste production models that can fit OEM and construction-specifier sustainability screening. In North America, new manufacturing investments broaden local supply options for fiberglass-based materials: IKO North America opened a USD 500 million facility in Chester County, South Carolina in March 2026 combining fiberglass and glass mat production, while Fibrosan broke ground in July 2026 on a new Michigan manufacturing facility targeted for operation by March 2027. Taken together, these developments point to opportunities around localized supply, lower-emissions production claims, and specification-driven adoption in construction and industrial composite applications where sourcing security and environmental documentation increasingly influence supplier selection.
Recent Industry Developments in Fiberglass Fabric Market
- May 2026: China Jushi announced a CNY 4.43 billion (USD 653 million) investment to add a second production line at its Huai'an base for electronic-grade glass fibers and electronic cloth. The expansion targets higher-spec glass fabrics used in advanced electronics value chains, tightening the link between fiber production and premium fabric availability for PCB and related applications.
- May 2025: Tech-Fab Europe, a EuCIA member, published a life cycle assessment on glass fiber fabrics focused on the environmental benefits of building a robust European supply chain. The study strengthened procurement-facing documentation for composites customers and supported supplier differentiation around verified sustainability metrics.
- October 2024: California advanced enforcement timelines around AB 1059, which bans textile fiberglass use in mattresses, juvenile products, and upholstered furniture effective January 1, 2027. The policy direction accelerated product redesign and safer-format development among suppliers serving bedding and upholstered applications, while pushing alternative material choices and encapsulated fiberglass solutions.
Fiberglass Fabric Market Report Scope and Research Methodology
Market Definition and Coverage
This market covers revenue earned from fiberglass fabric sold as woven or nonwoven fabric made from glass filaments, used as reinforcement in composites and industrial laminates across major end uses globally.
Scope exclusions: It excludes finished composite parts, resin systems sold separately, and general glass fiber insulation mats that are not sold as fiberglass fabric.
Segments Covered in This Report
- By Fiber Type
- S-Glass
- C-Glass
- D-Glass
- A-Glass
- E-Glass
- Other Fiber Types (AR-Glass, etc.)
- By Fabric Type
- Woven Fiberglass Fabrics
- Non-Woven Fiberglass Fabrics
- By Application
- Automotive and Aerospace
- Building and Construction
- Wind Energy
- Electrical and Electronics
- Marine
- Other Applications (Oil and Gas, Chemical Processing, etc.)
- By Geography
- Asia-Pacific
- China
- India
- Japan
- South Korea
- Rest of Asia-Pacific
- North America
- United States
- Canada
- Mexico
- Europe
- Germany
- United Kingdom
- France
- Italy
- Rest of Europe
- South America
- Brazil
- Argentina
- Rest of South America
- Middle East and Africa
- Saudi Arabia
- South Africa
- Rest of Middle East and Africa
- Asia-Pacific
Data Sources, Market Sizing, and Validation
Desk Research
Desk work starts by building a clean view of demand signals that reliably move fiberglass fabric consumption. We review public sources such as U.S. Geological Survey glass and mineral statistics, UN Comtrade trade flows for glass fiber products, U.S. International Trade Commission data, World Bank macro indicators, and standards and guidance published by bodies such as ASTM.
To keep the model anchored in real industry behavior, we also use annual reports, investor presentations, and plant and expansion announcements from manufacturers and key downstream users. Patent databases and selected peer reviewed materials journals are used to track shifts in reinforcement architectures, weave preferences, and resin compatibility claims that can change mix and pricing. In a few places, paid subscriptions for company financials and news are used to cross-check timelines and revenue exposure, and the sources listed here are illustrative and not exhaustive.
Primary Interviews and Surveys
Primary work is used to pressure test the desk assumptions and to fill gaps where public data is coarse, especially around fabric pricing ranges, capacity utilization, and how demand shifts by end use. We speak with manufacturers, converters, distributors, and technical stakeholders across APAC, EMEA, and the Americas so our inputs reflect regional differences in construction, wind, marine, and electronics demand.
Distribution of primary research fieldwork respondents
| Company type | Respondent position | Region |
|---|---|---|
| Top tier: 25% | CXOs: 15% | APAC: 49% |
| Mid tier: 59% | Functional/Unit leaders: 31% | EMEA: 29% |
| Smaller Players: 16% | Managers: 54% | Americas: 22% |
Market-Sizing & Forecasting
Sizing is built using a top-down model where production and trade signals are reconciled with end-use activity, and the implied consumption pool is converted to value using validated pricing bands. In practice, we link demand to a few clear drivers such as wind blade installations, construction composite reinforcement activity, marine and transportation build cycles, and printed circuit board and electronics laminate output.
The value side is shaped using average selling price ranges by fabric type (woven versus nonwoven) and by common glass types used in reinforcement (for example E-glass versus higher performance grades), and then adjusted for mix changes reported by industry contacts. To keep totals realistic, the outputs are corroborated with selective bottom-up approximations such as supplier revenue exposure checks, sampled volume times ASP calculations, and channel feedback on regional pricing moves. Where a bottom-up view is incomplete, gaps are handled by applying conservative penetration and utilization assumptions that were validated in interviews.
For the forecast, we rely on scenario analysis supported by a light multivariate regression, where the key drivers are projected using published outlooks and then reviewed against what practitioners expect for capacity additions and pricing progression. When inputs pull in different directions, a short set of sensitivity cases is run so the final numbers remain explainable on a client call.
Data Validation & Update Cycle
Validation is done by checking the model against independent signals, including trade directionality, known capacity additions, and end-use growth rates that should show up in fiberglass fabric demand. Outliers are flagged, worked through with a second analyst review, and then rechecked with a small set of follow-up calls when the variance cannot be explained by mix or currency effects.
Each report is refreshed annually, and interim updates are made when material events occur, such as major plant start-ups, sustained price movements, or demand shocks in wind or construction. Before delivery, a final pass is completed to confirm the latest public releases and the most recent interview feedback are reflected in the current year numbers.
Mordor Intelligence's Fiberglass Fabric Market Sizing Compared With Other Published Estimates
Published market sizes for fiberglass fabric can look far apart even when they all describe the same general material family. The differences usually come from what each study counts as fiberglass fabric revenue, how it treats adjacent materials, and which year and currency timing is used for conversion.
Finished composite components are a common add-on in some studies, and that inclusion can lift totals quickly when aerospace, wind blades, or marine parts are counted as market revenue. Another gap comes from how nonwoven categories are treated, since some sources group insulation mats into the same bucket, and pricing assumptions also vary when higher performance grades are blended into an average.
Benchmark comparison
| Source | Market Size | Gaps in Research Methodology |
|---|---|---|
| Mordor Intelligence | USD 11.81 B (2025) | |
| Global Consultancy A | USD 14.93 B (2025) | Likely counts a wider revenue pool by folding in composite and GFRP related value captured beyond fabric sales, and it also uses a different base year chain that can raise the 2025 carry-forward. |
| Industry Publisher B | USD 11.01 B (2024) | Uses an earlier base year and may apply more conservative price bands, and it can also differ on whether nonwoven insulation-type mats are treated as fabric or separated from reinforcement-grade fabrics. |
Finished composite parts sit outside Mordor Intelligence's scope, which helps explain why some published totals rise when downstream value is added on top of fabric sales. When the scope is kept at fabric revenue and the inputs are traced to installation, construction activity, and electronics laminate signals, the result is easier to reconcile with trade and capacity checks and to update consistently year to year.
Key Questions Answered in the Report
What is the current Fiberglass Fabric Market size?
The fiberglass fabric market is valued at USD 12.53 billion in 2026 and is projected to reach USD 16.88 billion by 2031 on a 6.13% CAGR trajectory.
Which region leads the fiberglass fabric market?
Asia-Pacific holds the largest regional share at 41.47% in 2025 and is also expanding fastest at a 6.93% CAGR through 2031.
Which application segment is growing the fastest?
Wind energy is the fastest-growing application segment, projected at a 7.02% CAGR because of rising offshore-turbine deployments.
How are environmental regulations affecting the market?
Regulations such as California’s AB 1059 and stricter EPA standards are incentivizing producers to invest in recycling, zero-carbon furnaces and safer fiber treatments, reshaping competitive strategies.