
Fiber Reinforced Composites Market Size and Share
Market Overview
| Study Period | 2020 - 2031 |
|---|---|
| Market Size (2026) | USD 108.28 Billion |
| Market Size (2031) | USD 152.19 Billion |
| Growth Rate (2026 - 2031) | 7.04 % |
| Fastest Growing Market | Asia Pacific |
| Largest Market | Asia Pacific |
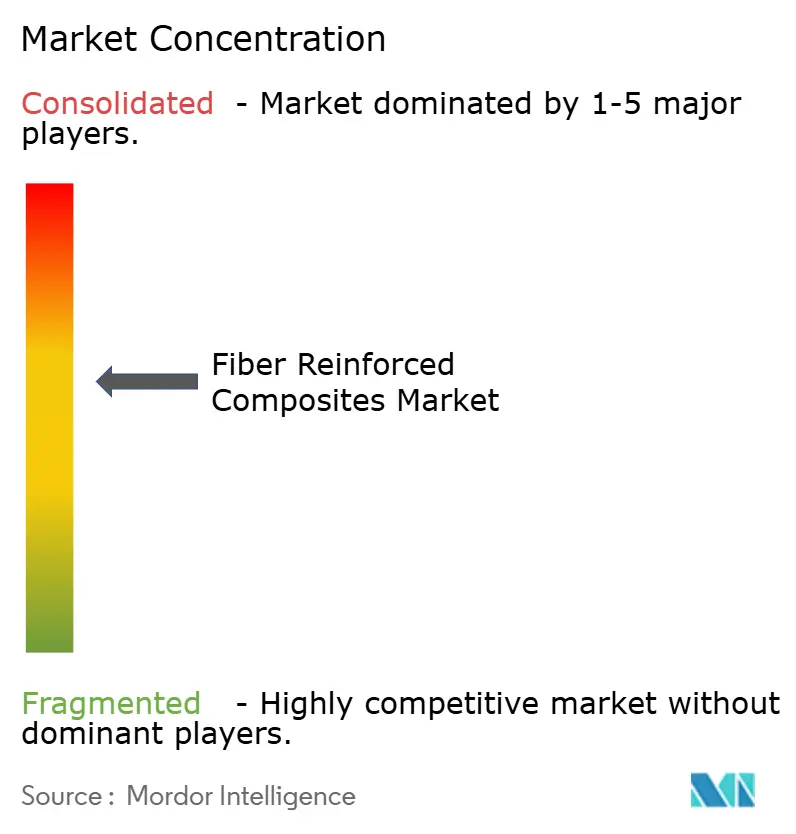
| Market Concentration | Medium |
Major Players *Disclaimer: Major Players sorted in no particular order Image © Mordor Intelligence. Reuse requires attribution under CC BY 4.0. | |
Fiber Reinforced Composites Market Analysis by Mordor Intelligence
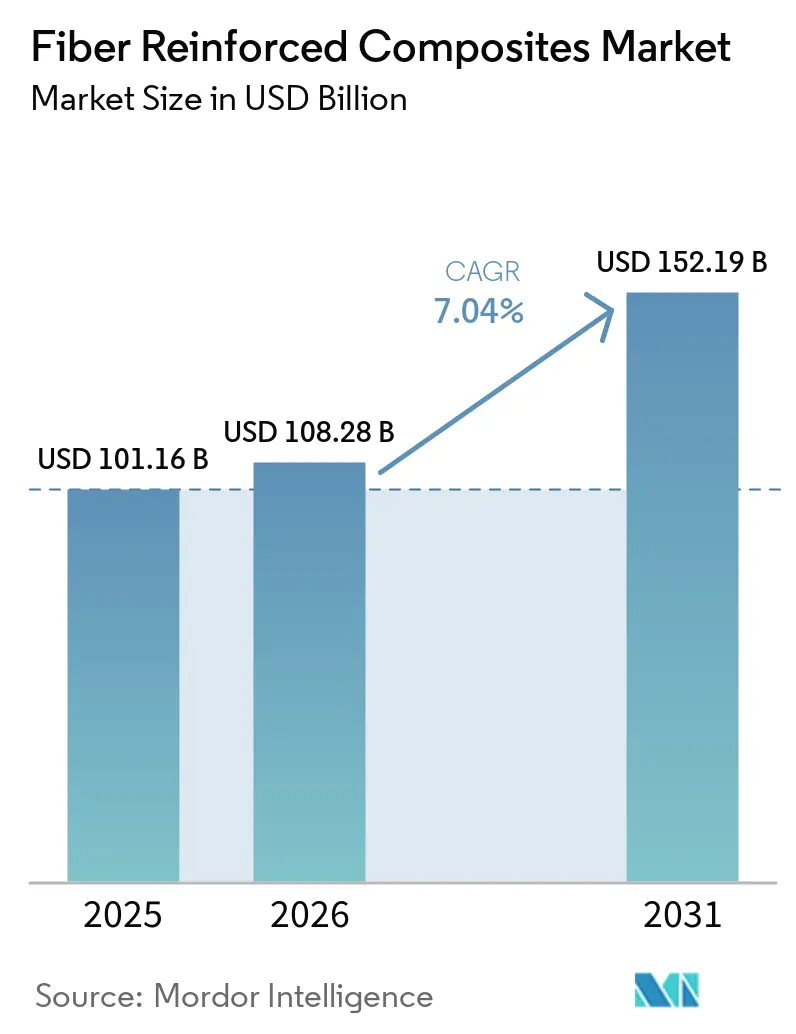
The fiber reinforced composites market size was valued at USD 101.16 billion in 2025 and estimated to grow from USD 108.28 billion in 2026 to reach USD 152.19 billion by 2031, at a CAGR of 7.04% during the forecast period (2026-2031). Robust demand originates from aviation programmes that allocate more than 50% of structural weight to composites, notably the Boeing 787 and Airbus A350 platforms[1]. Automakers pursuing Corporate Average Fuel Economy compliance and electric-vehicle range gains accelerate adoption of lightweight carbon laminates, while the wind sector’s push toward 100-meter blades further enlarges the fiber reinforced composites market[2]. Process automation deepens competitiveness, with automated fiber placement lines resolving labour shortages and consistency challenges. Regionally, Asia-Pacific leads on the back of China’s large-scale manufacturing capacity, although local overcapacity pressures linger even as India’s nascent aerospace ecosystem scales.
Key Report Takeaways
- By fiber type, glass fibers led with 61.22% revenue share in 2025; carbon fibers are poised to expand at an 7.86% CAGR through 2031.
- By matrix, polymer systems accounted for 69.78% share of the fiber reinforced composites market size in 2025, while metal matrix composites will increase at a 7.31% CAGR through 2031.
- By manufacturing process, lay-up methods held 25.64% of the fiber reinforced composites market share in 2025, whereas automated fiber placement is forecast to grow at an 7.92% CAGR to 2031.
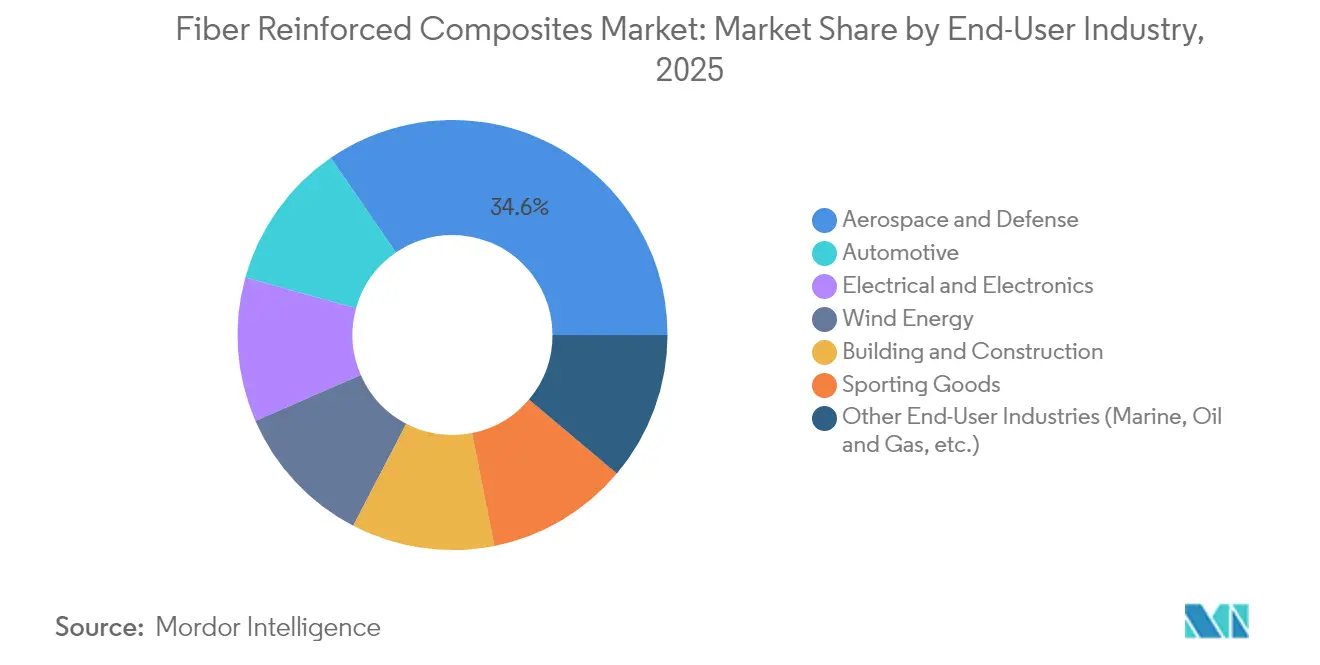
- By end-user industry, aerospace and defense captured 34.58% share in 2025; automotive applications represent the fastest growth at a 7.74% CAGR to 2031.
- By geography, Asia-Pacific dominated with a 40.46% share in 2025 and is set to climb at an 8.16% CAGR through 2031.
Note: Market size and forecast figures in this report are generated using Mordor Intelligence’s proprietary estimation framework, updated with the latest available data and insights as of 2026.
Global Fiber Reinforced Composites Market Trends and Insights
Drivers Impact Analysis*
| Driver | (~) % Impact on CAGR Forecast | Geographic Relevance | Impact Timeline |
|---|---|---|---|
| Growing aerospace composite demand | +1.8% | Global, concentrated in North America & Europe | Medium term (2-4 years) |
| Wind-turbine blade length upsizing | +1.2% | Global, led by Europe & China | Long term (≥ 4 years) |
| Automotive lightweighting mandates | +1.5% | North America & EU regulatory zones | Short term (≤ 2 years) |
| Infrastructure rehab with FRP rebar | +0.8% | North America & Asia-Pacific | Long term (≥ 4 years) |
| Rapid-layup thermoplastic UD tape lines | +0.9% | Global manufacturing hubs | Medium term (2-4 years) |
| Carbon-capture derived acrylonitrile feedstock | +0.3% | Europe & North America early adopters | Long term (≥ 4 years) |
| Source: Mordor Intelligence | |||
Growing Aerospace Composite Demand
Commercial programmes target 50% composite content to secure 15–20% fuel-burn reductions, and eVTOL designs push that ratio even higher. Hexcel’s commercial aerospace revenue jumped 21.3% in 2024 on wide-body build rates, yet supply chain tightness tempers near-term deliveries. NASA’s HiCAM effort aims to multiply output rates for thermoset and thermoplastic fuselages, signaling a structural demand uplift. Parallel R&D on fully composite cryogenic tanks for liquid-hydrogen propulsion opens new sub-segments for the fiber reinforced composites market. Together, these shifts cement aerospace as a medium-term growth catalyst.
Wind-Turbine Blade Length Upsizing
Blade lengths now exceed 100 meters, demanding carbon spar caps to retain stiffness without weight penalties. The U.S. Big Adaptive Rotor project underscores this trajectory, while hybrid natural-synthetic fibre blends improve lifecycle sustainability. New polyurethane-carbon pultrusion lines from Dow achieve 90% in-line cure, boosting throughput for oversized laminates. Global capacity is forecast to reach 981 GW by 2030, yet recycling end-of-life blades remains unresolved, inviting circular-economy innovation.
Automotive Lightweighting Mandates
EPA rules for model years 2027-2032 and parallel CAFE targets oblige 2% annual efficiency gains, making carbon composites integral to battery-electric platforms. AFP adoption has lowered cycle times and enabled General Motors to shave mass from body-in-white structures. Ford’s composite C-brace on the 2022 Bronco Raptor validated crash and stiffness benefits under off-road abuse. Battery enclosures now capitalise on composites’ weight and thermal-runaway resistance, further expanding the fiber reinforced composites market.
Infrastructure Rehab with FRP Rebar
Corrosion-free CFRP rebar outperforms steel at one-quarter the weight, translating to thinner covers and extended bridge lifecycles. Valley Metro documented 23% total savings and a 110-day schedule cut on its light-rail extension using FRP reinforcement asce.org. Self-sensing cement enhanced with carbon fibres delivers gauge factors near 40, allowing embedded monitoring of structural health. Transportation regulators across North America and Asia-Pacific are mainstreaming GFRP bar specifications, sustaining long-term demand.
Restraints Impact Analysis*
| Restraint | (~) % Impact on CAGR Forecast | Geographic Relevance | Impact Timeline |
|---|---|---|---|
| High raw-material & processing costs | -1.40% | Global, acute in emerging markets | Short term (≤ 2 years) |
| Difficulties in Recycling | -0.80% | Europe & North America regulatory pressure | Medium term (2-4 years) |
| Performance defects due to water absorption and low fire resistance | -0.60% | Global, critical in marine & aerospace applications | Medium term (2-4 years) |
| Source: Mordor Intelligence | |||
High Raw-Material & Processing Costs
Energy-intensive carbonisation drives elevated input costs, although lignin-based precursors from the University of Manchester suggest 3–5 × savings potential. Traditional AFP systems list at USD 3–6 million, but modular leasing models lower the entry barrier. SGL Carbon’s 35.2% sales drop in fiber units shows sensitivity to volatile commodity pricing. Recycled carbon fibre, requiring far less energy, can relieve some pressure while preserving mechanical properties.
Difficulties in Recycling
End-of-life turbines and aircraft could yield 840,300 tonnes of CFRP waste annually by 2050, versus sub-100,000 tonnes recycling capacity today. Acetolysis methods depolymerise epoxy-amine matrices at room temperature, fully recovering fibre quality. Ambient-air pyrolysis keeps 73.3% tensile strength after 500 °C treatment, making industrial adoption feasible. EU directives push OEMs toward such solutions, prompting OEM partnerships like Boeing’s carbon-fibre reclamation network.
*Our forecasts treat driver/restraint impacts as directional, not additive. The impact forecasts reflect baseline growth, mix effects, and variable interactions.
Segment Analysis
By Fiber Type: Carbon Drives Innovation Despite Glass Dominance
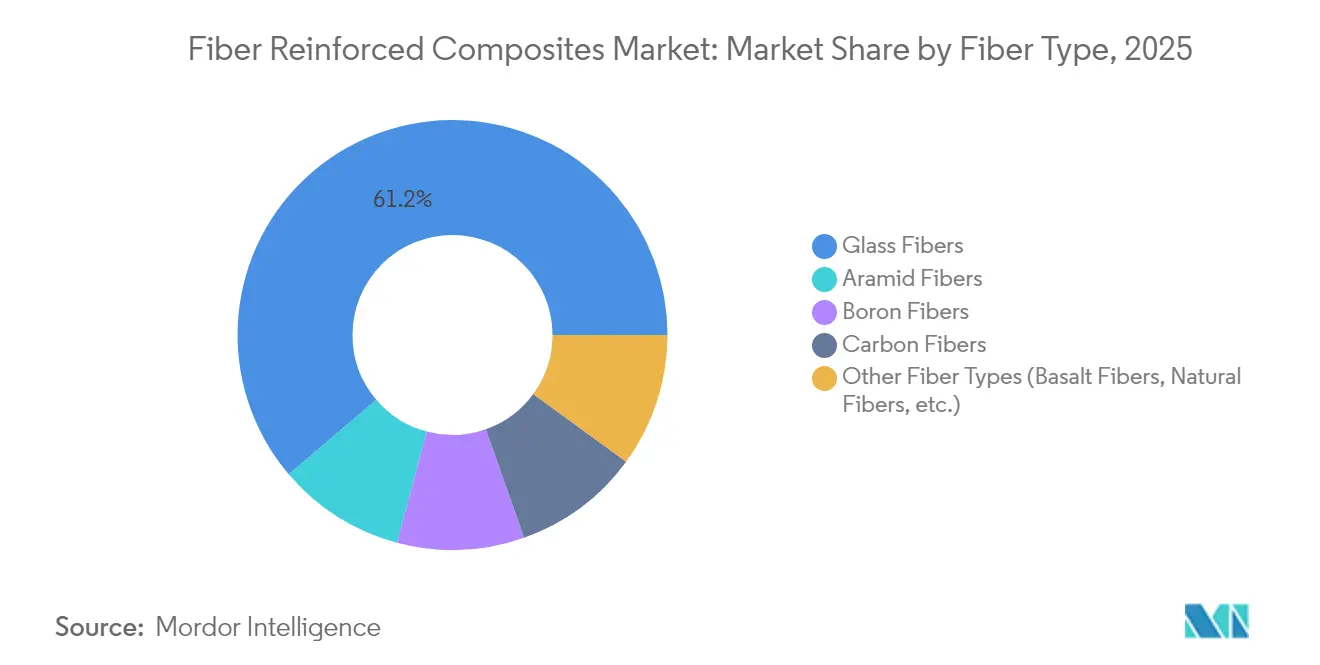
In 2025, glass fibers dominated the market with a 61.22% share, driven by cost efficiencies and robust supply chains in the construction, automotive, and wind energy sectors. While holding a smaller share, carbon fibers are projected to grow at a CAGR of 7.86% through 2031, supported by increasing demand in the aerospace and high-performance automotive industries. Aramid fibers, known for their impact resistance and thermal stability, are primarily used in protective equipment and aerospace components. Despite their higher costs, Boron fibers are utilized in specialized aerospace applications. The adoption of natural fibers is increasing through hybrid composites that combine synthetic and natural fibers, offering environmental benefits while maintaining performance. For example, bamboo and sisal fibers are used in wind turbine blades.
Advancements in manufacturing are transforming fiber production economics. The CARBOWAVE project has introduced microwave-assisted carbon fiber production, reducing energy consumption by up to 70%, potentially altering cost structures and environmental impacts. Saudi Arabia has established the first industrial-scale facility for graphene-enriched carbon fiber production, targeting aerospace, automotive, and construction applications, with projected revenues exceeding USD 1.6 billion by 2030. Basalt fibers are emerging as a sustainable alternative, offering superior mechanical properties and environmental resistance compared to natural fiber composites. Additionally, their cost advantages over carbon fibers make them suitable for offshore wind applications requiring durability in harsh environments.

By Matrix: Polymer Dominance Faces Advanced-Material Challenge
In 2025, polymer systems accounted for 69.78% of the revenue, while metal matrix options are projected to achieve a 7.31% CAGR, highlighting their sustained importance in the fiber reinforced polymer composites market, particularly for aerospace thermal-management applications. Ceramic matrix composites developed by GE enhance jet engine operating temperatures, improving fuel efficiency by up to 20%. Additionally, carbon-carbon materials are critical for components exposed to hypersonic re-entry and fusion reactors, where endurance at 2,000 °C is essential.
Rapid-cycle thermoplastics, such as polycarbonate, PEKK, and PEEK, are gaining traction due to their recyclability and capability for one-minute press molding. Covestro has introduced continuous-fiber polycarbonate panels targeting the consumer electronics sector. Furthermore, NREL has demonstrated a bio-based epoxy that reduces greenhouse gas emissions by 40% compared to petrochemical-based resins while maintaining production cost efficiency. Mitsubishi Chemical has also developed a ceramic composite capable of withstanding temperatures of 1,500 °C, meeting JAXA specifications for launch vehicles and creating new revenue opportunities in the defense and space sectors.
By Manufacturing Process: Automation Transforms Traditional Methods
In 2025, lay-up maintained a 25.64% market share, while automated fibre placement experienced significant growth, recording an impressive 7.92% CAGR. This trend highlights the increasing focus on labor productivity within the fiber-reinforced composites market. Engel and Fill have successfully developed thermoplastic tape cells, achieving one-minute takt times across 30 tapes and incorporating camera-based quality validation. Meanwhile, pultrusion lines utilizing polyurethane resin systems have achieved a notable 90% in-line cure rate, significantly enhancing output for wind-blade spar caps.
Additive manufacturing is transforming the industry by integrating continuous fibre deposition with in-situ thermoset curing. This advancement not only reduces material waste but also expands design possibilities. In a significant development, the University of Delaware's capillary-fed process secured funding from NASA to advance heat-shield applications in spacecraft. Additionally, injection-compression lines, combining SABIC's Digital Composites platform with Airborne automation, are scaling up composite applications in laptops and vehicle trims. On another front, Cygnet Texkimp's robotic filament winding is effectively supporting 10-meter structures at steep lay-up angles, enabling advancements in hydrogen storage and yacht mast programs.
By End-User Industry: Aerospace Leadership Meets Automotive Growth
Aerospace and defense commanded 34.58% of 2025 turnover and remain the technical vanguard, yet automotive volumes will rise fastest at 7.74% CAGR, driven by battery-electric platforms requiring aggressive mass-offsetting strategies. Wind-energy purchasing eased in 2024 due to logistics bottlenecks, but the long-term pivot to 15-MW offshore turbines ensures a stable call on carbon spar cap supply.
In civil infrastructure, FRP rebar and stay-in-place formwork enhance bridge durability, bolstered by transportation authorities approving non-corroding reinforcement. Rail composites support lightweighting in transportation applications. Electronics miniaturisation benefits from high dielectric strength laminates, and sports equipment remains a steady niche for premium fibres. TPI Composites surpassed the 100,000-blade milestone, applying machine-learning cures that shorten cycle times by 25%.
Geography Analysis
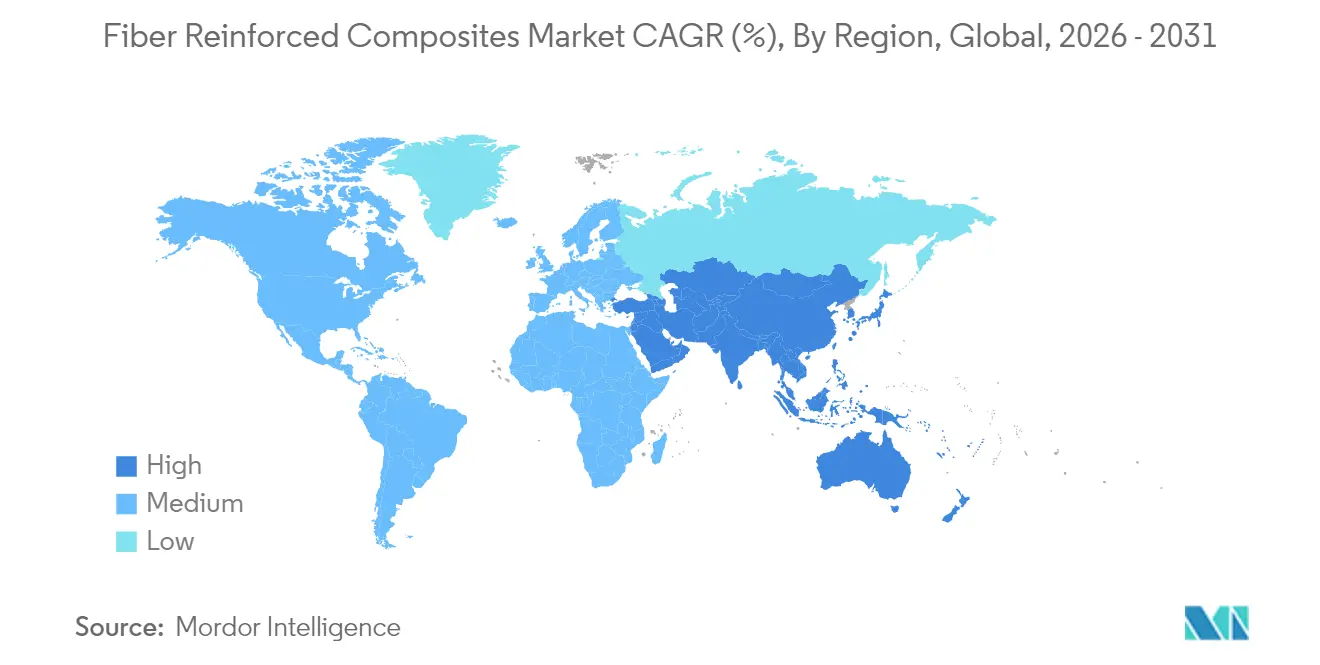
Asia-Pacific generated 40.46% of 2025 sales and is set to post an 8.16% CAGR, ensuring that the fiber reinforced composites market remains anchored in the region. China’s HRC invested USD 33.8 million in Changshu to expand serial thermoset and thermoplastic part output, while India’s Kineco Exel now supplies pultruded carbon planks to Vestas from its Goa site. Taiwan’s Swancor has localised resin plate supply for offshore projects, deepening the regional value chain.
North America leverages an entrenched aerospace base and fuel-economy regulation to maintain demand. GKN Aerospace doubled assembly capacity in Chihuahua, Mexico, adding 200 jobs to serve Gulfstream and HondaJet programmes. Safran expanded LEAP engine capacity in Querétaro, underscoring Mexico’s rise as a composites manufacturing node. MIT researchers developed “nanostitching” with carbon nanotubes, lifting interlaminar shear by 62% and hinting at further light-weighting gains. Europe champions recycling mandates and low-carbon material innovation. The Clean Sky 2 FRAMES project validated xenon flashlamp AFP heating for PEEK and PEKK wingskins, while Strata and Solvay opened the first MENA prepreg plant for Boeing 777X parts in Al Ain, UAE. Brazil’s composites turnover rose 5.6% to USD 560 million in 2024, pointing to latent growth potential across South America.
Value Chain Analysis
The value chain starts with upstream feedstocks and conversion into reinforcement fibers (glass, carbon, aramid, basalt, and natural fibers) and matrix systems (epoxy, polyester/vinyl ester, and high-performance thermoplastics such as PEEK/PEKK/PAEK, plus niche metal and ceramic matrices). Midstream players convert fibers and resins into intermediate forms such as fabrics, UD tapes, prepregs, and compounds, then into structural parts through lay-up, filament winding, pultrusion, RTM, compression/injection molding, and automated fiber placement (AFP). Downstream qualification and long-term supply security are tightly linked to end users including aerospace and defense, automotive, wind energy, construction (including FRP rebar), and electronics, where OEMs and Tier suppliers shape material selection, certification pathways, and sourcing requirements.
Recent supply-chain actions point to two recurring choke points: qualified aerospace materials availability and regional sourcing for strategic applications. In aerospace, supply security is being reinforced through multi-year agreements and qualification expansion, including Syensqo and Toray Composite Materials America signing a five-year global agreement in January 2026 to secure high-performance carbon fiber supply, and Toray Advanced Composites expanding NCAMP qualifications in May 2026 for its TC1225/TORAYCA T700 thermoplastic composite system. In electronics and industrial applications, localization is accelerating, as seen in AGY and JPS Composite Materials establishing a North American supply chain in February 2026 for low-CTE glass fiber fabric used in advanced IC substrates. Circularity efforts are also moving from pilots toward scaled conversion routes, such as Exel Composites expanding circular glass fiber use into commercial-scale pultrusion in 2026.
Competitive Landscape
The fiber reinforced composites market is moderately fragmented. Toray Industries, Hexcel, Owens Corning, and Mitsubishi Chemical Group lead on scale and vertical integration, but mid-tier entrants leverage automation or sustainability niches to differentiate. Hexcel recorded a 21.3% sales lift in commercial aerospace, reflecting volume recovery amid supply-chain knots. Owens Corning divested its glass-reinforcement unit to Praana Group for USD 755 million to sharpen its focus on building products, signalling ongoing portfolio realignment.
Technology-based disruptors attract capital: Boston Materials secured USD 13.5 million for its Z-axis Fibre architecture, with Mitsubishi Chemical’s venture arm joining the round. Saudi graphene-enhanced fibre lines illustrate sovereign diversification into advanced materials, aiming to capture electronics casings and EV battery housings. Automation investments remain pervasive, as OEMs converge on AFP, high-speed RTM, and Digital Composites lines to ensure repeatability and cost parity with aluminium stampings.
Fiber Reinforced Composites Industry Leaders
-
TORAY INDUSTRIES, INC
-
Hexcel Corporation
-
Solvay
-
SGL Carbon
-
Teijin Limited
- *Disclaimer: Major Players sorted in no particular order
Market Opportunities and Future Outlook
A key white-space area is the industrialization of high-rate manufacturing pathways that reduce cycle time and expand qualification coverage, particularly for aerospace structures and higher-volume mobility parts. In 2026, multiple suppliers advanced rapid-cure and thermoplastic systems aimed at higher throughput and faster certification, including Toray Composite Materials America introducing its 3960-FC fast-cure prepreg system (reported with cure-time reduction up to 45%) and Toray Advanced Composites expanding NCAMP qualifications for its TC1225 LMPAEK thermoplastic composite system. Together, these steps align with a broader shift away from autoclave-heavy production, since press molding, AFP/tape laying, and thermoplastic processing match build-rate requirements and labor productivity constraints.
Another opportunity area is the build-out and regionalization of carbon fiber capacity and grades (high-strength and high-modulus) to ease material tightness and reduce reliance on geopolitically concentrated sourcing. In 2026, evidence includes new and ramping capacity in China, such as Sinopec Shanghai Petrochemical bringing Phase I of a 30,000-ton large-tow carbon fiber project into production, and CNBM starting multiple high-performance production lines in Jiangsu, including a T1100-grade line, alongside European additions such as Toray Carbon Fibers Europe starting new capacity in Abidos, France (with full operational ramp referenced for the second half of 2026). Sustainability-linked whitespace is also concentrated in recycled and circular composite inputs and bio-based resin content. Product introductions such as Hexcel HexPly M949 (15% bio-based carbon content, announced in July 2026) and scaling initiatives around circular glass fiber systems indicate growing procurement pull from regulated and brand-sensitive end markets without requiring a full redesign of downstream part-making equipment.
Recent Industry Developments
- July 2026: Syensqo partnered with Bucci Composites to implement Syensqo DDF technology for mass production of automotive composite parts. The collaboration targets faster, more repeatable processing suited to series manufacturing, supporting wider use of fiber reinforced composites beyond low-volume programs.
- February 2026: Toray Composite Materials America achieved NCAMP qualification for its 3960 prepreg system, including a configuration using TORAYCA T1100 intermediate modulus carbon fiber for aerospace and defense applications. NCAMP qualification strengthens the material system credentials used in aircraft programs, helping reduce barriers tied to certification and approved-material lists.
- February 2025: Owens Corning finalized the sale of its glass fiber reinforcements business to Praana Group for USD 755 million. The divestment reshaped supplier portfolios in glass reinforcement and signaled continued restructuring in commodity-to-engineered composites value chains.
Research Methodology Framework and Report Scope
Market Definition and Coverage
This market covers the value of fiber reinforced composite materials and composite parts used in industrial and commercial applications, where a reinforcing fiber is combined with a matrix to deliver strength, stiffness, or corrosion resistance in the final product.
Scope exclusions: We exclude one-off repair kits, pure resin systems sold without reinforcement, and recycled composite scrap traded as waste.
Segmentation Overview
- By Fiber Type
- Carbon Fibers
- Glass Fibers
- Aramid Fibers
- Boron Fibers
- Other Fiber Types (Basalt Fibers, Natural Fibers, etc.)
- By Matrix
- Polymer Matrix Composites
- Metal Matrix Composites
- Ceramic Composites
- Carbon-Carbon Composites
- Hybrid Composites
- By Manufacturing Process
- Lay-Up (Hand/Spray)
- Filament Winding
- Pultrusion
- Resin Transfer Molding
- Automated Fiber Placement & Tape Laying
- Compression & Injection Molding
- 3D Printing / Additive Manufacturing
- By End-user Industry
- Aerospace & Defense
- Automotive
- Wind Energy
- Building & Construction
- Electrical & Electronics
- Sporting Goods
- Other End-user Industries (Marine, Oil and Gas, etc.)
- By Geography (Value)
- Asia-Pacific
- China
- Japan
- India
- South Korea
- ASEAN Countries
- Rest of Asia-Pacific
- North America
- United States
- Canada
- Mexico
- Europe
- Germany
- United Kingdom
- France
- Italy
- Rest of Europe
- South America
- Brazil
- Argentina
- Rest of South America
- Middle East
- Saudi Arabia
- South Africa
- Middle-East and Africa
- Asia-Pacific
Data Sources, Market Sizing, and Validation
Desk Research
Desk work starts by building a clean fact base on composites consumption, production, and end use activity. We refer to public sources such as USGS for minerals and metals context, the US Census Bureau and Eurostat for industrial output and trade series, UN Comtrade for cross border flow signals, and the International Energy Agency for power and renewables indicators that link with wind builds. For aerospace and automotive demand cues, we also review sources such as FAA publications and NHTSA releases, which help check build rates, safety rules, and lightweighting direction.
Company annual reports, investor presentations, and technical notes are used to understand product mix, capacity mentions, and any pricing commentary, and then these clues are compared with reputable press coverage and association websites where available. In parallel, we use paid subscriptions focused on company financials and intelligence, patent databases, and an import export shipment level database to sanity-check whether the direction of volumes and application hotspots is consistent. These desk sources are illustrative, and additional public references were consulted to collect data, cross-check assumptions, and clarify open questions.
Primary Interviews and Surveys
Primary work is used to stress-test what desk sources cannot fully show, especially current pricing behavior, substitution patterns, and adoption timing across end uses. We speak with a mix of raw material suppliers, composite fabricators, distributors, and procurement or engineering users across key demand regions, so we can reconcile capacity discussions with real order activity. Inputs from these discussions are then used to close gaps, confirm variable ranges, and align the final model assumptions.
Distribution of primary research fieldwork respondents
| Company type | Respondent position | Region |
|---|---|---|
| Top tier: 27% | CXOs: 14% | APAC: 42% |
| Mid tier: 52% | Functional/Unit leaders: 41% | EMEA: 32% |
| Smaller Players: 21% | Managers: 45% | Americas: 26% |
Market-Sizing & Forecasting
The core sizing uses a top-down approach where end use demand pools are reconstructed from build activity and output indicators, and then converted into composite value using penetration rates and typical material intensity by application. In practice, the model is anchored on variables such as aircraft and defense production cycles, vehicle output and lightweighting adoption, wind turbine additions, construction activity, and the split of fiber types and matrix choices that influence average selling prices. Where pricing is volatile, we normalize to annual average assumptions so currency timing and short spikes do not overstate the market.
Results are then cross-checked with selective bottom-up approximations, such as rolling up a sample of supplier revenues by application, checking channel feedback on volume movement, and applying sampled ASP times estimated tonnage for a few large use cases to see whether totals remain in a realistic band. When certain sub-markets have limited disclosure, gaps are handled by using proxy indicators like industrial production indices and trade flows, followed by expert adjustment so the implied shares do not drift from real procurement behavior. For forecasting, we mainly use scenario analysis supported by multivariate regression on the strongest demand drivers, and then the final growth path is aligned to what industry respondents consider achievable by region and end use.
Data Validation & Update Cycle
Model outputs are checked against independent signals like import export movement, end use production trends, and known capacity changes so abnormal jumps can be spotted early. If a region or application shows an unusual swing, we revisit the input variables, re-check conversion factors, and re-contact experts when the variance cannot be explained with public evidence. Before sign-off, the work is reviewed in more than one step so calculations, units, and currency treatment remain consistent across years.
Reports are refreshed annually, and interim updates are made when material events occur such as major capacity expansions, policy changes, or demand shocks in large end uses. Right before delivery, we perform a fresh pass on key assumptions and any recent macro or industry releases so clients receive the most up-to-date view available at that time.
Mordor Intelligence's Fiber Reinforced Composites Market Sizing Compared With Other Published Estimates
It is normal to see different market values for fiber reinforced composites because publishers do not always use the same boundaries, timing, and pricing logic. Differences usually come from what is counted as part of the market (materials only versus materials plus fabricated parts), how fibers and matrices are grouped, and whether pricing is treated as a single global average or allowed to vary by region and end use.
By tracking application-level demand signals and refreshing key pricing and penetration assumptions, Mordor Intelligence keeps the estimate tied to where composites are actually consumed, rather than mixing in adjacent resin-only sales or recycled scrap value. Gaps also show up when one study starts from a narrow set of end uses like aerospace and transport, or when forecasts are built from an aggressive scenario without cross-checking against wind builds, vehicle output, and industrial production direction. Currency conversion timing and the chosen base year can further widen spreads, even when the underlying growth story sounds similar.
Benchmark comparison
| Source | Market Size | Gaps in Research Methodology |
|---|---|---|
| Mordor Intelligence | USD 108.28 B (2026) | |
| Trade Publisher A | USD 60.34 B (2024) | Uses an earlier base year and a narrower value capture that can undercount fabricated composite parts, while pricing is often generalized across regions which shifts the total downward. |
| Global Consultancy B | USD 111.17 B (2026) | Uses a similar year but can differ on inclusions like specialty matrix systems and high-temperature composites, and may apply a different regional ASP progression and adoption curve by end use. |
The table shows that the spread is mostly explained by scope boundaries and the way pricing and adoption are carried through the model. When inputs are connected back to clear demand indicators and then checked against supply-side reality, the resulting market value becomes easier to follow, reproduce, and update as conditions change.
Key Questions Answered in the Report
What is the current size of the Fiber Reinforced Composites market?
The Fiber Reinforced Composites Market is valued at USD 108.28 billion in 2026 and is projected to rise to USD 152.19 billion by 2031.
Which region leads the fiber reinforced composites market?
Asia-Pacific held 40.46% share in 2025 and is advancing at an 8.16% CAGR through 2031.
Which end-use sector generates the highest demand?
Aerospace and defense applications led with 34.58% revenue share in 2025, owing to high composite content in new aircraft programmes.
What major restraint could slow market growth?
High raw-material and processing costs currently reduce the CAGR forecast by 1.40 percentage points, despite ongoing cost-reduction initiatives.
How are composites being recycled?
Emerging chemical depolymerization and optimized pyrolysis techniques now recover up to 93.5% of fiber modulus, although global recycling capacity still lags projected waste volumes.