
| Study Period | 2018 - 2030 |
| Base Year For Estimation | 2023 |
| Forecast Data Period | 2024 - 2030 |
| Market Volume (2024) | 35.59 Million Tons |
| Market Volume (2030) | 51.18 Million Tons |
| CAGR | 6.24 % |
| Market Concentration | High |
Major Players*Disclaimer: Major Players sorted in no particular order |


Fiber Cement Market Analysis
The Fiber Cement Market size is estimated at 35.59 million Tons in 2024, and is expected to reach 51.18 million Tons by 2030, growing at a CAGR of 6.24% during the forecast period (2024-2030).
The fiber cement industry has experienced significant shifts in production dynamics and cost structures throughout 2022-2023, primarily influenced by global raw material price fluctuations and supply chain realignments. A severe coal shortage in 2022 led to escalating production costs and higher average selling prices for cement manufacturers, creating ripple effects across the cement market. The industry has shown remarkable resilience, however, with manufacturers implementing innovative production techniques and exploring alternative raw material sources to maintain competitive pricing. The sector's transformation has been further accelerated by the increasing adoption of sustainable manufacturing practices and the integration of advanced technologies in production processes.
The construction sector has demonstrated robust growth potential, evidenced by substantial infrastructure investments across major economies. China's transport infrastructure investment reached USD 165.6 billion in 2022, highlighting the strong commitment to infrastructure development in key markets. This trend is reinforced by the growing emphasis on sustainable construction practices and the increasing focus on enhancing connectivity through roads, airports, and railways. The industry has witnessed a significant shift toward private-public partnerships (PPPs), with global infrastructure spending projected to increase by USD 423.12 billion by 2030 compared to 2022 levels.
Technological advancements in fiber cement manufacturing have led to the development of products with enhanced durability, moisture resistance, and thermal properties. Manufacturers are increasingly focusing on research and development to create innovative solutions that meet evolving construction requirements and sustainability standards. The industry has witnessed a notable shift toward the integration of automation and digital technologies in production processes, improving efficiency and product quality while reducing environmental impact. These innovations have particularly focused on developing lightweight yet durable materials that offer superior performance in various weather conditions.
The market landscape is being reshaped by changing consumer preferences and regulatory requirements, particularly regarding sustainable building materials. The construction sector has witnessed a significant increase in new floor area development, with residential construction alone expected to add 903 million square feet in 2023 compared to 2022. This growth is accompanied by a strong emphasis on energy-efficient building materials and sustainable construction practices. Industry players are responding by developing eco-friendly fiber cement products that meet both regulatory requirements and consumer demands for environmentally responsible building materials, while maintaining high performance standards and durability. The fiber cement products are increasingly preferred due to their sustainability and durability, aligning with the industry's shift towards eco-friendly solutions.
Global Fiber Cement Market Trends
Asia-Pacific's surge in large-scale office building projects is set to elevate the global floor area dedicated to commercial construction
- In 2022, the global new floor area for commercial construction witnessed a modest growth of 0.15% from the previous year. Europe stood out with a significant surge of 12.70%, driven by a push for high-energy-efficient office buildings to align with its 2030 carbon emission targets. As employees returned to offices, European companies, resuming lease decisions, spurred the construction of 4.5 million square feet of new office space in 2022. This momentum is poised to persist in 2023, with a projected global growth rate of 4.26%.
- The COVID-19 pandemic caused labor and material shortages, leading to cancellations and delays in commercial construction projects. However, as lockdowns eased and construction activities resumed, the global new floor area for commercial construction surged by 11.11% in 2021, with Asia-Pacific taking the lead with a growth rate of 20.98%.
- Looking ahead, the global new floor area for commercial construction is set to achieve a CAGR of 4.56%. Asia-Pacific is anticipated to outpace other regions, with a projected CAGR of 5.16%. This growth is fueled by a flurry of commercial construction projects in China, India, South Korea, and Japan. Notably, major Chinese cities like Beijing, Shanghai, Hong Kong, and Taipei are gearing up for an uptick in Grade A office space construction. Additionally, India is set to witness the opening of approximately 60 shopping malls, spanning 23.25 million square feet, in its top seven cities between 2023 and 2025. Collectively, these endeavors across Asia-Pacific are expected to add a staggering 1.56 billion square feet to the new floor area for commercial construction by 2030, compared to 2022.

Understand The Key Trends Shaping This Market
Download PDF
South America's estimated fastest growth in residential constructions due to increasing government investments in schemes for affordable housing to boost the global residential sector
- In 2022, the global new floor area for residential construction declined by around 289 million square feet compared to 2021. This can be attributed to the housing crisis generated due to the shortage of land, labor, and unsustainably high construction materials prices. This crisis severely impacted Asia-Pacific, where the new floor area declined 5.39% in 2022 compared to 2021. However, a more positive outlook is expected in 2023 as the global new floor area is predicted to grow by 3.31% compared to 2022, owing to government investments that can finance the construction of new affordable homes capable of accommodating 3 billion people by 2030.
- The COVID-19 pandemic caused an economic slowdown, due to which many residential construction projects got canceled or delayed, and the global new floor area declined by 4.79% in 2020 compared to 2019. As the restrictions were lifted in 2021 and pent-up demand for housing projects was released, new floor area grew 11.22% compared to 2020, with Europe having the highest growth of 18.28%, followed by South America, which rose 17.36% in 2021 compared to 2020.
- The global new floor area for residential construction is expected to register a CAGR of 3.81% during the forecast period, with South America predicted to develop at the fastest CAGR of 4.05%. Schemes and initiatives like the Minha Casa Minha Vida in Brazil announced in 2023 with a few regulatory changes, for which the government plans an investment of USD 1.98 billion to provide affordable housing units for low-income families, and the FOGAES in Chile also publicized in 2023, with an initial investment of USD 50 million, are aimed at providing mortgage loans to families for affordable housing and will encourage the construction of new residential units.

OTHER KEY INDUSTRY TRENDS COVERED IN THE REPORT
- Surging energy investments in Asia-Pacific are set to bolster the global expansion of industrial construction
- Projections indicate that the growing number of private-public partnerships in infrastructure construction across Asia-Pacific will contribute to a notable surge in global infrastructure spending
Segment Analysis: End Use Sector
Residential Segment in Global Fiber Cement Market
The residential sector dominates the global fiber cement market, commanding approximately 47% of the total fiber cement market share in 2024. This significant market position is primarily driven by the extensive use of fiber cement in residential applications such as siding, roofing, cladding, molding, and trimming. The segment's dominance is further reinforced by various government initiatives worldwide aimed at providing affordable housing solutions. For instance, China's relaxation of home purchase restrictions and favorable mortgage rates are stimulating demand for new residential units. Similarly, Saudi Arabia's ambitious target to deliver 40,000 affordable housing units by 2025 and Indonesia's commitment to constructing 1 million affordable housing units by 2030 are creating substantial opportunities for fiber cement applications in residential construction.
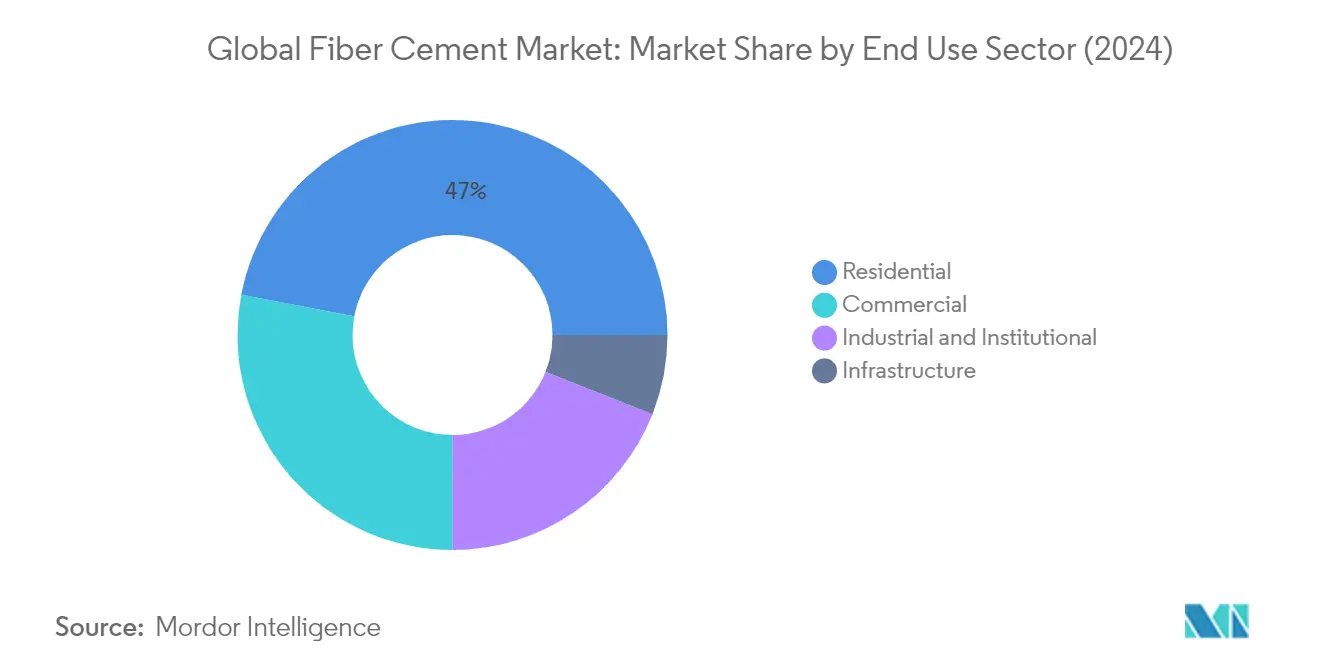
Infrastructure Segment in Global Fiber Cement Market
The infrastructure segment is emerging as the fastest-growing sector in the global fiber cement market, with a projected growth rate of approximately 7% during 2024-2029. This remarkable growth is being fueled by evolving sustainable construction practices and an increasing emphasis on enhancing global connectivity through roads, airports, railways, and seaways. The segment's growth is further accelerated by renewed interest in private-public partnerships and significant government initiatives worldwide. Notable examples include the Bipartisan Infrastructure Law in the United States and Saudi Arabia's national infrastructure fund. Additionally, the QUAD countries have earmarked a substantial USD 50 billion for infrastructure projects across Asia-Pacific, while the United Arab Emirates has allocated USD 23 billion for diverse transportation and road infrastructure ventures.
Remaining Segments in End Use Sector
The commercial and industrial & institutional segments play vital roles in shaping the global fiber cement market landscape. The commercial sector is particularly significant in urban areas, where there is growing demand for Grade A office spaces, shopping malls, and retail establishments. The segment benefits from the rising trend of sustainable building practices and energy-efficient construction. Meanwhile, the industrial and institutional sector's demand is primarily driven by the construction of manufacturing facilities, warehouses, educational institutions, and healthcare facilities. Both segments are experiencing steady growth, supported by increasing industrialization, urbanization, and the global shift towards sustainable construction materials.
Segment Analysis: Application
Siding Segment in Global Fiber Cement Market
The siding segment maintains its dominant position in the global fiber cement market, accounting for approximately 43% of the total market volume in 2024. This significant market share can be attributed to the segment's widespread adoption in residential construction, where fiber cement siding offers superior durability and low maintenance compared to traditional materials. The segment's popularity is further bolstered by its resistance to fire, pests, water, and fading, eliminating the need for frequent repainting. Additionally, fiber cement siding's energy efficiency and insulation benefits make it particularly attractive for sustainable construction projects. The material's versatility in mimicking various textures, including wood and stone, while offering better wear and longer lifespan, has cemented its position as the preferred choice among contractors and homebuilders.
Roofing Segment in Global Fiber Cement Market
The roofing segment emerges as the fastest-growing application in the fiber cement market, projected to expand at approximately 9% CAGR from 2024 to 2029. This remarkable growth is driven by the segment's unique value proposition in both residential and commercial construction sectors. Fiber cement roofing products offer exceptional resistance to insects, rot, mold, and mildew while demonstrating superior performance against fire, shrinkage, warping, and temperature fluctuations. These properties make them particularly suitable for agricultural buildings such as barns and stables, as well as industrial premises like warehouses and sheds. The segment's growth is further supported by the rising trend of sustainable construction practices, as fiber cement roofs provide excellent vapor permeability, durability, and thermal and acoustic insulation benefits, making them increasingly popular among contractors focused on eco-friendly building solutions.
Remaining Segments in Application
The fiber cement board market's remaining segments include cladding, molding and trimming, and other applications, each serving distinct construction needs. Cladding applications have gained significant traction due to their weather resistance and dimensional stability, making them ideal for exterior wall protection. The molding and trimming segment serves specialized architectural requirements, particularly around windows, doors, and rooflines, offering both aesthetic appeal and functional benefits. Other applications encompass diverse uses such as flooring, duct coverings, cupboards, and countertops, demonstrating the material's versatility across various construction applications. These segments collectively contribute to the market's comprehensive coverage of construction needs, from structural applications to decorative finishes.
Fiber Cement Market Geography Segment Analysis
Fiber Cement Market in Asia-Pacific
The Asia-Pacific region represents a dynamic marketplace for fiber cement products, driven by rapid urbanization and infrastructure development across multiple countries. The region encompasses major economies including China, Japan, India, South Korea, and emerging markets like Indonesia, Vietnam, Thailand, and Malaysia. Construction activities across residential, commercial, and infrastructure sectors continue to fuel demand, with particular emphasis on sustainable building materials. The region's diverse economic landscape, coupled with government initiatives promoting modern construction techniques, has created a robust environment for fiber cement adoption.
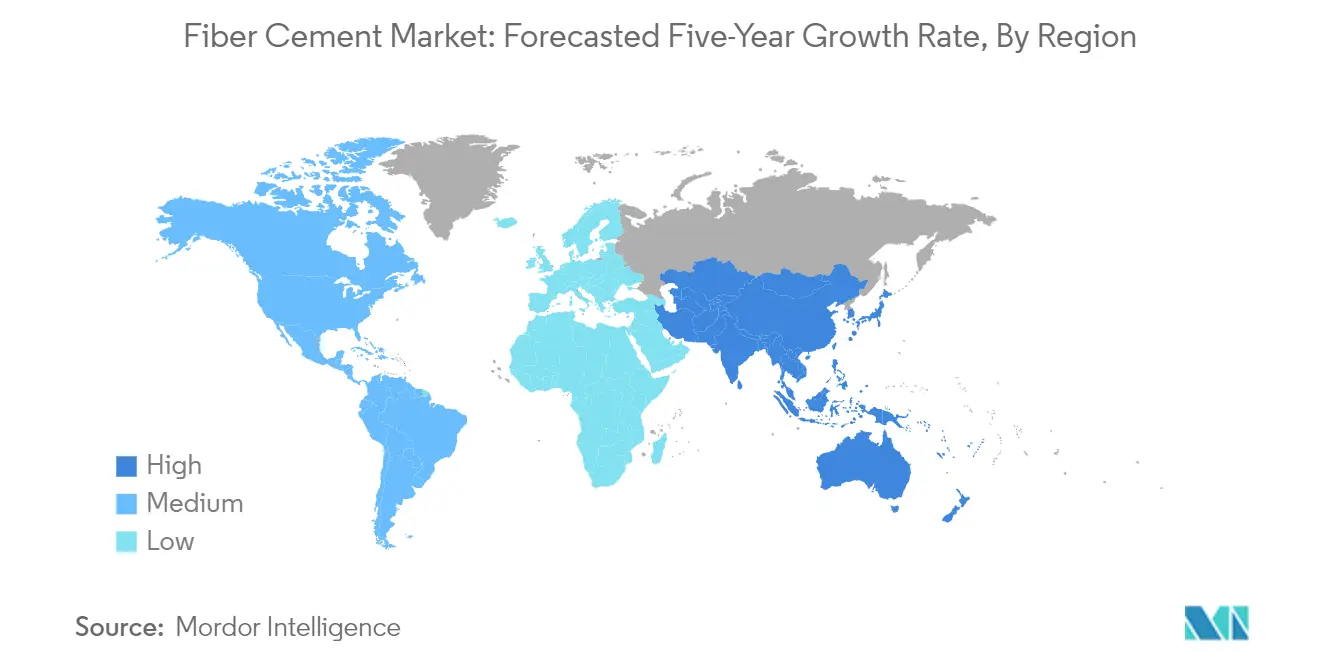
Fiber Cement Market in China
China maintains its position as the dominant force in Asia-Pacific's fiber cement market, commanding approximately 77% of the regional market share in 2024. The country's construction sector benefits from relaxed home purchase restrictions and favorable mortgage rates, driving demand for new residential units. Major Chinese cities, including Beijing, Shanghai, Hong Kong, and Taipei, are witnessing a significant uptick in Grade A office space construction. The government's strategic focus on advanced manufacturing, including investments in AI and cutting-edge equipment, continues to drive industrial construction activities. Additionally, China's emphasis on sustainable construction practices and energy-efficient building solutions has created new opportunities for fiber cement applications.
Fiber Cement Market in Indonesia
Indonesia emerges as the fastest-growing market in the Asia-Pacific region, with a projected growth rate of approximately 8% from 2024 to 2029. The country's construction sector is witnessing unprecedented growth, fueled by government initiatives and increasing private sector participation. The Indonesian government's push for high-investment mega-construction projects is transforming the construction landscape. Rising urbanization rates and the subsequent demand for modern housing solutions have created substantial opportunities for fiber cement applications. The country's focus on developing smart cities and sustainable infrastructure projects has further accelerated the adoption of advanced construction materials like fiber cement.
Fiber Cement Market in Europe
Europe's fiber cement market demonstrates strong growth potential, supported by stringent building regulations and an increasing focus on sustainable construction practices. The region's construction sector, spanning countries like Germany, France, the United Kingdom, Italy, Spain, and Russia, shows varied adoption patterns influenced by local building traditions and regulations. The European Union's emphasis on energy-efficient buildings and sustainable construction materials has created favorable conditions for fiber cement products. The region's commitment to reducing carbon emissions has led to increased adoption of eco-friendly building materials.
Fiber Cement Market in Russia
Russia emerges as the largest fiber cement market in Europe, holding approximately 9% of the regional market share in 2024. The country's construction sector benefits from robust government support and increasing private sector participation. Major infrastructure projects and residential construction initiatives continue to drive demand for fiber cement products. The Russian government's ambitious targets for new housing construction, coupled with significant investments in commercial and industrial projects, have created sustained demand for fiber cement materials. The country's focus on modernizing its construction sector has led to increased adoption of advanced building materials.
Fiber Cement Market in Spain
Spain demonstrates the highest growth potential in Europe's fiber cement market, with an expected growth rate of approximately 5% from 2024 to 2029. The country's construction sector is experiencing a renaissance, particularly in commercial and residential segments. The surge in office building expansions and modern retail infrastructure development has created new opportunities for fiber cement applications. Spain's commitment to sustainable construction practices and energy-efficient buildings has further accelerated the adoption of innovative building materials. The country's focus on urban renewal projects and modern architectural solutions has positioned it as a key growth market for fiber cement products.
Fiber Cement Market in Middle East and Africa
The Middle East and Africa region presents significant opportunities for fiber cement market expansion, driven by ambitious construction projects and infrastructure development initiatives. The region's construction sector, particularly in Saudi Arabia and the United Arab Emirates, continues to evolve with increasing emphasis on modern building materials and sustainable construction practices. Government initiatives supporting affordable housing projects and commercial infrastructure development have created favorable conditions for fiber cement adoption.
Fiber Cement Market in Saudi Arabia
Saudi Arabia maintains its position as the largest fiber cement market in the Middle East and Africa region. The country's construction sector benefits from significant government investments in mega-projects and infrastructure development. The implementation of Vision 2030 initiatives, particularly in residential and commercial construction, continues to drive demand for fiber cement products. The country's focus on developing modern cities and sustainable infrastructure has created sustained demand for advanced building materials.
Fiber Cement Market in United Arab Emirates
The United Arab Emirates demonstrates the strongest growth potential in the Middle East and Africa region. The country's construction sector benefits from robust foreign direct investment and government support for infrastructure development. Notable commercial projects and residential developments continue to drive demand for fiber cement products. The UAE's emphasis on sustainable construction practices and innovative building solutions has created new opportunities for fiber cement applications.
Fiber Cement Market in North America
North America's fiber cement market demonstrates robust growth potential, driven by strong construction activities across the United States, Canada, and Mexico. The United States emerges as the largest market in the region, benefiting from significant infrastructure investments and residential construction activities. Mexico stands out as the fastest-growing market, driven by nearshoring activities and increased warehouse construction. The region's focus on sustainable construction practices and modern building materials continues to create favorable conditions for fiber cement adoption. Government initiatives supporting infrastructure development and housing construction further strengthen market growth prospects.
Fiber Cement Market in South America
South America's fiber cement market demonstrates significant growth potential, with Brazil and Argentina leading regional development. Brazil emerges as both the largest and fastest-growing market in the region, driven by substantial infrastructure investments and residential construction activities. The region's construction sector benefits from government initiatives supporting affordable housing projects and infrastructure development. Increasing focus on sustainable construction practices and modern building materials continues to drive fiber cement adoption. Foreign direct investments, particularly in renewable energy projects and commercial infrastructure, further strengthen market growth prospects.
Get Analysis on Important Geographic Markets
Download PDF
Fiber Cement Industry Overview
Top Companies in Fiber Cement Market
The fiber cement market is characterized by continuous product innovation, with leading companies focusing on developing advanced solutions that offer enhanced durability, sustainability, and aesthetic appeal. Companies are demonstrating operational agility by expanding their manufacturing capabilities and modernizing existing facilities to incorporate innovative technologies and processes. Strategic partnerships, particularly with homebuilders and distributors, have emerged as a key trend to maintain growth and expand market presence. Geographic expansion through both organic growth and acquisitions remains a priority, with companies establishing new production facilities in emerging markets while strengthening their position in developed regions. The industry has witnessed a strong focus on sustainable practices, with fiber cement manufacturers investing in eco-friendly production processes and developing products that align with green building standards.
Consolidated Market Led By Global Players
The global fiber cement market exhibits a highly consolidated structure, with the top five companies commanding a significant portion of the fiber cement market share. These dominant players are primarily large, diversified building materials conglomerates with extensive geographic presence and comprehensive product portfolios. The market is characterized by a mix of established multinational corporations and regional specialists, with the former holding stronger positions due to their integrated operations, robust distribution networks, and significant research and development capabilities.
The industry has witnessed active merger and acquisition activity, with companies pursuing strategic acquisitions to expand their geographic footprint and enhance their technological capabilities. Market leaders are particularly focused on acquiring regional players to strengthen their presence in high-growth markets and gain access to local distribution networks. This consolidation trend is expected to continue as companies seek to achieve economies of scale, expand their product offerings, and strengthen their competitive position in key markets.
Innovation and Sustainability Drive Future Success
For incumbent companies to maintain and increase their market share, focusing on product innovation and sustainability will be crucial. Market leaders must continue investing in research and development to create differentiated products that meet evolving customer needs and regulatory requirements. Establishing strong relationships with key stakeholders, including distributors, contractors, and architects, while maintaining efficient supply chain operations, will be essential for sustained success. Additionally, developing comprehensive sustainability initiatives and offering eco-friendly products will become increasingly important as environmental regulations tighten and customer preferences evolve.
For contenders looking to gain ground, focusing on niche market segments and developing specialized products for specific applications could provide opportunities for growth. Building a strong local presence in emerging markets, where construction activity is expected to remain robust, will be crucial. Companies must also consider potential substitution risks from alternative materials and adapt their strategies accordingly. Success will depend on the ability to navigate regulatory changes, particularly those related to environmental standards and building codes, while maintaining cost competitiveness and product quality. Developing innovative distribution strategies and leveraging digital technologies for market penetration will also be critical for gaining market share. The focus on fiber cement production processes that are both efficient and sustainable will be key to future success.
Fiber Cement Market Leaders
-
ELEMENTIA MATERIALES, SAB DE CV
-
Etex Group
-
James Hardie Building Products Inc.
-
NICHIHA Co.,Ltd
-
SCG
- *Disclaimer: Major Players sorted in no particular order

Need More Details on Market Players and Competiters?
Download PDF
Fiber Cement Market News
- October 2023: James Hardie Building Products Inc. partnered with D.R. Horton, Inc., the largest homebuilder in the United States, to provide premier quality and innovative fiber cement solutions to home construction across the United States.
- June 2023: Saint-Gobain has entered into a definitive agreement to acquire Hume Cemboard Industries Sdn Bhd (HCBI), a manufacturer of fiber cement boards for façades, partitions, and ceilings, to expand its growth by enriching its range of solutions for light and sustainable construction in Malaysia.
- April 2023: BlueLinx Holdings Inc., a leading wholesale distributor of building products in the United States, and Allura USA, a subsidiary of Elementia Materiales, announced the expansion of their distribution partnership to maintain growth in the highly competitive landscape of fiber cement siding, trim, and accessories.
Free With This Report
We provide a complimentary and exhaustive set of data points on global and regional metrics that present the fundamental structure of the industry. Presented in the form of 24+ free charts, the section covers rare data on newly built floor area, infrastructural spending, and existing construction floor area across residential, commercial, industrial and institutional sectors.


Fiber Cement Market Report - Table of Contents
1. EXECUTIVE SUMMARY & KEY FINDINGS
2. REPORT OFFERS
3. INTRODUCTION
- 3.1 Study Assumptions & Market Definition
- 3.2 Scope of the Study
- 3.3 Research Methodology
4. KEY INDUSTRY TRENDS
-
4.1 End Use Sector Trends
- 4.1.1 Commercial
- 4.1.2 Industrial and Institutional
- 4.1.3 Infrastructure
- 4.1.4 Residential
- 4.2 Major Infrastructure Projects (current And Announced)
- 4.3 Regulatory Framework
- 4.4 Value Chain & Distribution Channel Analysis
5. MARKET SEGMENTATION (includes market size, forecasts up to 2030 and analysis of growth prospects.)
-
5.1 End Use Sector
- 5.1.1 Commercial
- 5.1.2 Industrial and Institutional
- 5.1.3 Infrastructure
- 5.1.4 Residential
-
5.2 Application
- 5.2.1 Cladding
- 5.2.2 Molding and Trimming
- 5.2.3 Roofing
- 5.2.4 Siding
- 5.2.5 Other Applications
-
5.3 Region
- 5.3.1 Asia-Pacific
- 5.3.1.1 By Country
- 5.3.1.1.1 Australia
- 5.3.1.1.2 China
- 5.3.1.1.3 India
- 5.3.1.1.4 Indonesia
- 5.3.1.1.5 Japan
- 5.3.1.1.6 Malaysia
- 5.3.1.1.7 South Korea
- 5.3.1.1.8 Thailand
- 5.3.1.1.9 Vietnam
- 5.3.1.1.10 Rest of Asia-Pacific
- 5.3.2 Europe
- 5.3.2.1 By Country
- 5.3.2.1.1 France
- 5.3.2.1.2 Germany
- 5.3.2.1.3 Italy
- 5.3.2.1.4 Russia
- 5.3.2.1.5 Spain
- 5.3.2.1.6 United Kingdom
- 5.3.2.1.7 Rest of Europe
- 5.3.3 Middle East and Africa
- 5.3.3.1 By Country
- 5.3.3.1.1 Saudi Arabia
- 5.3.3.1.2 United Arab Emirates
- 5.3.3.1.3 Rest of Middle East and Africa
- 5.3.4 North America
- 5.3.4.1 By Country
- 5.3.4.1.1 Canada
- 5.3.4.1.2 Mexico
- 5.3.4.1.3 United States
- 5.3.5 South America
- 5.3.5.1 By Country
- 5.3.5.1.1 Argentina
- 5.3.5.1.2 Brazil
- 5.3.5.1.3 Rest of South America
6. COMPETITIVE LANDSCAPE
- 6.1 Key Strategic Moves
- 6.2 Market Share Analysis
- 6.3 Company Landscape
-
6.4 Company Profiles
- 6.4.1 CSR Limited
- 6.4.2 ELEMENTIA MATERIALES, SAB DE CV
- 6.4.3 Etex Group
- 6.4.4 HIL Limited
- 6.4.5 James Hardie Building Products Inc.
- 6.4.6 NICHIHA Co.,Ltd
- 6.4.7 Saint-Gobain
- 6.4.8 SCG
- 6.4.9 SHERA Public Company Limited
- 6.4.10 Swisspearl Group AG
- *List Not Exhaustive
7. KEY STRATEGIC QUESTIONS FOR CONCRETE, MORTARS AND CONSTRUCTION CHEMICALS CEOS
8. APPENDIX
-
8.1 Global Overview
- 8.1.1 Overview
- 8.1.2 Porter’s Five Forces Framework (Industry Attractiveness Analysis)
- 8.1.3 Global Value Chain Analysis
- 8.1.4 Market Dynamics (DROs)
- 8.2 Sources & References
- 8.3 List of Tables & Figures
- 8.4 Primary Insights
- 8.5 Data Pack
- 8.6 Glossary of Terms
You Can Purchase Parts Of This Report. Check Out Prices For Specific Sections
Get Price Break-up Now
List of Tables & Figures
- Figure 1:
- FLOOR AREA OF NEW COMMERCIAL CONSTRUCTION, SQUARE FEET, GLOBAL, 2018 - 2030
- Figure 2:
- FLOOR AREA OF NEW INDUSTRIAL AND INSTITUTIONAL CONSTRUCTION, SQUARE FEET, GLOBAL, 2018 - 2030
- Figure 3:
- SPENDING ON INFRASTRUCTURE PROJECTS, USD, GLOBAL, 2018 - 2030
- Figure 4:
- FLOOR AREA OF NEW RESIDENTIAL CONSTRUCTION, SQUARE FEET, GLOBAL, 2018 - 2030
- Figure 5:
- VOLUME OF FIBER CEMENT CONSUMED, TONS, GLOBAL, 2018 - 2030
- Figure 6:
- VOLUME OF FIBER CEMENT CONSUMED BY END USE SECTOR, TONS, GLOBAL, 2018 - 2030
- Figure 7:
- VOLUME SHARE OF FIBER CEMENT CONSUMED BY END USE SECTOR, %, GLOBAL, 2018 VS 2023 VS 2030
- Figure 8:
- VOLUME OF FIBER CEMENT CONSUMED IN COMMERCIAL SECTOR, TONS, GLOBAL, 2018 - 2030
- Figure 9:
- VOLUME SHARE OF FIBER CEMENT CONSUMED IN COMMERCIAL SECTOR, BY APPLICATION, %, GLOBAL, 2023 VS 2030
- Figure 10:
- VOLUME OF FIBER CEMENT CONSUMED IN INDUSTRIAL AND INSTITUTIONAL SECTOR, TONS, GLOBAL, 2018 - 2030
- Figure 11:
- VOLUME SHARE OF FIBER CEMENT CONSUMED IN INDUSTRIAL AND INSTITUTIONAL SECTOR, BY APPLICATION, %, GLOBAL, 2023 VS 2030
- Figure 12:
- VOLUME OF FIBER CEMENT CONSUMED IN INFRASTRUCTURE SECTOR, TONS, GLOBAL, 2018 - 2030
- Figure 13:
- VOLUME SHARE OF FIBER CEMENT CONSUMED IN INFRASTRUCTURE SECTOR, BY APPLICATION, %, GLOBAL, 2023 VS 2030
- Figure 14:
- VOLUME OF FIBER CEMENT CONSUMED IN RESIDENTIAL SECTOR, TONS, GLOBAL, 2018 - 2030
- Figure 15:
- VOLUME SHARE OF FIBER CEMENT CONSUMED IN RESIDENTIAL SECTOR, BY APPLICATION, %, GLOBAL, 2023 VS 2030
- Figure 16:
- VOLUME OF FIBER CEMENT CONSUMED BY APPLICATION, TONS, GLOBAL, 2018 - 2030
- Figure 17:
- VOLUME SHARE OF FIBER CEMENT CONSUMED BY APPLICATION, %, GLOBAL, 2018 VS 2023 VS 2030
- Figure 18:
- VOLUME OF FIBER CEMENT CONSUMED FOR CLADDING, TONS, GLOBAL, 2018 - 2030
- Figure 19:
- VOLUME SHARE OF FIBER CEMENT CONSUMED FOR CLADDING BY END USE SECTOR, %, GLOBAL, 2023 VS 2030
- Figure 20:
- VOLUME OF FIBER CEMENT CONSUMED FOR MOLDING AND TRIMMING, TONS, GLOBAL, 2018 - 2030
- Figure 21:
- VOLUME SHARE OF FIBER CEMENT CONSUMED FOR MOLDING AND TRIMMING BY END USE SECTOR, %, GLOBAL, 2023 VS 2030
- Figure 22:
- VOLUME OF FIBER CEMENT CONSUMED FOR ROOFING, TONS, GLOBAL, 2018 - 2030
- Figure 23:
- VOLUME SHARE OF FIBER CEMENT CONSUMED FOR ROOFING BY END USE SECTOR, %, GLOBAL, 2023 VS 2030
- Figure 24:
- VOLUME OF FIBER CEMENT CONSUMED FOR SIDING, TONS, GLOBAL, 2018 - 2030
- Figure 25:
- VOLUME SHARE OF FIBER CEMENT CONSUMED FOR SIDING BY END USE SECTOR, %, GLOBAL, 2023 VS 2030
- Figure 26:
- VOLUME OF FIBER CEMENT CONSUMED FOR OTHER APPLICATIONS, TONS, GLOBAL, 2018 - 2030
- Figure 27:
- VOLUME SHARE OF FIBER CEMENT CONSUMED FOR OTHER APPLICATIONS BY END USE SECTOR, %, GLOBAL, 2023 VS 2030
- Figure 28:
- VOLUME OF FIBER CEMENT CONSUMED BY REGION, TONS, GLOBAL, 2018 - 2030
- Figure 29:
- VOLUME SHARE OF FIBER CEMENT CONSUMED BY REGION, %, GLOBAL, 2018 VS 2023 VS 2030
- Figure 30:
- VOLUME OF FIBER CEMENT CONSUMED BY COUNTRY, TONS, ASIA-PACIFIC, 2018 - 2030
- Figure 31:
- VOLUME SHARE OF FIBER CEMENT CONSUMED BY COUNTRY, %, ASIA-PACIFIC, 2018 VS 2023 VS 2030
- Figure 32:
- VOLUME OF FIBER CEMENT CONSUMED, TONS, AUSTRALIA, 2018 - 2030
- Figure 33:
- VOLUME SHARE OF FIBER CEMENT CONSUMED BY END USE SECTOR, %, AUSTRALIA, 2023 VS 2030
- Figure 34:
- VOLUME OF FIBER CEMENT CONSUMED, TONS, CHINA, 2018 - 2030
- Figure 35:
- VOLUME SHARE OF FIBER CEMENT CONSUMED BY END USE SECTOR, %, CHINA, 2023 VS 2030
- Figure 36:
- VOLUME OF FIBER CEMENT CONSUMED, TONS, INDIA, 2018 - 2030
- Figure 37:
- VOLUME SHARE OF FIBER CEMENT CONSUMED BY END USE SECTOR, %, INDIA, 2023 VS 2030
- Figure 38:
- VOLUME OF FIBER CEMENT CONSUMED, TONS, INDONESIA, 2018 - 2030
- Figure 39:
- VOLUME SHARE OF FIBER CEMENT CONSUMED BY END USE SECTOR, %, INDONESIA, 2023 VS 2030
- Figure 40:
- VOLUME OF FIBER CEMENT CONSUMED, TONS, JAPAN, 2018 - 2030
- Figure 41:
- VOLUME SHARE OF FIBER CEMENT CONSUMED BY END USE SECTOR, %, JAPAN, 2023 VS 2030
- Figure 42:
- VOLUME OF FIBER CEMENT CONSUMED, TONS, MALAYSIA, 2018 - 2030
- Figure 43:
- VOLUME SHARE OF FIBER CEMENT CONSUMED BY END USE SECTOR, %, MALAYSIA, 2023 VS 2030
- Figure 44:
- VOLUME OF FIBER CEMENT CONSUMED, TONS, SOUTH KOREA, 2018 - 2030
- Figure 45:
- VOLUME SHARE OF FIBER CEMENT CONSUMED BY END USE SECTOR, %, SOUTH KOREA, 2023 VS 2030
- Figure 46:
- VOLUME OF FIBER CEMENT CONSUMED, TONS, THAILAND, 2018 - 2030
- Figure 47:
- VOLUME SHARE OF FIBER CEMENT CONSUMED BY END USE SECTOR, %, THAILAND, 2023 VS 2030
- Figure 48:
- VOLUME OF FIBER CEMENT CONSUMED, TONS, VIETNAM, 2018 - 2030
- Figure 49:
- VOLUME SHARE OF FIBER CEMENT CONSUMED BY END USE SECTOR, %, VIETNAM, 2023 VS 2030
- Figure 50:
- VOLUME OF FIBER CEMENT CONSUMED, TONS, REST OF ASIA-PACIFIC, 2018 - 2030
- Figure 51:
- VOLUME SHARE OF FIBER CEMENT CONSUMED BY END USE SECTOR, %, REST OF ASIA-PACIFIC, 2023 VS 2030
- Figure 52:
- VOLUME OF FIBER CEMENT CONSUMED BY COUNTRY, TONS, EUROPE, 2018 - 2030
- Figure 53:
- VOLUME SHARE OF FIBER CEMENT CONSUMED BY COUNTRY, %, EUROPE, 2018 VS 2023 VS 2030
- Figure 54:
- VOLUME OF FIBER CEMENT CONSUMED, TONS, FRANCE, 2018 - 2030
- Figure 55:
- VOLUME SHARE OF FIBER CEMENT CONSUMED BY END USE SECTOR, %, FRANCE, 2023 VS 2030
- Figure 56:
- VOLUME OF FIBER CEMENT CONSUMED, TONS, GERMANY, 2018 - 2030
- Figure 57:
- VOLUME SHARE OF FIBER CEMENT CONSUMED BY END USE SECTOR, %, GERMANY, 2023 VS 2030
- Figure 58:
- VOLUME OF FIBER CEMENT CONSUMED, TONS, ITALY, 2018 - 2030
- Figure 59:
- VOLUME SHARE OF FIBER CEMENT CONSUMED BY END USE SECTOR, %, ITALY, 2023 VS 2030
- Figure 60:
- VOLUME OF FIBER CEMENT CONSUMED, TONS, RUSSIA, 2018 - 2030
- Figure 61:
- VOLUME SHARE OF FIBER CEMENT CONSUMED BY END USE SECTOR, %, RUSSIA, 2023 VS 2030
- Figure 62:
- VOLUME OF FIBER CEMENT CONSUMED, TONS, SPAIN, 2018 - 2030
- Figure 63:
- VOLUME SHARE OF FIBER CEMENT CONSUMED BY END USE SECTOR, %, SPAIN, 2023 VS 2030
- Figure 64:
- VOLUME OF FIBER CEMENT CONSUMED, TONS, UNITED KINGDOM, 2018 - 2030
- Figure 65:
- VOLUME SHARE OF FIBER CEMENT CONSUMED BY END USE SECTOR, %, UNITED KINGDOM, 2023 VS 2030
- Figure 66:
- VOLUME OF FIBER CEMENT CONSUMED, TONS, REST OF EUROPE, 2018 - 2030
- Figure 67:
- VOLUME SHARE OF FIBER CEMENT CONSUMED BY END USE SECTOR, %, REST OF EUROPE, 2023 VS 2030
- Figure 68:
- VOLUME OF FIBER CEMENT CONSUMED BY COUNTRY, TONS, MIDDLE EAST AND AFRICA, 2018 - 2030
- Figure 69:
- VOLUME SHARE OF FIBER CEMENT CONSUMED BY COUNTRY, %, MIDDLE EAST AND AFRICA, 2018 VS 2023 VS 2030
- Figure 70:
- VOLUME OF FIBER CEMENT CONSUMED, TONS, SAUDI ARABIA, 2018 - 2030
- Figure 71:
- VOLUME SHARE OF FIBER CEMENT CONSUMED BY END USE SECTOR, %, SAUDI ARABIA, 2023 VS 2030
- Figure 72:
- VOLUME OF FIBER CEMENT CONSUMED, TONS, UNITED ARAB EMIRATES, 2018 - 2030
- Figure 73:
- VOLUME SHARE OF FIBER CEMENT CONSUMED BY END USE SECTOR, %, UNITED ARAB EMIRATES, 2023 VS 2030
- Figure 74:
- VOLUME OF FIBER CEMENT CONSUMED, TONS, REST OF MIDDLE EAST AND AFRICA, 2018 - 2030
- Figure 75:
- VOLUME SHARE OF FIBER CEMENT CONSUMED BY END USE SECTOR, %, REST OF MIDDLE EAST AND AFRICA, 2023 VS 2030
- Figure 76:
- VOLUME OF FIBER CEMENT CONSUMED BY COUNTRY, TONS, NORTH AMERICA, 2018 - 2030
- Figure 77:
- VOLUME SHARE OF FIBER CEMENT CONSUMED BY COUNTRY, %, NORTH AMERICA, 2018 VS 2023 VS 2030
- Figure 78:
- VOLUME OF FIBER CEMENT CONSUMED, TONS, CANADA, 2018 - 2030
- Figure 79:
- VOLUME SHARE OF FIBER CEMENT CONSUMED BY END USE SECTOR, %, CANADA, 2023 VS 2030
- Figure 80:
- VOLUME OF FIBER CEMENT CONSUMED, TONS, MEXICO, 2018 - 2030
- Figure 81:
- VOLUME SHARE OF FIBER CEMENT CONSUMED BY END USE SECTOR, %, MEXICO, 2023 VS 2030
- Figure 82:
- VOLUME OF FIBER CEMENT CONSUMED, TONS, UNITED STATES, 2018 - 2030
- Figure 83:
- VOLUME SHARE OF FIBER CEMENT CONSUMED BY END USE SECTOR, %, UNITED STATES, 2023 VS 2030
- Figure 84:
- VOLUME OF FIBER CEMENT CONSUMED BY COUNTRY, TONS, SOUTH AMERICA, 2018 - 2030
- Figure 85:
- VOLUME SHARE OF FIBER CEMENT CONSUMED BY COUNTRY, %, SOUTH AMERICA, 2018 VS 2023 VS 2030
- Figure 86:
- VOLUME OF FIBER CEMENT CONSUMED, TONS, ARGENTINA, 2018 - 2030
- Figure 87:
- VOLUME SHARE OF FIBER CEMENT CONSUMED BY END USE SECTOR, %, ARGENTINA, 2023 VS 2030
- Figure 88:
- VOLUME OF FIBER CEMENT CONSUMED, TONS, BRAZIL, 2018 - 2030
- Figure 89:
- VOLUME SHARE OF FIBER CEMENT CONSUMED BY END USE SECTOR, %, BRAZIL, 2023 VS 2030
- Figure 90:
- VOLUME OF FIBER CEMENT CONSUMED, TONS, REST OF SOUTH AMERICA, 2018 - 2030
- Figure 91:
- VOLUME SHARE OF FIBER CEMENT CONSUMED BY END USE SECTOR, %, REST OF SOUTH AMERICA, 2023 VS 2030
- Figure 92:
- MOST ACTIVE COMPANIES BY NUMBER OF STRATEGIC MOVES, GLOBAL, 2020 - 2023
- Figure 93:
- MOST ADOPTED STRATEGIES, COUNT, GLOBAL, 2020 - 2023
- Figure 94:
- PRODUCTION CAPACITY SHARE OF FIBER CEMENT BY MAJOR PLAYERS, %, GLOBAL, 2022
Fiber Cement Industry Segmentation
Commercial, Industrial and Institutional, Infrastructure, Residential are covered as segments by End Use Sector. Cladding, Molding and Trimming, Roofing, Siding are covered as segments by Application. Asia-Pacific, Europe, Middle East and Africa, North America, South America are covered as segments by Region.| End Use Sector | Commercial | |||
| Industrial and Institutional | ||||
| Infrastructure | ||||
| Residential | ||||
| Application | Cladding | |||
| Molding and Trimming | ||||
| Roofing | ||||
| Siding | ||||
| Other Applications | ||||
| Region | Asia-Pacific | By Country | Australia | |
| China | ||||
| India | ||||
| Indonesia | ||||
| Japan | ||||
| Malaysia | ||||
| South Korea | ||||
| Thailand | ||||
| Vietnam | ||||
| Rest of Asia-Pacific | ||||
| Europe | By Country | France | ||
| Germany | ||||
| Italy | ||||
| Russia | ||||
| Spain | ||||
| United Kingdom | ||||
| Rest of Europe | ||||
| Middle East and Africa | By Country | Saudi Arabia | ||
| United Arab Emirates | ||||
| Rest of Middle East and Africa | ||||
| North America | By Country | Canada | ||
| Mexico | ||||
| United States | ||||
| South America | By Country | Argentina | ||
| Brazil | ||||
| Rest of South America | ||||
Need A Different Region or Segment?
Customize Now
Market Definition
- END-USE SECTOR - Fiber cement consumed in the construction sectors such as commercial, residential, industrial, institutional, and infrastructure are considered under the scope of the study.
- PRODUCT/APPLICATION - Under the scope of the study, the consumption of fiber cement for siding, roofing, cladding molding and trimming, and other applications are considered.
| Keyword | Definition |
|---|---|
| Accelerator | Accelerators are admixtures used to fasten the setting time of concrete by increasing the initial rate and speeding up the chemical reaction between cement and the mixing water. These are used to harden and increase the strength of concrete quickly. |
| Acrylic | This synthetic resin is a derivative of acrylic acid. It forms a smooth surface and is mainly used for various indoor applications. The material can also be used for outdoor applications with a special formulation. |
| Adhesives | Adhesives are bonding agents used to join materials by gluing. Adhesives can be used in construction for many applications, such as carpet laying, ceramic tiles, countertop lamination, etc. |
| Air Entraining Admixture | Air-entraining admixtures are used to improve the performance and durability of concrete. Once added, they create uniformly distributed small air bubbles to impart enhanced properties to the fresh and hardened concrete. |
| Alkyd | Alkyds are used in solvent-based paints such as construction and automotive paints, traffic paints, flooring resins, protective coatings for concrete, etc. Alkyd resins are formed by the reaction of an oil (fatty acid), a polyunsaturated alcohol (Polyol), and a polyunsaturated acid or anhydride. |
| Anchors and Grouts | Anchors and grouts are construction chemicals that stabilize and improve the strength and durability of foundations and structures like buildings, bridges, dams, etc. |
| Cementitious Fixing | Cementitious fixing is a process in which a cement-based grout is pumped under pressure to fill forms, voids, and cracks. It can be used in several settings, including bridges, marine applications, dams, and rock anchors. |
| Commercial Construction | Commercial construction comprises new construction of warehouses, malls, shops, offices, hotels, restaurants, cinemas, theatres, etc. |
| Concrete Admixtures | Concrete admixtures comprise water reducers, air entrainers, retarders, accelerators, superplasticizers, etc., added to concrete before or during mixing to modify its properties. |
| Concrete Protective Coatings | To provide specific protection, such as anti-carbonation or chemical resistance, a film-forming protective coat can be applied on the surface. Depending on the applications, different resins like epoxy, polyurethane, and acrylic can be used for concrete protective coatings. |
| Curing Compounds | Curing compounds are used to cure the surface of concrete structures, including columns, beams, slabs, and others. These curing compounds keep the moisture inside the concrete to give maximum strength and durability. |
| Epoxy | Epoxy is known for its strong adhesive qualities, making it a versatile product in many industries. It resists heat and chemical applications, making it an ideal product for anyone needing a stronghold under pressure. It is widely used in adhesives, electrical and electronics, paints, etc. |
| Fiber Wrapping Systems | Fiber Wrapping Systems are a part of construction repair and rehabilitation chemicals. It involves the strengthening of existing structures by wrapping structural members like beams and columns with glass or carbon fiber sheets. |
| Flooring Resins | Flooring resins are synthetic materials applied to floors to enhance their appearance, increase their resistance to wear and tear or provide protection from chemicals, moisture, and stains. Depending on the desired properties and the specific application, flooring resins are available in distinct types, such as epoxy, polyurethane, and acrylic. |
| High-Range Water Reducer (Super Plasticizer) | High-range water reducers are a type of concrete admixture that provides enhanced and improved properties when added to concrete. These are also called superplasticizers and are used to decrease the water-to-cement ratio in concrete. |
| Hot Melt Adhesives | Hot-melt adhesives are thermoplastic bonding materials applied as melts that achieve a solid state and resultant strength on cooling. They are commonly used for packaging, coatings, sanitary products, and tapes. |
| Industrial and Institutional Construction | Industrial and institutional construction includes new construction of hospitals, schools, manufacturing units, energy and power plants, etc. |
| Infrastructure Construction | Infrastructure construction includes new construction of railways, roads, seaways, airports, bridges, highways, etc. |
| Injection Grouting | The process of injecting grout into open joints, cracks, voids, or honeycombs in concrete or masonry structural members is known as injection grouting. It offers several benefits, such as strengthening a structure and preventing water infiltration. |
| Liquid-Applied Waterproofing Membranes | Liquid-Applied membrane is a monolithic, fully bonded, liquid-based coating suitable for many waterproofing applications. The coating cures to form a rubber-like elastomeric waterproof membrane and may be applied over many substrates, including asphalt, bitumen, and concrete. |
| Micro-concrete Mortars | Micro-concrete mortar is made up of cement, water-based resin, additives, mineral pigments, and polymers and can be applied on both horizontal and vertical surfaces. It can be used to refurbish residential complexes, commercial spaces, etc. |
| Modified Mortars | Modified Mortars include Portland cement and sand along with latex/polymer additives. The additives increase adhesion, strength, and shock resistance while also reducing water absorption. |
| Mold Release Agents | Mold release agents are sprayed or coated on the surface of molds to prevent a substrate from bonding to a molding surface. Several types of mold release agents, including silicone, lubricant, wax, fluorocarbons, and others, are used based on the type of substrates, including metals, steel, wood, rubber, plastic, and others. |
| Polyaspartic | Polyaspartic is a subset of polyurea. Polyaspartic floor coatings are typically two-part systems that consist of a resin and a catalyst to ease the curing process. It offers high durability and can withstand harsh environments. |
| Polyurethane | Polyurethane is a plastic material that exists in various forms. It can be tailored to be either rigid or flexible and is the material of choice for a broad range of end-user applications, such as adhesives, coatings, building insulation, etc. |
| Reactive Adhesives | A reactive adhesive is made of monomers that react in the adhesive curing process and do not evaporate from the film during use. Instead, these volatile components become chemically incorporated into the adhesive. |
| Rebar Protectors | In concrete structures, rebar is one of the important components, and its deterioration due to corrosion is a major issue that affects the safety, durability, and life span of buildings and structures. For this reason, rebar protectors are used to protect against degrading effects, especially in infrastructure and industrial construction. |
| Repair and Rehabilitation Chemicals | Repair and Rehabilitation Chemicals include repair mortars, injection grouting materials, fiber wrapping systems, micro-concrete mortars, etc., used to repair and restore existing buildings and structures. |
| Residential Construction | Residential construction involves constructing new houses or spaces like condominiums, villas, and landed homes. |
| Resin Fixing | The process of using resins like epoxy and polyurethane for grouting applications is called resin fixing. Resin fixing offers several advantages, such as high compressive and tensile strength, negligible shrinkage, and greater chemical resistance compared to cementitious fixing. |
| Retarder | Retarders are admixtures used to slow down the setting time of concrete. These are usually added with a dosage rate of around 0.2% -0.6% by weight of cement. These admixtures slow down hydration or lower the rate at which water penetrates the cement particles by making concrete workable for a long time. |
| Sealants | A sealant is a viscous material that has little or no flow qualities, which causes it to remain on surfaces where they are applied. Sealants can also be thinner, enabling penetration to a certain substance through capillary action. |
| Sheet Waterproofing Membranes | Sheet membrane systems are reliable and durable thermoplastic waterproofing solutions that are used for waterproofing applications even in the most demanding below-ground structures, including those exposed to highly aggressive ground conditions and stress. |
| Shrinkage Reducing Admixture | Shrinkage-reducing admixtures are used to reduce concrete shrinkage, whether from drying or self-desiccation. |
| Silicone | Silicone is a polymer that contains silicon combined with carbon, hydrogen, oxygen, and, in some cases, other elements. It is an inert synthetic compound that comes in various forms, such as oil, rubber, and resin. Due to its heat-resistant properties, it finds applications in sealants, adhesives, lubricants, etc. |
| Solvent-borne Adhesives | Solvent-borne adhesives are mixtures of solvents and thermoplastic or slightly cross-linked polymers such as polychloroprene, polyurethane, acrylic, silicone, and natural and synthetic rubbers. |
| Surface Treatment Chemicals | Surface treatment chemicals are chemicals used to treat concrete surfaces, including roofs, vertical surfaces, and others. They act as curing compounds, demolding agents, rust removers, and others. They are cost-effective and can be used on roadways, pavements, parking lots, and others. |
| Viscosity Modifier | Viscosity Modifiers are concrete admixtures used to change various properties of admixtures, including viscosity, workability, cohesiveness, and others. These are usually added with a dosage of around 0.01% to 0.1% by weight of cement. |
| Water Reducer | Water reducers, also called plasticizers, are a type of admixture used to decrease the water-to-cement ratio in the concrete, thereby increasing the durability and strength of concrete. Various water reducers include refined lignosulfonates, gluconates, hydroxycarboxylic acids, sugar acids, and others. |
| Water-borne Adhesives | Water-borne adhesives use water as a carrier or diluting medium to disperse resin. They are set by allowing the water to evaporate or be absorbed by the substrate. These adhesives are compounded with water as a dilutant rather than a volatile organic solvent. |
| Waterproofing Chemicals | Waterproofing chemicals are designed to protect a surface from the perils of leakage. A waterproofing chemical is a protective coating or primer applied to a structure's roof, retaining walls, or basement. |
| Waterproofing Membranes | Waterproofing membranes are liquid-applied or self-adhering layers of water-tight materials that prevent water from penetrating or damaging a structure when applied to roofs, walls, foundations, basements, bathrooms, and other areas exposed to moisture or water. |
Need More Details on Market Definition?
Ask a Question
Research Methodology
Mordor Intelligence follows a four-step methodology in all our reports.
- Step-1: Identify Key Variables: The quantifiable key variables (industry and extraneous) pertaining to the specific product segment and country are selected from a group of relevant variables & factors based on desk research & literature review; along with primary expert inputs. These variables are further confirmed through regression modeling (wherever required).
- Step-2: Build a Market Model: In order to build a robust forecasting methodology, the variables and factors identified in Step-1 are tested against available historical market numbers. Through an iterative process, the variables required for market forecast are set and the model is built on the basis of these variables.
- Step-3: Validate and Finalize: In this important step, all market numbers, variables and analyst calls are validated through an extensive network of primary research experts from the market studied. The respondents are selected across levels and functions to generate a holistic picture of the market studied.
- Step-4: Research Outputs: Syndicated Reports, Custom Consulting Assignments, Databases & Subscription Platforms

Get More Details On Research Methodology
Download PDF


