| Study Period | 2017 - 2030 |
| Base Year For Estimation | 2024 |
| Forecast Data Period | 2025 - 2030 |
| Market Size (2025) | USD 402.5 Billion |
| Market Size (2030) | USD 541.2 Billion |
| CAGR (2025 - 2030) | 6.10 % |
| Market Concentration | Low |
Major Players*Disclaimer: Major Players sorted in no particular order |

Fertilizers Market Analysis
The Fertilizers Market size is estimated at 402.5 billion USD in 2025, and is expected to reach 541.2 billion USD by 2030, growing at a CAGR of 6.10% during the forecast period (2025-2030).
The global fertilizer market is experiencing significant transformation driven by evolving agricultural practices and food security concerns. Currently, more than 95% of global agricultural land is dedicated to field crop cultivation, with rice, wheat, and corn collectively accounting for approximately 38% of global agricultural land. This extensive cultivation pattern has led to increased nutrient requirements and more sophisticated fertilizer applications. The industry is witnessing a shift toward precision agriculture and smart farming techniques, which optimize fertilizer usage and improve crop yields while minimizing environmental impact.
Technological advancements are reshaping the fertilizer industry landscape, particularly in developed regions. The emergence of controlled-release fertilizers (CRFs) and slow-release fertilizers (SRFs) represents a significant evolution in nutrient delivery systems. These advanced formulations are designed to maximize plant nutrient uptake while reducing nutrient losses through leaching and volatilization. The industry is also seeing increased adoption of specialty fertilizers, particularly in regions with intensive agricultural practices and high-value crop production.
Global trade dynamics and supply chain considerations are playing a crucial role in shaping the fertilizers market. China has emerged as a dominant force, contributing approximately 25% to global fertilizer production, significantly influencing global supply patterns and pricing mechanisms. The industry is witnessing a notable shift in trade patterns, with many regions becoming increasingly dependent on imports. For instance, North America, despite having substantial phosphate and potash resources, relies on imports for over 85% of its potash requirements, highlighting the complex interdependencies in the global fertilizer supply chain.
Environmental sustainability has become a central focus in the fertilizer industry, driving innovation in product development and application methods. Manufacturers are increasingly investing in environmentally friendly formulations and production processes to address concerns about soil health and environmental impact. The industry is witnessing a growing emphasis on balanced nutrient management, with fertilizer companies developing products that not only enhance crop yields but also promote soil health and reduce environmental footprint. This trend is particularly evident in the rising adoption of specialty fertilizers and bio-based alternatives, which offer improved nutrient use efficiency while minimizing environmental impact.
Global Fertilizers Market Trends
The rising pressure on the agriculture industry to meet the growing demand for food is expected to increase the area under field crop cultivation
- The global agricultural sector is facing many challenges. According to the UN, the world population may exceed 9 billion by 2050. This population growth may overburden the agricultural industry, which is already experiencing an output loss due to a lack of laborers and the shrinkage of agricultural fields caused by rising urbanization. According to the Food and Agriculture Organization, 70% of the global population is expected to live in cities by 2050. Due to the global loss of arable land, farmers now need to utilize more fertilizers to increase crop yields.
- Asia-Pacific is the world's largest producer of agricultural products. Agriculture is critical to the region's economy, as it employs about 20% of the total available workforce. Field crop cultivation dominates the region, accounting for about more than 95% of the total crop area in the region. Rice, wheat, and corn are the major field crops produced in the region, together accounting for about 24.3% of the total crop area in 2022.
- North America ranks as the second-largest arable region globally. Its farms cultivate a diverse range of crops, with a focus on field crops. Notably, corn, cotton, rice, soybean, and wheat are the prominent field crops, as highlighted by the USDA. In 2022, the United States commanded 46.2% of North America's crop cultivation area. However, the country witnessed a significant drop in crop acreage between 2017 and 2019, primarily due to adverse environmental conditions, leading to severe flooding in regions like Texas and Houston.

Understand The Key Trends Shaping This Market
Download PDF
The global average application rate of primary nutrient nitrogen, potassium, and phosphorus in field crops is 164.31 kg/ha
- Corn, rapeseed, cotton, sorghum, rice, wheat, and soybean are among the primary nutrient-intensive crops globally. In 2022, the average application rates for these crops were as follows: corn - 230.57 kg/ha, rapeseed - 255.75 kg/ha, cotton - 172.70 kg/ha, sorghum - 158.46 kg/ha, rice - 154.49 kg/ha, wheat - 135.35 kg/ha, and soybean - 120.97 kg/ha. Primary nutrients are vital for crops as they support essential plant metabolic processes and contribute to the formation of key tissues like cells, cell membranes, and chlorophyll. Notably, phosphorus is crucial for cultivating high-quality crops, while potassium plays a pivotal role in activating enzymes necessary for plant growth.
- On a global scale, field crops have an average application rate of 164.31 kg/ha for nitrogen, potassium, and phosphorus. Nitrogen stands out as the most widely used primary nutrient fertilizer, with an application rate of 224.6 kg/ha in 2022. Potassic fertilizers follow, with an application rate of 150.3 kg/ha, and phosphorus ranks third, with an application rate of 117.9 kg/ha.
- In 2022, rapeseed had the highest nitrogen application rate at 347.4 kg/ha, while corn led in phosphorus application at 156.3 kg/ha. Canola took the lead in potassium application, with a rate of 248.6 kg/ha.
- Field crop cultivation is on the rise globally, particularly in South America and Asia-Pacific. These regions are emerging as key markets for fertilizers. Developed regions like Europe and North America, along with areas grappling with nutrient deficiencies, are increasingly adopting specialty fertilizers for their efficacy. These trends are poised to propel the primary nutrient fertilizers market during 2023-2030.

OTHER KEY INDUSTRY TRENDS COVERED IN THE REPORT
- The growing demand for fruits and vegetables drives the expansion of horticulture crop cultivation
- Micronutrient deficiency in vegetable crops can have several detrimental effects
- A steady supply of sulfur is required from early growth stages until harvest as it is immobile in plants, and any shortage in its supply can limit the yield
- Technical advancements in irrigation equipment and well water management practices may increase area under irrigation
- Asia-Pacific accounted for the highest average micronutrient application rate of 5.20 kg/hectare
- Tomatoes stand out among vegetable crops, with an average application rate of 386.36 kg/ha for primary nutrients
- Magnesium accounted for the highest average application rate in vegetable crops among the secondary nutrients with 48.67 kg/ha
Segment Analysis: Type
Straight Fertilizers Segment in Global Fertilizers Market
Straight fertilizers continue to dominate the straight fertilizer market, commanding approximately 72% of the total market value in 2024. This segment's dominance can be attributed to several factors, including their efficacy in providing essential nutrients to a diverse range of crops, enhanced availability to plants, and competitive pricing compared to complex alternatives. The segment's strength is particularly evident in field crops, where precise nutrient management is crucial. Straight fertilizers offer farmers the flexibility to adjust individual nutrient applications based on specific crop requirements and soil conditions, making them particularly valuable in precision agriculture practices. The segment's robust performance is further supported by their widespread availability, established distribution networks, and the growing concerns around nutrient leaching that necessitate targeted nutrient applications.
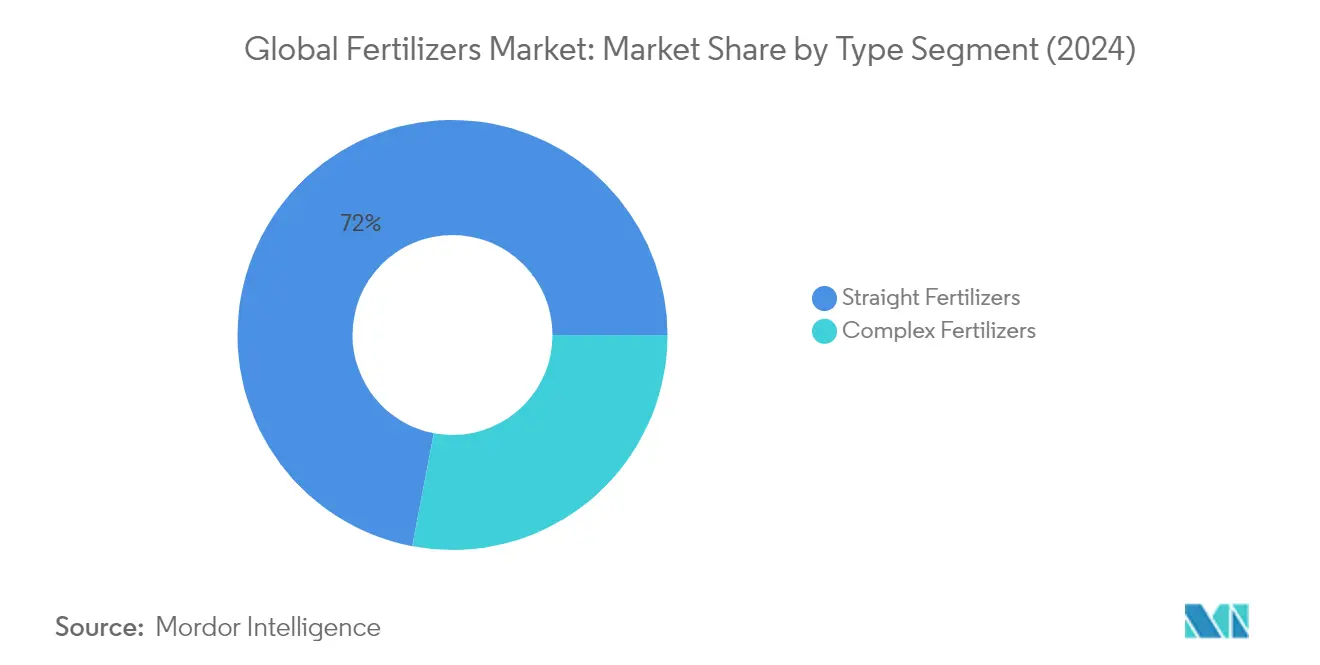
Complex Fertilizers Segment in Global Fertilizers Market
Complex fertilizers are emerging as the fastest-growing segment in the global fertilizers market, projected to expand at approximately 6% CAGR from 2024 to 2029. This growth is driven by increasing awareness of balanced crop nutrition and the segment's ability to provide multiple nutrients in a single granule. The complex fertilizers market is gaining traction particularly in regions adopting modern agricultural practices, where their convenience and efficiency in nutrient delivery make them increasingly attractive to farmers. The segment's growth is further propelled by technological advancements in fertilizer manufacturing, leading to improved nutrient release patterns and enhanced crop uptake efficiency. Additionally, the rising demand for specialty complex fertilizers in high-value crops and the growing emphasis on sustainable agriculture practices are contributing to the segment's accelerated growth trajectory.
Segment Analysis: Form
Conventional Segment in Global Fertilizers Market
Conventional fertilizers continue to dominate the global fertilizers market, commanding approximately 88% of the total market value in 2024. This dominance can be attributed to their competitive pricing, widespread availability, and established distribution networks across agricultural regions. Conventional fertilizers find their primary application in field crops such as wheat, corn/maize, soybean, and cotton, which cover over 95% of the global agricultural area. The segment's strong market position is further reinforced by farmers' familiarity with application methods and the proven effectiveness of these fertilizers in various soil conditions and crop types. Additionally, the lower production costs and simpler manufacturing processes of conventional fertilizers make them more accessible to farmers in developing regions, where price sensitivity plays a crucial role in purchasing decisions.
Controlled Release Fertilizers (CRF) Segment in Global Fertilizers Market
The Controlled Release Fertilizers (CRF) segment is emerging as the fastest-growing category in the specialty fertilizers market, projected to expand at approximately 8% CAGR from 2024 to 2029. This remarkable growth is driven by increasing environmental concerns and the need for more efficient nutrient delivery systems. CRF's innovative technology allows for the gradual release of nutrients, significantly reducing nutrient losses through leaching and volatilization while improving crop uptake efficiency. The segment's growth is further supported by the rising adoption of precision farming techniques and sustainable agricultural practices. Farmers are increasingly recognizing the long-term benefits of CRF, including reduced application frequency, improved nutrient use efficiency, and minimized environmental impact, particularly in regions with strict environmental regulations.
Remaining Segments in Form Segmentation
The other segments within specialty fertilizers, including Water Soluble Fertilizers (WSF), Slow Release Fertilizers (SRF), and Liquid Fertilizers, each play distinct roles in meeting specific agricultural needs. Water soluble fertilizers are particularly valuable in greenhouse cultivation and fertigation systems, offering precise nutrient delivery. Slow release fertilizers provide an alternative approach to controlled nutrient release, particularly beneficial in turf and ornamental applications. Liquid fertilizers offer advantages in terms of ease of application and rapid nutrient availability, making them popular in foliar applications and sophisticated irrigation systems. These segments collectively contribute to the diversification of the specialty fertilizers market, offering farmers a comprehensive range of solutions for various crop requirements and growing conditions.
Segment Analysis: Application Mode
Soil Application Segment in Fertilizers Market
Soil application continues to maintain its dominant position in the global fertilizers market, accounting for approximately 89% of the total market value in 2024. This substantial market share can be attributed to soil application being the most traditional and widely adopted method of fertilizer application worldwide. The segment's prominence is primarily driven by its effectiveness in delivering nutrients directly to the root system, ensuring even dispersion across soil surfaces, and its particular utility during the critical initial growth stages of various crops. Most primary and secondary macronutrients are generally applied using the soil method, making it especially popular for field crop cultivation where conventional, controlled-release, and slow-release fertilizers are predominantly used through soil application.
Fertigation Segment in Fertilizers Market
The fertigation segment is emerging as the most dynamic sector in the fertilizers market, projected to experience robust growth through 2024-2029. This growth trajectory is being fueled by the increasing adoption of modern irrigation systems and the method's ability to reduce fertilizer usage by approximately 20-40% compared to traditional application methods. Fertigation's rising popularity can be attributed to its numerous advantages, including lower application costs, enhanced efficiency, and the ability to precisely deliver dissolved fertilizers through irrigation streams. The segment is particularly gaining traction in regions with well-mechanized irrigation systems like sprinkler or drip irrigation, especially in horticultural crop cultivation.
Remaining Segments in Application Mode
The foliar application segment represents a specialized niche in the fertilizer market, offering unique advantages for specific agricultural scenarios. This method is particularly valuable when root systems are damaged or not functioning optimally, as it allows for direct nutrient absorption through the leaves. Foliar application has proven especially effective for correcting micronutrient deficiencies and is highly regarded in Asia-Pacific and Middle East & Africa regions. The method's precision and ability to provide rapid nutrient delivery make it an essential complementary approach to other application methods, particularly in situations requiring quick correction of nutrient deficiencies or during critical growth stages.
Segment Analysis: Crop Type
Fertilizers Market Geography Segment Analysis
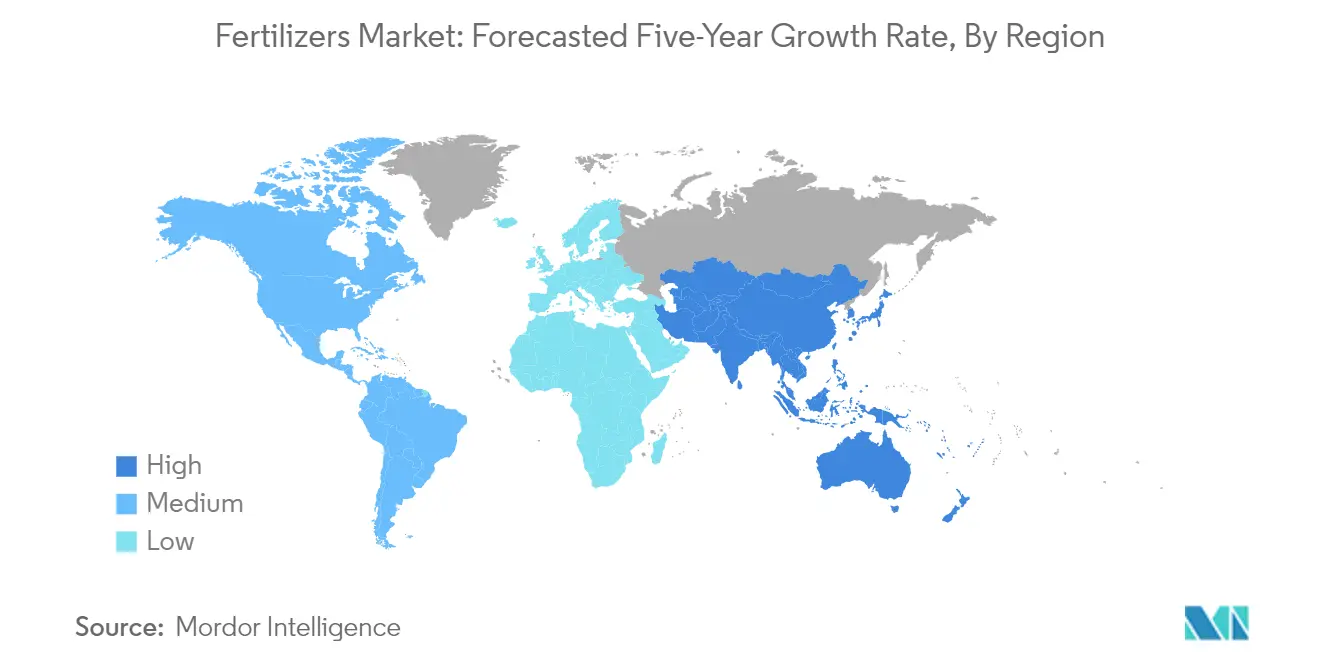
Fertilizers Market in Asia-Pacific
The Asia-Pacific region represents a diverse and dynamic fertilizer market, characterized by varying agricultural practices and soil conditions across different countries. The region encompasses major agricultural economies including China, India, Japan, Australia, and Southeast Asian nations like Indonesia, Thailand, Vietnam, and the Philippines. Each country exhibits unique fertilizer consumption patterns based on their predominant crops, farming practices, and government policies supporting agricultural development. The region's agricultural landscape ranges from large-scale commercial farming in Australia to smallholder farming in Southeast Asian countries, influencing fertilizer application methods and preferences.
Fertilizers Market in China
China dominates the Asia-Pacific fertilizer market, holding approximately 14% market share in 2024. The country's extensive cultivation of various crops to feed its large population contributes to a substantial need for fertilizers in the agricultural sector. China's fertilizer market is characterized by a strong domestic production capacity, particularly in nitrogen-based fertilizers, supported by numerous manufacturing facilities across the country. The government's focus on agricultural self-sufficiency and food security continues to drive fertilizer consumption, while environmental regulations are increasingly shaping the industry's development patterns.
Fertilizers Market in India
India emerges as the fastest-growing market in the Asia-Pacific region, with a projected growth rate of approximately 6% during 2024-2029. The country's agricultural sector is undergoing significant transformation with increasing adoption of modern farming practices and balanced fertilizer usage. Despite being the third-largest global producer, India relies significantly on imports for various fertilizer components, particularly potash. The government's continued support through subsidies and promotion of soil health management practices is driving the market's growth, while efforts to increase domestic production capacity are reshaping the supply landscape. The size of the fertilizer market in India is expected to expand significantly, reflecting these dynamic changes. Additionally, the fertilizer industry market size in India is poised for substantial growth, driven by policy support and technological advancements.
Fertilizers Market in Europe
The European fertilizer market demonstrates a sophisticated structure with varying consumption patterns across different regions. The market encompasses major agricultural producers like Russia, Germany, France, and the United Kingdom, along with emerging agricultural economies in Eastern Europe such as Ukraine. Environmental regulations, particularly EU directives on sustainable agriculture, significantly influence fertilizer usage patterns across the region. The market is characterized by a strong focus on specialty and efficient fertilizer products, reflecting the region's emphasis on sustainable farming practices.
Fertilizers Market in Russia
Russia maintains its position as the largest fertilizer market in Europe, commanding approximately 19% of the regional market share in 2024. The country's vast agricultural land and significant domestic production capacity support its dominant position. Russia's fertilizer industry benefits from abundant natural gas resources, a key input for nitrogen fertilizer production. The country's agricultural sector continues to modernize, with increasing focus on precision farming techniques and optimal fertilizer application methods.
Fertilizers Market in Ukraine
Ukraine demonstrates the highest growth potential in the European region, with an expected growth rate of approximately 6% during 2024-2029. The country's rich agricultural heritage and favorable soil conditions create substantial demand for fertilizers. Ukraine's position as a major global grain producer drives consistent fertilizer demand, particularly for field crops. The ongoing modernization of farming practices and increasing adoption of precision agriculture techniques are reshaping fertilizer application patterns in the country.
Fertilizers Market in Middle East & Africa
The Middle East and Africa region presents a diverse fertilizer market landscape shaped by varying agricultural conditions and economic developments. The region encompasses major markets including Nigeria, Saudi Arabia, South Africa, and Turkey, each with distinct agricultural needs and consumption patterns. The agricultural sector faces unique challenges including water scarcity and soil conditions, influencing fertilizer application methods and preferences.
Fertilizers Market in Nigeria
Nigeria stands as the largest fertilizer market in the Middle East and Africa region. The country's agricultural sector is undergoing significant transformation with increasing mechanization and adoption of modern farming practices. Nigeria's position is strengthened by its domestic production capacity, particularly in urea-based fertilizers, with numerous blending facilities operating across the country. The government's focus on agricultural self-sufficiency continues to drive market development.
Fertilizers Market in Saudi Arabia
Saudi Arabia emerges as the fastest-growing market in the Middle East and Africa region. The country's agricultural sector is evolving rapidly despite challenging climatic conditions, supported by significant investments in modern farming technologies. Saudi Arabia's strategic focus on food security and agricultural development drives the adoption of efficient fertilizer products. The country's strong domestic production capacity, particularly in phosphate-based fertilizers, supports market growth.
Fertilizers Market in North America
The North American fertilizer market is characterized by advanced agricultural practices and high technology adoption rates across the United States, Canada, and Mexico. The United States emerges as the largest market in the region, benefiting from extensive agricultural land and sophisticated farming practices. The fertilizer market in the US continues to lead with significant market share, driven by innovation and efficiency. Mexico demonstrates the fastest growth trajectory, driven by agricultural modernization and increasing export-oriented crop production. The region's market is shaped by strong domestic production capabilities, particularly in Canada and the United States, while also maintaining significant import relationships for specific fertilizer types.
Fertilizers Market in South America
The South American fertilizer market is dominated by Brazil and Argentina, with Brazil emerging as the largest market in the region. The region's agricultural sector focuses primarily on major field crops such as soybeans, corn, and sugarcane, driving substantial fertilizer demand. Brazil leads the market with its extensive agricultural area and increasing adoption of modern farming practices, while Argentina shows the fastest growth potential. The region's dependence on imports for various fertilizer components influences market dynamics, while efforts to increase domestic production capacity continue to shape the industry landscape. The global fertilizer market sees South America as a key player, with Brazil's dominance contributing significantly to the global landscape.
Get Analysis on Important Geographic Markets
Download PDF
Fertilizers Industry Overview
Top Companies in Fertilizers Market
The global fertilizer industry features prominent players like Yara International ASA, The Mosaic Company, Nutrien Ltd., CF Industries Holdings, and ICL Group Ltd leading the industry. These companies are actively pursuing product innovation initiatives, particularly in specialty and controlled-release fertilizers, to address growing environmental concerns and improve nutrient efficiency. Operational agility is demonstrated through investments in smart manufacturing facilities and digital farming solutions to optimize production and distribution. Strategic partnerships with agricultural technology providers and research institutions are becoming increasingly common to develop sustainable fertilizer solutions. Companies are expanding their geographical presence through acquisitions and joint ventures, particularly in emerging markets, while also investing in production capacity expansion to meet growing demand. The focus on developing region-specific products and establishing strong distribution networks highlights the industry's commitment to market penetration and customer service excellence.
Market Structure Shows Regional Leadership Patterns
The fertilizer market exhibits a fragmented structure with a mix of global conglomerates and regional specialists operating across different geographical segments. Global players dominate developed markets through their extensive product portfolios and established distribution networks, while regional players maintain strong positions in emerging markets through their local expertise and customer relationships. The industry is characterized by vertical integration, with major players controlling various aspects of the value chain from raw material procurement to end-product distribution, providing them with competitive advantages in cost management and supply security.
Market consolidation is primarily driven by the need to achieve economies of scale and secure access to raw materials, leading to strategic acquisitions and partnerships. Companies are increasingly focusing on backward integration to secure raw material supplies and forward integration to strengthen their distribution capabilities. The trend of cross-border acquisitions is particularly notable in emerging markets, where established players are acquiring local companies to gain market access and expand their geographical footprint. This consolidation trend is expected to continue as companies seek to strengthen their market positions and optimize their operational efficiency.
Innovation and Sustainability Drive Future Success
For incumbent players to maintain and increase their market share in fertilizers, focusing on sustainable product development and digital transformation is crucial. Companies need to invest in research and development to create environmentally friendly fertilizer solutions while maintaining product efficiency. Building strong relationships with farmers through technical support and advisory services is becoming increasingly important. The development of precision agriculture solutions and integration with digital farming platforms represents a significant opportunity for market leaders to differentiate their offerings and create value-added services.
New entrants and challenger companies can gain ground by focusing on niche market segments and developing specialized products for specific crop types or regional requirements. Success factors include building strong distribution partnerships, investing in sustainable production technologies, and developing innovative application methods. The industry faces increasing regulatory scrutiny regarding environmental impact and safety standards, making compliance and sustainable practices critical for long-term success. Companies must also address the growing demand for organic and bio-based fertilizers while maintaining cost competitiveness and product effectiveness. The ability to adapt to changing agricultural practices and consumer preferences while maintaining operational efficiency will be crucial for future success in the market.
Fertilizers Market Leaders
-
CF Industries Holdings, Inc.
-
ICL Group Ltd
-
Nutrien Ltd.
-
The Mosaic Company
-
Yara International ASA
- *Disclaimer: Major Players sorted in no particular order

Need More Details on Market Players and Competitors?
Download PDF
Fertilizers Market News
- January 2023: ICL has entered into a strategic partnership agreement with General Mills, in which it will be the supplier of strategic specialty phosphate solutions to General Mills. The long-term agreement will also focus on international expansion.
- May 2022: ICL has launched three new NPK formulations of Solinure, a product with increased trace elements to optimise yields
- May 2022: ICL signed an agreement with customers in India and China to supply 600,000 and 700,000 metric ton of potash, respectively in 2022 at 590 USD per ton.
Free With This Report
Along with the report, We also offer a comprehensive and exhaustive data pack with 25+ graphs on area under cultivation and average application rate per hectare. The data pack includes Globe, North America, Europe, Asia-Pacific, South America, and Africa.


Fertilizers Market Report - Table of Contents
1. EXECUTIVE SUMMARY & KEY FINDINGS
2. REPORT OFFERS
3. INTRODUCTION
- 3.1 Study Assumptions & Market Definition
- 3.2 Scope of the Study
- 3.3 Research Methodology
4. KEY INDUSTRY TRENDS
-
4.1 Acreage Of Major Crop Types
- 4.1.1 Field Crops
- 4.1.2 Horticultural Crops
-
4.2 Average Nutrient Application Rates
- 4.2.1 Micronutrients
- 4.2.1.1 Field Crops
- 4.2.1.2 Horticultural Crops
- 4.2.2 Primary Nutrients
- 4.2.2.1 Field Crops
- 4.2.2.2 Horticultural Crops
- 4.2.3 Secondary Macronutrients
- 4.2.3.1 Field Crops
- 4.2.3.2 Horticultural Crops
- 4.3 Agricultural Land Equipped For Irrigation
- 4.4 Regulatory Framework
- 4.5 Value Chain & Distribution Channel Analysis
5. MARKET SEGMENTATION (includes market size in Value in USD and Volume, Forecasts up to 2030 and analysis of growth prospects)
-
5.1 Type
- 5.1.1 Complex
- 5.1.2 Straight
- 5.1.2.1 Micronutrients
- 5.1.2.1.1 Boron
- 5.1.2.1.2 Copper
- 5.1.2.1.3 Iron
- 5.1.2.1.4 Manganese
- 5.1.2.1.5 Molybdenum
- 5.1.2.1.6 Zinc
- 5.1.2.1.7 Others
- 5.1.2.2 Nitrogenous
- 5.1.2.2.1 Ammonium Nitrate
- 5.1.2.2.2 Anhydrous Ammonia
- 5.1.2.2.3 Urea
- 5.1.2.2.4 Others
- 5.1.2.3 Phosphatic
- 5.1.2.3.1 DAP
- 5.1.2.3.2 MAP
- 5.1.2.3.3 SSP
- 5.1.2.3.4 TSP
- 5.1.2.3.5 Others
- 5.1.2.4 Potassic
- 5.1.2.4.1 MoP
- 5.1.2.4.2 SoP
- 5.1.2.4.3 Others
- 5.1.2.5 Secondary Macronutrients
- 5.1.2.5.1 Calcium
- 5.1.2.5.2 Magnesium
- 5.1.2.5.3 Sulfur
-
5.2 Form
- 5.2.1 Conventional
- 5.2.2 Speciality
- 5.2.2.1 CRF
- 5.2.2.2 Liquid Fertilizer
- 5.2.2.3 SRF
- 5.2.2.4 Water Soluble
-
5.3 Application Mode
- 5.3.1 Fertigation
- 5.3.2 Foliar
- 5.3.3 Soil
-
5.4 Crop Type
- 5.4.1 Field Crops
- 5.4.2 Horticultural Crops
- 5.4.3 Turf & Ornamental
-
5.5 Region
- 5.5.1 Asia-Pacific
- 5.5.1.1 Australia
- 5.5.1.2 Bangladesh
- 5.5.1.3 China
- 5.5.1.4 India
- 5.5.1.5 Indonesia
- 5.5.1.6 Japan
- 5.5.1.7 Pakistan
- 5.5.1.8 Philippines
- 5.5.1.9 Thailand
- 5.5.1.10 Vietnam
- 5.5.1.11 Rest of Asia-Pacific
- 5.5.2 Europe
- 5.5.2.1 France
- 5.5.2.2 Germany
- 5.5.2.3 Italy
- 5.5.2.4 Netherlands
- 5.5.2.5 Russia
- 5.5.2.6 Spain
- 5.5.2.7 Ukraine
- 5.5.2.8 United Kingdom
- 5.5.2.9 Rest of Europe
- 5.5.3 Middle East & Africa
- 5.5.3.1 Nigeria
- 5.5.3.2 Saudi Arabia
- 5.5.3.3 South Africa
- 5.5.3.4 Turkey
- 5.5.3.5 Rest of Middle East & Africa
- 5.5.4 North America
- 5.5.4.1 Canada
- 5.5.4.2 Mexico
- 5.5.4.3 United States
- 5.5.4.4 Rest of North America
- 5.5.5 South America
- 5.5.5.1 Argentina
- 5.5.5.2 Brazil
- 5.5.5.3 Rest of South America
6. COMPETITIVE LANDSCAPE
- 6.1 Key Strategic Moves
- 6.2 Market Share Analysis
- 6.3 Company Landscape
-
6.4 Company Profiles
- 6.4.1 CF Industries Holdings, Inc.
- 6.4.2 Coromandel International Ltd.
- 6.4.3 Grupa Azoty S.A. (Compo Expert)
- 6.4.4 Haifa Group
- 6.4.5 ICL Group Ltd
- 6.4.6 Indian Farmers Fertiliser Cooperative Limited
- 6.4.7 Nutrien Ltd.
- 6.4.8 Sociedad Quimica y Minera de Chile SA
- 6.4.9 The Mosaic Company
- 6.4.10 Yara International ASA
- *List Not Exhaustive
7. KEY STRATEGIC QUESTIONS FOR FERTILIZER CEOS
8. APPENDIX
-
8.1 Global Overview
- 8.1.1 Overview
- 8.1.2 Porter’s Five Forces Framework
- 8.1.3 Global Value Chain Analysis
- 8.1.4 Market Dynamics (DROs)
- 8.2 Sources & References
- 8.3 List of Tables & Figures
- 8.4 Primary Insights
- 8.5 Data Pack
- 8.6 Glossary of Terms
You Can Purchase Parts Of This Report. Check Out Prices For Specific Sections
Get Price Break-up Now
List of Tables & Figures
- Figure 1:
- CULTIVATION OF FIELD CROPS IN HECTARE, GLOBAL, 2017 - 2022
- Figure 2:
- CULTIVATION OF HORTICULTURAL CROPS IN HECTARE, GLOBAL, 2017 - 2022
- Figure 3:
- CONSUMPTION OF MICRONUTRIENTS BY FIELD CROPS IN KG/HECTARE, GLOBAL, 2022
- Figure 4:
- CONSUMPTION OF MICRONUTRIENTS BY HORTICULTURAL CROPS IN KG/HECTARE, GLOBAL, 2022
- Figure 5:
- CONSUMPTION OF PRIMARY NUTRIENTS BY FIELD CROPS IN KG/HECTARE, GLOBAL, 2022
- Figure 6:
- CONSUMPTION OF PRIMARY NUTRIENTS BY HORTICULTURAL CROPS IN KG/HECTARE, GLOBAL, 2022
- Figure 7:
- CONSUMPTION OF SECONDARY MACRONUTRIENTS BY FIELD CROPS IN KG/HECTARE, GLOBAL, 2022
- Figure 8:
- CONSUMPTION OF SECONDARY MACRONUTRIENTS BY HORTICULTURAL CROPS IN KG/HECTARE, GLOBAL, 2022
- Figure 9:
- AGRICULTURAL LAND EQUIPPED FOR IRRIGATION IN HECTARE, GLOBAL, 2022
- Figure 10:
- FERTILIZER FERTILIZER CONSUMPTION IN METRIC TON, GLOBAL, 2017 - 2030
- Figure 11:
- FERTILIZER FERTILIZER CONSUMPTION IN USD, GLOBAL, 2017 - 2030
- Figure 12:
- FERTILIZER CONSUMPTION BY TYPE IN METRIC TON, GLOBAL, 2017 - 2030
- Figure 13:
- FERTILIZER CONSUMPTION BY TYPE IN USD, GLOBAL, 2017 - 2030
- Figure 14:
- FERTILIZER CONSUMPTION VOLUME BY TYPE IN %, GLOBAL, 2017 VS 2023 VS 2030
- Figure 15:
- FERTILIZER CONSUMPTION VALUE BY TYPE IN %, GLOBAL, 2017 VS 2023 VS 2030
- Figure 16:
- COMPLEX FERTILIZER CONSUMPTION IN METRIC TON, GLOBAL, 2017 - 2030
- Figure 17:
- COMPLEX FERTILIZER CONSUMPTION IN USD, GLOBAL, 2017 - 2030
- Figure 18:
- COMPLEX FERTILIZER CONSUMPTION VALUE BY CROP TYPE IN %, GLOBAL, 2023 VS 2030
- Figure 19:
- STRAIGHT FERTILIZER CONSUMPTION BY NUTRIENT IN METRIC TON, GLOBAL, 2017 - 2030
- Figure 20:
- STRAIGHT FERTILIZER CONSUMPTION BY NUTRIENT IN USD, GLOBAL, 2017 - 2030
- Figure 21:
- STRAIGHT FERTILIZER CONSUMPTION VOLUME BY NUTRIENT IN %, GLOBAL, 2017 VS 2023 VS 2030
- Figure 22:
- STRAIGHT FERTILIZER CONSUMPTION VALUE BY NUTRIENT IN %, GLOBAL, 2017 VS 2023 VS 2030
- Figure 23:
- MICRONUTRIENTS FERTILIZER CONSUMPTION BY PRODUCT IN METRIC TON, GLOBAL, 2017 - 2030
- Figure 24:
- MICRONUTRIENTS FERTILIZER CONSUMPTION BY PRODUCT IN USD, GLOBAL, 2017 - 2030
- Figure 25:
- MICRONUTRIENTS FERTILIZER CONSUMPTION VOLUME BY PRODUCT IN %, GLOBAL, 2017 VS 2023 VS 2030
- Figure 26:
- MICRONUTRIENTS FERTILIZER CONSUMPTION VALUE BY PRODUCT IN %, GLOBAL, 2017 VS 2023 VS 2030
- Figure 27:
- BORON FERTILIZER CONSUMPTION IN METRIC TON, GLOBAL, 2017 - 2030
- Figure 28:
- BORON FERTILIZER CONSUMPTION IN USD, GLOBAL, 2017 - 2030
- Figure 29:
- BORON FERTILIZER CONSUMPTION VALUE BY CROP TYPE IN %, GLOBAL, 2023 VS 2030
- Figure 30:
- COPPER FERTILIZER CONSUMPTION IN METRIC TON, GLOBAL, 2017 - 2030
- Figure 31:
- COPPER FERTILIZER CONSUMPTION IN USD, GLOBAL, 2017 - 2030
- Figure 32:
- COPPER FERTILIZER CONSUMPTION VALUE BY CROP TYPE IN %, GLOBAL, 2023 VS 2030
- Figure 33:
- IRON FERTILIZER CONSUMPTION IN METRIC TON, GLOBAL, 2017 - 2030
- Figure 34:
- IRON FERTILIZER CONSUMPTION IN USD, GLOBAL, 2017 - 2030
- Figure 35:
- IRON FERTILIZER CONSUMPTION VALUE BY CROP TYPE IN %, GLOBAL, 2023 VS 2030
- Figure 36:
- MANGANESE FERTILIZER CONSUMPTION IN METRIC TON, GLOBAL, 2017 - 2030
- Figure 37:
- MANGANESE FERTILIZER CONSUMPTION IN USD, GLOBAL, 2017 - 2030
- Figure 38:
- MANGANESE FERTILIZER CONSUMPTION VALUE BY CROP TYPE IN %, GLOBAL, 2023 VS 2030
- Figure 39:
- MOLYBDENUM FERTILIZER CONSUMPTION IN METRIC TON, GLOBAL, 2017 - 2030
- Figure 40:
- MOLYBDENUM FERTILIZER CONSUMPTION IN USD, GLOBAL, 2017 - 2030
- Figure 41:
- MOLYBDENUM FERTILIZER CONSUMPTION VALUE BY CROP TYPE IN %, GLOBAL, 2023 VS 2030
- Figure 42:
- ZINC FERTILIZER CONSUMPTION IN METRIC TON, GLOBAL, 2017 - 2030
- Figure 43:
- ZINC FERTILIZER CONSUMPTION IN USD, GLOBAL, 2017 - 2030
- Figure 44:
- ZINC FERTILIZER CONSUMPTION VALUE BY CROP TYPE IN %, GLOBAL, 2023 VS 2030
- Figure 45:
- OTHERS FERTILIZER CONSUMPTION IN METRIC TON, GLOBAL, 2017 - 2030
- Figure 46:
- OTHERS FERTILIZER CONSUMPTION IN USD, GLOBAL, 2017 - 2030
- Figure 47:
- OTHERS FERTILIZER CONSUMPTION VALUE BY CROP TYPE IN %, GLOBAL, 2023 VS 2030
- Figure 48:
- NITROGENOUS FERTILIZER CONSUMPTION BY PRODUCT IN METRIC TON, GLOBAL, 2017 - 2030
- Figure 49:
- NITROGENOUS FERTILIZER CONSUMPTION BY PRODUCT IN USD, GLOBAL, 2017 - 2030
- Figure 50:
- NITROGENOUS FERTILIZER CONSUMPTION VOLUME BY PRODUCT IN %, GLOBAL, 2017 VS 2023 VS 2030
- Figure 51:
- NITROGENOUS FERTILIZER CONSUMPTION VALUE BY PRODUCT IN %, GLOBAL, 2017 VS 2023 VS 2030
- Figure 52:
- AMMONIUM NITRATE FERTILIZER CONSUMPTION IN METRIC TON, GLOBAL, 2017 - 2030
- Figure 53:
- AMMONIUM NITRATE FERTILIZER CONSUMPTION IN USD, GLOBAL, 2017 - 2030
- Figure 54:
- AMMONIUM NITRATE FERTILIZER CONSUMPTION VALUE BY CROP TYPE IN %, GLOBAL, 2023 VS 2030
- Figure 55:
- ANHYDROUS AMMONIA FERTILIZER CONSUMPTION IN METRIC TON, GLOBAL, 2017 - 2030
- Figure 56:
- ANHYDROUS AMMONIA FERTILIZER CONSUMPTION IN USD, GLOBAL, 2017 - 2030
- Figure 57:
- ANHYDROUS AMMONIA FERTILIZER CONSUMPTION VALUE BY CROP TYPE IN %, GLOBAL, 2023 VS 2030
- Figure 58:
- UREA UREA FERTILIZER CONSUMPTION IN METRIC TON, GLOBAL, 2017 - 2030
- Figure 59:
- UREA UREA FERTILIZER CONSUMPTION IN USD, GLOBAL, 2017 - 2030
- Figure 60:
- UREA FERTILIZER CONSUMPTION VALUE BY CROP TYPE IN USD, GLOBAL, 2017 - 2030
- Figure 61:
- OTHERS FERTILIZER CONSUMPTION IN METRIC TON, GLOBAL, 2017 - 2030
- Figure 62:
- OTHERS FERTILIZER CONSUMPTION IN USD, GLOBAL, 2017 - 2030
- Figure 63:
- OTHERS FERTILIZER CONSUMPTION VALUE BY CROP TYPE IN %, GLOBAL, 2023 VS 2030
- Figure 64:
- PHOSPHATIC FERTILIZER CONSUMPTION BY PRODUCT IN METRIC TON, GLOBAL, 2017 - 2030
- Figure 65:
- PHOSPHATIC FERTILIZER CONSUMPTION BY PRODUCT IN USD, GLOBAL, 2017 - 2030
- Figure 66:
- PHOSPHATIC FERTILIZER CONSUMPTION VOLUME BY PRODUCT IN %, GLOBAL, 2017 VS 2023 VS 2030
- Figure 67:
- PHOSPHATIC FERTILIZER CONSUMPTION VALUE BY PRODUCT IN %, GLOBAL, 2017 VS 2023 VS 2030
- Figure 68:
- DAP FERTILIZER CONSUMPTION IN METRIC TON, GLOBAL, 2017 - 2030
- Figure 69:
- DAP FERTILIZER CONSUMPTION IN USD, GLOBAL, 2017 - 2030
- Figure 70:
- DAP FERTILIZER CONSUMPTION VALUE BY CROP TYPE IN %, GLOBAL, 2023 VS 2030
- Figure 71:
- MAP FERTILIZER CONSUMPTION IN METRIC TON, GLOBAL, 2017 - 2030
- Figure 72:
- MAP FERTILIZER CONSUMPTION IN USD, GLOBAL, 2017 - 2030
- Figure 73:
- MAP FERTILIZER CONSUMPTION VALUE BY CROP TYPE IN %, GLOBAL, 2023 VS 2030
- Figure 74:
- SSP FERTILIZER CONSUMPTION IN METRIC TON, GLOBAL, 2017 - 2030
- Figure 75:
- SSP FERTILIZER CONSUMPTION IN USD, GLOBAL, 2017 - 2030
- Figure 76:
- SSP FERTILIZER CONSUMPTION VALUE BY CROP TYPE IN %, GLOBAL, 2023 VS 2030
- Figure 77:
- TSP FERTILIZER CONSUMPTION IN METRIC TON, GLOBAL, 2017 - 2030
- Figure 78:
- TSP FERTILIZER CONSUMPTION IN USD, GLOBAL, 2017 - 2030
- Figure 79:
- TSP FERTILIZER CONSUMPTION VALUE BY CROP TYPE IN %, GLOBAL, 2023 VS 2030
- Figure 80:
- OTHERS FERTILIZER CONSUMPTION IN METRIC TON, GLOBAL, 2017 - 2030
- Figure 81:
- OTHERS FERTILIZER CONSUMPTION IN USD, GLOBAL, 2017 - 2030
- Figure 82:
- OTHERS FERTILIZER CONSUMPTION VALUE BY CROP TYPE IN %, GLOBAL, 2023 VS 2030
- Figure 83:
- POTASSIC FERTILIZER CONSUMPTION BY PRODUCT IN METRIC TON, GLOBAL, 2017 - 2030
- Figure 84:
- POTASSIC FERTILIZER CONSUMPTION BY PRODUCT IN USD, GLOBAL, 2017 - 2030
- Figure 85:
- POTASSIC FERTILIZER CONSUMPTION VOLUME BY PRODUCT IN %, GLOBAL, 2017 VS 2023 VS 2030
- Figure 86:
- POTASSIC FERTILIZER CONSUMPTION VALUE BY PRODUCT IN %, GLOBAL, 2017 VS 2023 VS 2030
- Figure 87:
- MOP FERTILIZER CONSUMPTION IN METRIC TON, GLOBAL, 2017 - 2030
- Figure 88:
- MOP FERTILIZER CONSUMPTION IN USD, GLOBAL, 2017 - 2030
- Figure 89:
- MOP FERTILIZER CONSUMPTION VALUE BY CROP TYPE IN %, GLOBAL, 2023 VS 2030
- Figure 90:
- SOP FERTILIZER CONSUMPTION IN METRIC TON, GLOBAL, 2017 - 2030
- Figure 91:
- SOP FERTILIZER CONSUMPTION IN USD, GLOBAL, 2017 - 2030
- Figure 92:
- SOP FERTILIZER CONSUMPTION VALUE BY CROP TYPE IN %, GLOBAL, 2023 VS 2030
- Figure 93:
- OTHERS FERTILIZER CONSUMPTION IN METRIC TON, GLOBAL, 2017 - 2030
- Figure 94:
- OTHERS FERTILIZER CONSUMPTION IN USD, GLOBAL, 2017 - 2030
- Figure 95:
- OTHERS FERTILIZER CONSUMPTION VALUE BY CROP TYPE IN %, GLOBAL, 2023 VS 2030
- Figure 96:
- SECONDARY MACRONUTRIENTS FERTILIZER CONSUMPTION BY PRODUCT IN METRIC TON, GLOBAL, 2017 - 2030
- Figure 97:
- SECONDARY MACRONUTRIENTS FERTILIZER CONSUMPTION BY PRODUCT IN USD, GLOBAL, 2017 - 2030
- Figure 98:
- SECONDARY MACRONUTRIENTS FERTILIZER CONSUMPTION VOLUME BY PRODUCT IN %, GLOBAL, 2017 VS 2023 VS 2030
- Figure 99:
- SECONDARY MACRONUTRIENTS FERTILIZER CONSUMPTION VALUE BY PRODUCT IN %, GLOBAL, 2017 VS 2023 VS 2030
- Figure 100:
- CALCIUM FERTILIZER CONSUMPTION IN METRIC TON, GLOBAL, 2017 - 2030
- Figure 101:
- CALCIUM FERTILIZER CONSUMPTION IN USD, GLOBAL, 2017 - 2030
- Figure 102:
- CALCIUM FERTILIZER CONSUMPTION VALUE BY CROP TYPE IN %, GLOBAL, 2023 VS 2030
- Figure 103:
- MAGNESIUM FERTILIZER CONSUMPTION IN METRIC TON, GLOBAL, 2017 - 2030
- Figure 104:
- MAGNESIUM FERTILIZER CONSUMPTION IN USD, GLOBAL, 2017 - 2030
- Figure 105:
- MAGNESIUM FERTILIZER CONSUMPTION VALUE BY CROP TYPE IN %, GLOBAL, 2023 VS 2030
- Figure 106:
- SULFUR FERTILIZER CONSUMPTION IN METRIC TON, GLOBAL, 2017 - 2030
- Figure 107:
- SULFUR FERTILIZER CONSUMPTION IN USD, GLOBAL, 2017 - 2030
- Figure 108:
- SULFUR FERTILIZER CONSUMPTION VALUE BY CROP TYPE IN %, GLOBAL, 2023 VS 2030
- Figure 109:
- FERTILIZER CONSUMPTION BY FORM IN METRIC TON, GLOBAL, 2017 - 2030
- Figure 110:
- FERTILIZER CONSUMPTION BY FORM IN USD, GLOBAL, 2017 - 2030
- Figure 111:
- FERTILIZER CONSUMPTION VOLUME BY FORM IN %, GLOBAL, 2017 VS 2023 VS 2030
- Figure 112:
- FERTILIZER CONSUMPTION VALUE BY FORM IN %, GLOBAL, 2017 VS 2023 VS 2030
- Figure 113:
- CONVENTIONAL FERTILIZER CONSUMPTION IN METRIC TON, GLOBAL, 2017 - 2030
- Figure 114:
- CONVENTIONAL FERTILIZER CONSUMPTION IN USD, GLOBAL, 2017 - 2030
- Figure 115:
- CONVENTIONAL FERTILIZER CONSUMPTION VALUE BY CROP TYPE IN %, GLOBAL, 2023 VS 2030
- Figure 116:
- FERTILIZER CONSUMPTION BY SPECIALITY TYPE IN METRIC TON, GLOBAL, 2017 - 2030
- Figure 117:
- FERTILIZER CONSUMPTION BY SPECIALITY TYPE IN USD, GLOBAL, 2017 - 2030
- Figure 118:
- FERTILIZER CONSUMPTION VOLUME BY SPECIALITY TYPE IN %, GLOBAL, 2017 VS 2023 VS 2030
- Figure 119:
- FERTILIZER CONSUMPTION VALUE BY SPECIALITY TYPE IN %, GLOBAL, 2017 VS 2023 VS 2030
- Figure 120:
- CRF FERTILIZER CONSUMPTION IN METRIC TON, GLOBAL, 2017 - 2030
- Figure 121:
- CRF FERTILIZER CONSUMPTION IN USD, GLOBAL, 2017 - 2030
- Figure 122:
- CRF FERTILIZER CONSUMPTION VALUE BY CROP TYPE IN %, GLOBAL, 2023 VS 2030
- Figure 123:
- LIQUID FERTILIZER CONSUMPTION IN METRIC TON, GLOBAL, 2017 - 2030
- Figure 124:
- LIQUID FERTILIZER CONSUMPTION IN USD, GLOBAL, 2017 - 2030
- Figure 125:
- LIQUID FERTILIZER CONSUMPTION VALUE BY CROP TYPE IN %, GLOBAL, 2023 VS 2030
- Figure 126:
- SRF FERTILIZER CONSUMPTION IN METRIC TON, GLOBAL, 2017 - 2030
- Figure 127:
- SRF FERTILIZER CONSUMPTION IN USD, GLOBAL, 2017 - 2030
- Figure 128:
- SRF FERTILIZER CONSUMPTION VALUE BY CROP TYPE IN %, GLOBAL, 2023 VS 2030
- Figure 129:
- WATER SOLUBLE FERTILIZER CONSUMPTION IN METRIC TON, GLOBAL, 2017 - 2030
- Figure 130:
- WATER SOLUBLE FERTILIZER CONSUMPTION IN USD, GLOBAL, 2017 - 2030
- Figure 131:
- WATER SOLUBLE FERTILIZER CONSUMPTION VALUE BY CROP TYPE IN %, GLOBAL, 2023 VS 2030
- Figure 132:
- FERTILIZER CONSUMPTION BY APPLICATION MODE IN METRIC TON, GLOBAL, 2017 - 2030
- Figure 133:
- FERTILIZER CONSUMPTION BY APPLICATION MODE IN USD, GLOBAL, 2017 - 2030
- Figure 134:
- FERTILIZER CONSUMPTION VOLUME BY APPLICATION MODE IN %, GLOBAL, 2017 VS 2023 VS 2030
- Figure 135:
- FERTILIZER CONSUMPTION VALUE BY APPLICATION MODE IN %, GLOBAL, 2017 VS 2023 VS 2030
- Figure 136:
- FERTIGATION APPLICATION OF FERTILIZER IN METRIC TON, GLOBAL, 2017 - 2030
- Figure 137:
- FERTIGATION APPLICATION OF FERTILIZER IN USD, GLOBAL, 2017 - 2030
- Figure 138:
- FERTIGATION APPLICATION OF FERTILIZER IN VALUE BY CROP TYPE IN %, GLOBAL, 2023 VS 2030
- Figure 139:
- FOLIAR APPLICATION OF FERTILIZER IN METRIC TON, GLOBAL, 2017 - 2030
- Figure 140:
- FOLIAR APPLICATION OF FERTILIZER IN USD, GLOBAL, 2017 - 2030
- Figure 141:
- FOLIAR APPLICATION OF FERTILIZER IN VALUE BY CROP TYPE IN %, GLOBAL, 2023 VS 2030
- Figure 142:
- SOIL APPLICATION OF FERTILIZER IN METRIC TON, GLOBAL, 2017 - 2030
- Figure 143:
- SOIL APPLICATION OF FERTILIZER IN USD, GLOBAL, 2017 - 2030
- Figure 144:
- SOIL APPLICATION OF FERTILIZER IN VALUE BY CROP TYPE IN %, GLOBAL, 2023 VS 2030
- Figure 145:
- FERTILIZER CONSUMPTION BY CROP TYPE IN METRIC TON, GLOBAL, 2017 - 2030
- Figure 146:
- FERTILIZER CONSUMPTION BY CROP TYPE IN USD, GLOBAL, 2017 - 2030
- Figure 147:
- FERTILIZER CONSUMPTION VOLUME BY CROP TYPE IN %, GLOBAL, 2017 VS 2023 VS 2030
- Figure 148:
- FERTILIZER CONSUMPTION VALUE BY CROP TYPE IN %, GLOBAL, 2017 VS 2023 VS 2030
- Figure 149:
- FERTILIZER CONSUMPTION BY FIELD CROPS IN METRIC TON, GLOBAL, 2017 - 2030
- Figure 150:
- FERTILIZER CONSUMPTION BY FIELD CROPS IN USD, GLOBAL, 2017 - 2030
- Figure 151:
- FERTILIZER CONSUMPTION VALUE BY TYPE IN %, GLOBAL, 2023 VS 2030
- Figure 152:
- FERTILIZER CONSUMPTION BY HORTICULTURAL CROPS IN METRIC TON, GLOBAL, 2017 - 2030
- Figure 153:
- FERTILIZER CONSUMPTION BY HORTICULTURAL CROPS IN USD, GLOBAL, 2017 - 2030
- Figure 154:
- FERTILIZER CONSUMPTION VALUE BY TYPE IN %, GLOBAL, 2023 VS 2030
- Figure 155:
- FERTILIZER CONSUMPTION BY TURF & ORNAMENTAL IN METRIC TON, GLOBAL, 2017 - 2030
- Figure 156:
- FERTILIZER CONSUMPTION BY TURF & ORNAMENTAL IN USD, GLOBAL, 2017 - 2030
- Figure 157:
- FERTILIZER CONSUMPTION VALUE BY TYPE IN %, GLOBAL, 2023 VS 2030
- Figure 158:
- FERTILIZER CONSUMPTION BY REGION IN METRIC TON, GLOBAL, 2017 - 2030
- Figure 159:
- FERTILIZER CONSUMPTION BY REGION IN USD, GLOBAL, 2017 - 2030
- Figure 160:
- FERTILIZER CONSUMPTION VOLUME BY REGION IN %, GLOBAL, 2017 VS 2023 VS 2030
- Figure 161:
- FERTILIZER CONSUMPTION VALUE BY REGION IN %, GLOBAL, 2017 VS 2023 VS 2030
- Figure 162:
- FERTILIZER CONSUMPTION BY COUNTRY IN METRIC TON, ASIA-PACIFIC, 2017 - 2030
- Figure 163:
- FERTILIZER CONSUMPTION BY COUNTRY IN USD, ASIA-PACIFIC, 2017 - 2030
- Figure 164:
- FERTILIZER CONSUMPTION VOLUME BY COUNTRY IN %, ASIA-PACIFIC, 2017 VS 2023 VS 2030
- Figure 165:
- FERTILIZER CONSUMPTION VALUE BY COUNTRY IN %, ASIA-PACIFIC, 2017 VS 2023 VS 2030
- Figure 166:
- FERTILIZER CONSUMPTION IN METRIC TON, AUSTRALIA, 2017 - 2030
- Figure 167:
- FERTILIZER CONSUMPTION IN USD, AUSTRALIA, 2017 - 2030
- Figure 168:
- FERTILIZER CONSUMPTION VALUE BY CROP TYPE IN %, AUSTRALIA, 2023 VS 2030
- Figure 169:
- FERTILIZER CONSUMPTION IN METRIC TON, BANGLADESH, 2017 - 2030
- Figure 170:
- FERTILIZER CONSUMPTION IN USD, BANGLADESH, 2017 - 2030
- Figure 171:
- FERTILIZER CONSUMPTION VALUE BY CROP TYPE IN %, BANGLADESH, 2023 VS 2030
- Figure 172:
- FERTILIZER CONSUMPTION IN METRIC TON, CHINA, 2017 - 2030
- Figure 173:
- FERTILIZER CONSUMPTION IN USD, CHINA, 2017 - 2030
- Figure 174:
- FERTILIZER CONSUMPTION VALUE BY CROP TYPE IN %, CHINA, 2023 VS 2030
- Figure 175:
- FERTILIZER CONSUMPTION IN METRIC TON, INDIA, 2017 - 2030
- Figure 176:
- FERTILIZER CONSUMPTION IN USD, INDIA, 2017 - 2030
- Figure 177:
- FERTILIZER CONSUMPTION VALUE BY CROP TYPE IN %, INDIA, 2023 VS 2030
- Figure 178:
- FERTILIZER CONSUMPTION IN METRIC TON, INDONESIA, 2017 - 2030
- Figure 179:
- FERTILIZER CONSUMPTION IN USD, INDONESIA, 2017 - 2030
- Figure 180:
- FERTILIZER CONSUMPTION VALUE BY CROP TYPE IN %, INDONESIA, 2023 VS 2030
- Figure 181:
- FERTILIZER CONSUMPTION IN METRIC TON, JAPAN, 2017 - 2030
- Figure 182:
- FERTILIZER CONSUMPTION IN USD, JAPAN, 2017 - 2030
- Figure 183:
- FERTILIZER CONSUMPTION VALUE BY CROP TYPE IN %, JAPAN, 2023 VS 2030
- Figure 184:
- FERTILIZER CONSUMPTION IN METRIC TON, PAKISTAN, 2017 - 2030
- Figure 185:
- FERTILIZER CONSUMPTION IN USD, PAKISTAN, 2017 - 2030
- Figure 186:
- FERTILIZER CONSUMPTION VALUE BY CROP TYPE IN %, PAKISTAN, 2023 VS 2030
- Figure 187:
- FERTILIZER CONSUMPTION IN METRIC TON, PHILIPPINES, 2017 - 2030
- Figure 188:
- FERTILIZER CONSUMPTION IN USD, PHILIPPINES, 2017 - 2030
- Figure 189:
- FERTILIZER CONSUMPTION VALUE BY CROP TYPE IN %, PHILIPPINES, 2023 VS 2030
- Figure 190:
- FERTILIZER CONSUMPTION IN METRIC TON, THAILAND, 2017 - 2030
- Figure 191:
- FERTILIZER CONSUMPTION IN USD, THAILAND, 2017 - 2030
- Figure 192:
- FERTILIZER CONSUMPTION VALUE BY CROP TYPE IN %, THAILAND, 2023 VS 2030
- Figure 193:
- FERTILIZER CONSUMPTION IN METRIC TON, VIETNAM, 2017 - 2030
- Figure 194:
- FERTILIZER CONSUMPTION IN USD, VIETNAM, 2017 - 2030
- Figure 195:
- FERTILIZER CONSUMPTION VALUE BY CROP TYPE IN %, VIETNAM, 2023 VS 2030
- Figure 196:
- FERTILIZER CONSUMPTION IN METRIC TON, REST OF ASIA-PACIFIC, 2017 - 2030
- Figure 197:
- FERTILIZER CONSUMPTION IN USD, REST OF ASIA-PACIFIC, 2017 - 2030
- Figure 198:
- FERTILIZER CONSUMPTION VALUE BY CROP TYPE IN %, REST OF ASIA-PACIFIC, 2023 VS 2030
- Figure 199:
- FERTILIZER CONSUMPTION BY COUNTRY IN METRIC TON, EUROPE, 2017 - 2030
- Figure 200:
- FERTILIZER CONSUMPTION BY COUNTRY IN USD, EUROPE, 2017 - 2030
- Figure 201:
- FERTILIZER CONSUMPTION VOLUME BY COUNTRY IN %, EUROPE, 2017 VS 2023 VS 2030
- Figure 202:
- FERTILIZER CONSUMPTION VALUE BY COUNTRY IN %, EUROPE, 2017 VS 2023 VS 2030
- Figure 203:
- FERTILIZER CONSUMPTION IN METRIC TON, FRANCE, 2017 - 2030
- Figure 204:
- FERTILIZER CONSUMPTION IN USD, FRANCE, 2017 - 2030
- Figure 205:
- FERTILIZER CONSUMPTION VALUE BY CROP TYPE IN %, FRANCE, 2023 VS 2030
- Figure 206:
- FERTILIZER CONSUMPTION IN METRIC TON, GERMANY, 2017 - 2030
- Figure 207:
- FERTILIZER CONSUMPTION IN USD, GERMANY, 2017 - 2030
- Figure 208:
- FERTILIZER CONSUMPTION VALUE BY CROP TYPE IN %, GERMANY, 2023 VS 2030
- Figure 209:
- FERTILIZER CONSUMPTION IN METRIC TON, ITALY, 2017 - 2030
- Figure 210:
- FERTILIZER CONSUMPTION IN USD, ITALY, 2017 - 2030
- Figure 211:
- FERTILIZER CONSUMPTION VALUE BY CROP TYPE IN %, ITALY, 2023 VS 2030
- Figure 212:
- FERTILIZER CONSUMPTION IN METRIC TON, NETHERLANDS, 2017 - 2030
- Figure 213:
- FERTILIZER CONSUMPTION IN USD, NETHERLANDS, 2017 - 2030
- Figure 214:
- FERTILIZER CONSUMPTION VALUE BY CROP TYPE IN %, NETHERLANDS, 2023 VS 2030
- Figure 215:
- FERTILIZER CONSUMPTION IN METRIC TON, RUSSIA, 2017 - 2030
- Figure 216:
- FERTILIZER CONSUMPTION IN USD, RUSSIA, 2017 - 2030
- Figure 217:
- FERTILIZER CONSUMPTION VALUE BY CROP TYPE IN %, RUSSIA, 2023 VS 2030
- Figure 218:
- FERTILIZER CONSUMPTION IN METRIC TON, SPAIN, 2017 - 2030
- Figure 219:
- FERTILIZER CONSUMPTION IN USD, SPAIN, 2017 - 2030
- Figure 220:
- FERTILIZER CONSUMPTION VALUE BY CROP TYPE IN %, SPAIN, 2023 VS 2030
- Figure 221:
- FERTILIZER CONSUMPTION IN METRIC TON, UKRAINE, 2017 - 2030
- Figure 222:
- FERTILIZER CONSUMPTION IN USD, UKRAINE, 2017 - 2030
- Figure 223:
- FERTILIZER CONSUMPTION VALUE BY CROP TYPE IN %, UKRAINE, 2023 VS 2030
- Figure 224:
- FERTILIZER CONSUMPTION IN METRIC TON, UNITED KINGDOM, 2017 - 2030
- Figure 225:
- FERTILIZER CONSUMPTION IN USD, UNITED KINGDOM, 2017 - 2030
- Figure 226:
- FERTILIZER CONSUMPTION VALUE BY CROP TYPE IN %, UNITED KINGDOM, 2023 VS 2030
- Figure 227:
- FERTILIZER CONSUMPTION IN METRIC TON, REST OF EUROPE, 2017 - 2030
- Figure 228:
- FERTILIZER CONSUMPTION IN USD, REST OF EUROPE, 2017 - 2030
- Figure 229:
- FERTILIZER CONSUMPTION VALUE BY CROP TYPE IN %, REST OF EUROPE, 2023 VS 2030
- Figure 230:
- FERTILIZER CONSUMPTION BY COUNTRY IN METRIC TON, MIDDLE EAST & AFRICA, 2017 - 2030
- Figure 231:
- FERTILIZER CONSUMPTION BY COUNTRY IN USD, MIDDLE EAST & AFRICA, 2017 - 2030
- Figure 232:
- FERTILIZER CONSUMPTION VOLUME BY COUNTRY IN %, MIDDLE EAST & AFRICA, 2017 VS 2023 VS 2030
- Figure 233:
- FERTILIZER CONSUMPTION VALUE BY COUNTRY IN %, MIDDLE EAST & AFRICA, 2017 VS 2023 VS 2030
- Figure 234:
- FERTILIZER CONSUMPTION IN METRIC TON, NIGERIA, 2017 - 2030
- Figure 235:
- FERTILIZER CONSUMPTION IN USD, NIGERIA, 2017 - 2030
- Figure 236:
- FERTILIZER CONSUMPTION VALUE BY CROP TYPE IN %, NIGERIA, 2023 VS 2030
- Figure 237:
- FERTILIZER CONSUMPTION IN METRIC TON, SAUDI ARABIA, 2017 - 2030
- Figure 238:
- FERTILIZER CONSUMPTION IN USD, SAUDI ARABIA, 2017 - 2030
- Figure 239:
- FERTILIZER CONSUMPTION VALUE BY CROP TYPE IN %, SAUDI ARABIA, 2023 VS 2030
- Figure 240:
- FERTILIZER CONSUMPTION IN METRIC TON, SOUTH AFRICA, 2017 - 2030
- Figure 241:
- FERTILIZER CONSUMPTION IN USD, SOUTH AFRICA, 2017 - 2030
- Figure 242:
- FERTILIZER CONSUMPTION VALUE BY CROP TYPE IN %, SOUTH AFRICA, 2023 VS 2030
- Figure 243:
- FERTILIZER CONSUMPTION IN METRIC TON, TURKEY, 2017 - 2030
- Figure 244:
- FERTILIZER CONSUMPTION IN USD, TURKEY, 2017 - 2030
- Figure 245:
- FERTILIZER CONSUMPTION VALUE BY CROP TYPE IN %, TURKEY, 2023 VS 2030
- Figure 246:
- FERTILIZER CONSUMPTION IN METRIC TON, REST OF MIDDLE EAST & AFRICA, 2017 - 2030
- Figure 247:
- FERTILIZER CONSUMPTION IN USD, REST OF MIDDLE EAST & AFRICA, 2017 - 2030
- Figure 248:
- FERTILIZER CONSUMPTION VALUE BY CROP TYPE IN %, REST OF MIDDLE EAST & AFRICA, 2023 VS 2030
- Figure 249:
- FERTILIZER CONSUMPTION BY COUNTRY IN METRIC TON, NORTH AMERICA, 2017 - 2030
- Figure 250:
- FERTILIZER CONSUMPTION BY COUNTRY IN USD, NORTH AMERICA, 2017 - 2030
- Figure 251:
- FERTILIZER CONSUMPTION VOLUME BY COUNTRY IN %, NORTH AMERICA, 2017 VS 2023 VS 2030
- Figure 252:
- FERTILIZER CONSUMPTION VALUE BY COUNTRY IN %, NORTH AMERICA, 2017 VS 2023 VS 2030
- Figure 253:
- FERTILIZER CONSUMPTION IN METRIC TON, CANADA, 2017 - 2030
- Figure 254:
- FERTILIZER CONSUMPTION IN USD, CANADA, 2017 - 2030
- Figure 255:
- FERTILIZER CONSUMPTION VALUE BY CROP TYPE IN %, CANADA, 2023 VS 2030
- Figure 256:
- FERTILIZER CONSUMPTION IN METRIC TON, MEXICO, 2017 - 2030
- Figure 257:
- FERTILIZER CONSUMPTION IN USD, MEXICO, 2017 - 2030
- Figure 258:
- FERTILIZER CONSUMPTION VALUE BY CROP TYPE IN %, MEXICO, 2023 VS 2030
- Figure 259:
- FERTILIZER CONSUMPTION IN METRIC TON, UNITED STATES, 2017 - 2030
- Figure 260:
- FERTILIZER CONSUMPTION IN USD, UNITED STATES, 2017 - 2030
- Figure 261:
- FERTILIZER CONSUMPTION VALUE BY CROP TYPE IN %, UNITED STATES, 2023 VS 2030
- Figure 262:
- FERTILIZER CONSUMPTION IN METRIC TON, REST OF NORTH AMERICA, 2017 - 2030
- Figure 263:
- FERTILIZER CONSUMPTION IN USD, REST OF NORTH AMERICA, 2017 - 2030
- Figure 264:
- FERTILIZER CONSUMPTION VALUE BY CROP TYPE IN %, REST OF NORTH AMERICA, 2023 VS 2030
- Figure 265:
- FERTILIZER CONSUMPTION BY COUNTRY IN METRIC TON, SOUTH AMERICA, 2017 - 2030
- Figure 266:
- FERTILIZER CONSUMPTION BY COUNTRY IN USD, SOUTH AMERICA, 2017 - 2030
- Figure 267:
- FERTILIZER CONSUMPTION VOLUME BY COUNTRY IN %, SOUTH AMERICA, 2017 VS 2023 VS 2030
- Figure 268:
- FERTILIZER CONSUMPTION VALUE BY COUNTRY IN %, SOUTH AMERICA, 2017 VS 2023 VS 2030
- Figure 269:
- FERTILIZER CONSUMPTION IN METRIC TON, ARGENTINA, 2017 - 2030
- Figure 270:
- FERTILIZER CONSUMPTION IN USD, ARGENTINA, 2017 - 2030
- Figure 271:
- FERTILIZER CONSUMPTION VALUE BY CROP TYPE IN %, ARGENTINA, 2023 VS 2030
- Figure 272:
- FERTILIZER CONSUMPTION IN METRIC TON, BRAZIL, 2017 - 2030
- Figure 273:
- FERTILIZER CONSUMPTION IN USD, BRAZIL, 2017 - 2030
- Figure 274:
- FERTILIZER CONSUMPTION VALUE BY CROP TYPE IN %, BRAZIL, 2023 VS 2030
- Figure 275:
- FERTILIZER CONSUMPTION IN METRIC TON, REST OF SOUTH AMERICA, 2017 - 2030
- Figure 276:
- FERTILIZER CONSUMPTION IN USD, REST OF SOUTH AMERICA, 2017 - 2030
- Figure 277:
- FERTILIZER CONSUMPTION VALUE BY CROP TYPE IN %, REST OF SOUTH AMERICA, 2023 VS 2030
- Figure 278:
- MOST ACTIVE COMPANIES BY NUMBER OF STRATEGIC MOVES, GLOBAL, 2017 - 2030
- Figure 279:
- GLOBAL FERTILIZERS MARKET, MOST ADOPTED STRATEGIES, 2018 - 2021
- Figure 280:
- MARKET SHARE OF MAJOR PLAYERS IN %, GLOBAL
Fertilizers Industry Segmentation
Complex, Straight are covered as segments by Type. Conventional, Speciality are covered as segments by Form. Fertigation, Foliar, Soil are covered as segments by Application Mode. Field Crops, Horticultural Crops, Turf & Ornamental are covered as segments by Crop Type. Asia-Pacific, Europe, Middle East & Africa, North America, South America are covered as segments by Region.| Type | Complex | |||
| Straight | Micronutrients | Boron | ||
| Copper | ||||
| Iron | ||||
| Manganese | ||||
| Molybdenum | ||||
| Zinc | ||||
| Others | ||||
| Nitrogenous | Ammonium Nitrate | |||
| Anhydrous Ammonia | ||||
| Urea | ||||
| Others | ||||
| Phosphatic | DAP | |||
| MAP | ||||
| SSP | ||||
| TSP | ||||
| Others | ||||
| Potassic | MoP | |||
| SoP | ||||
| Others | ||||
| Secondary Macronutrients | Calcium | |||
| Magnesium | ||||
| Sulfur | ||||
| Form | Conventional | |||
| Speciality | CRF | |||
| Liquid Fertilizer | ||||
| SRF | ||||
| Water Soluble | ||||
| Application Mode | Fertigation | |||
| Foliar | ||||
| Soil | ||||
| Crop Type | Field Crops | |||
| Horticultural Crops | ||||
| Turf & Ornamental | ||||
| Region | Asia-Pacific | Australia | ||
| Bangladesh | ||||
| China | ||||
| India | ||||
| Indonesia | ||||
| Japan | ||||
| Pakistan | ||||
| Philippines | ||||
| Thailand | ||||
| Vietnam | ||||
| Rest of Asia-Pacific | ||||
| Europe | France | |||
| Germany | ||||
| Italy | ||||
| Netherlands | ||||
| Russia | ||||
| Spain | ||||
| Ukraine | ||||
| United Kingdom | ||||
| Rest of Europe | ||||
| Middle East & Africa | Nigeria | |||
| Saudi Arabia | ||||
| South Africa | ||||
| Turkey | ||||
| Rest of Middle East & Africa | ||||
| North America | Canada | |||
| Mexico | ||||
| United States | ||||
| Rest of North America | ||||
| South America | Argentina | |||
| Brazil | ||||
| Rest of South America | ||||
Need A Different Region or Segment?
Customize Now
Market Definition
- MARKET ESTIMATION LEVEL - Market Estimations for various types of fertilizers has been done at the product-level and not at the nutrient-level.
- NUTRIENT TYPES COVERED - Primary Nutrients: N, P and K, Secondary Macronutrients: Ca, Mg and S, Micronutients: Zn, Mn, Cu, Fe, Mo, B, and Others
- AVERAGE NUTRIENT APPLICATION RATE - This refers to the average volume of nutrient consumed per hectare of farmland in each country.
- CROP TYPES COVERED - Field Crops: Cereals, Pulses, Oilseeds, and Fiber Crops Horticulture: Fruits, Vegetables, Plantation Crops and Spices, Turf Grass and Ornamentals
| Keyword | Definition |
|---|---|
| Fertilizer | Chemical substance applied to crops to ensure nutritional requirements, available in various forms such as granules, powders, liquid, water soluble, etc. |
| Specialty Fertilizer | Used for enhanced efficiency and nutrient availability applied through soil, foliar, and fertigation. Includes CRF, SRF, liquid fertilizer, and water soluble fertilizers. |
| Controlled-Release Fertilizers (CRF) | Coated with materials such as polymer, polymer-sulfur, and other materials such as resins to ensure nutrient availability to the crop for its entire life cycle. |
| Slow-Release Fertilizers (SRF) | Coated with materials such as sulfur, neem, etc., to ensure nutrient availability to the crop for a longer period. |
| Foliar Fertilizers | Consist of both liquid and water soluble fertilizers applied through foliar application. |
| Water-Soluble Fertilizers | Available in various forms including liquid, powder, etc., used in foliar and fertigation mode of fertilizer application. |
| Fertigation | Fertilizers applied through different irrigation systems such as drip irrigation, micro irrigation, sprinkler irrigation, etc. |
| Anhydrous Ammonia | Used as fertilizer, directly injected into the soil, available in gaseous liquid form. |
| Single Super Phosphate (SSP) | Phosphorus fertilizer containing only phosphorus which has lesser than or equal to 35%. |
| Triple Super Phosphate (TSP) | Phosphorus fertilizer containing only phosphorus greater than 35%. |
| Enhanced Efficiency Fertilizers | Fertilizers coated or treated with additional layers of various ingredients to make it more efficient compared to other fertilizers. |
| Conventional Fertilizer | Fertilizers applied to crops through traditional methods including broadcasting, row placement, ploughing soil placement, etc. |
| Chelated Micronutrients | Micronutrient fertilizers coated with chelating agents such as EDTA, EDDHA, DTPA, HEDTA, etc. |
| Liquid Fertilizers | Available in liquid form, majorly used for application of fertilizers to crops through foliar and fertigation. |
Need More Details on Market Definition?
Ask a Question
Research Methodology
Mordor Intelligence follows a four-step methodology in all our reports.
- Step-1: IDENTIFY KEY VARIABLES: In order to build a robust forecasting methodology, the variables and factors identified in Step-1 are tested against available historical market numbers. Through an iterative process, the variables required for market forecast are set and the model is built on the basis of these variables.
- Step-2: Build a Market Model: Market-size estimations for the forecast years are in nominal terms. Inflation is not a part of the pricing, and the average selling price (ASP) is kept constant throughout the forecast period for each country.
- Step-3: Validate and Finalize: In this important step, all market numbers, variables and analyst calls are validated through an extensive network of primary research experts from the market studied. The respondents are selected across levels and functions to generate a holistic picture of the market studied.
- Step-4: Research Outputs: Syndicated Reports, Custom Consulting Assignments, Databases & Subscription Platforms

Get More Details On Research Methodology
Download PDF


