
Fertility Supplement Market Size and Share
Market Overview
| Study Period | 2020 - 2031 |
|---|---|
| Market Size (2026) | USD 2.88 Billion |
| Market Size (2031) | USD 3.94 Billion |
| Growth Rate (2026 - 2031) | 6.49 % |
| Fastest Growing Market | Asia-Pacific |
| Largest Market | North America |
| Market Concentration | Low |
Major Players *Disclaimer: Major Players sorted in no particular order Image © Mordor Intelligence. Reuse requires attribution under CC BY 4.0. | |
Fertility Supplement Market Analysis by Mordor Intelligence
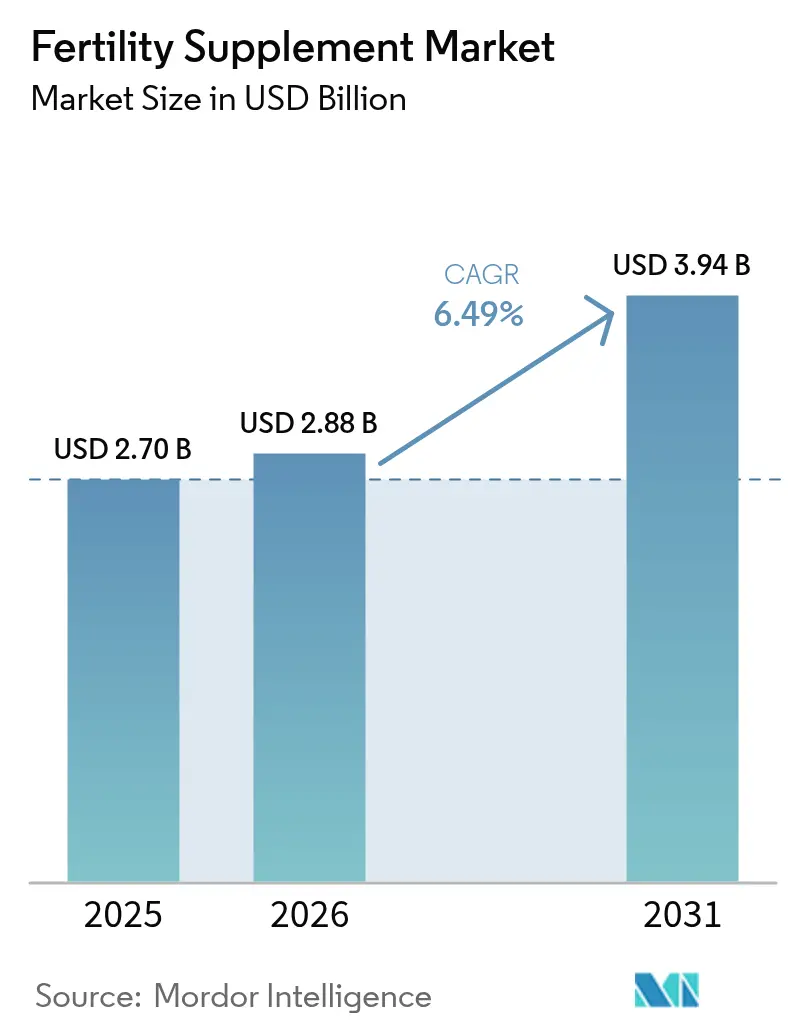
The Fertility Supplement Market size was valued at USD 2.70 billion in 2025 and estimated to grow from USD 2.88 billion in 2026 to reach USD 3.94 billion by 2031, at a CAGR of 6.49% during the forecast period (2026-2031).
Momentum is sustained by rising infertility prevalence, stronger pre-conception health awareness, and broader assisted-reproductive-technology (ART) adoption in both developed and emerging economies. Clinical data confirming the reproductive benefits of nutrients such as coenzyme Q10, methylfolate and L-carnitine is helping brands justify premium pricing while building medical-community credibility[1]U.S. Food & Drug Administration, “New Dietary Ingredient Notification Final Rule,” Federal Register, federalregister.gov. Meanwhile, employers in the United States have expanded fertility coverage—from 30% in 2020 to 42% in 2024—fueling demand for adjunctive nutritional protocols that can be taken before or during ART cycles. Online sales channels, coupled with rising regulatory scrutiny over product safety and claim substantiation, continue to redefine competitive strategy and accelerate innovation across the fertility supplements market.
Key Report Takeaways
- By ingredient, natural formulations commanded 54.22% of fertility supplements market share in 2025, while blends of natural and synthetic ingredients are projected to post the fastest 8.39% CAGR through 2031.
- By consumer, female-specific products held 52.02% share of the fertility supplements market size in 2025, whereas male-specific lines are expected to expand at an 8.41% CAGR to 2031.
- By form, capsules led with a 37.76% revenue contribution in 2025; gummies represent the quickest-rising format with a 9.12% CAGR to 2031.
- By distribution channel, retail pharmacy retained 43.08% share in 2025, though e-pharmacy is scaling at 9.08% CAGR on the back of convenience and privacy benefits.
- By region, North America captured 35.41% of the fertility supplements market share in 2025, while Asia-Pacific is set to grow the fastest, logging a 7.48% CAGR through 2031.
Note: Market size and forecast figures in this report are generated using Mordor Intelligence’s proprietary estimation framework, updated with the latest available data and insights as of 2026.
Global Fertility Supplement Market Trends and Insights
Drivers Impact Analysis*
| Driver | % Impact on CAGR Forecast | Geographic Relevance | Impact Timeline |
|---|---|---|---|
| Rising Global Infertility Incidence | +1.8% | Global; highest in Asia-Pacific & North America | Long term (≥ 4 years) |
| Growing Awareness Of Preconception Nutrition | +1.2% | North America & Europe; expanding into Asia-Pacific | Medium term (2-4 years) |
| Expansion Of Assisted Reproductive Technologies | +1.0% | Global; concentrated in developed markets | Long term (≥ 4 years) |
| Increasing Disposable Income And Healthcare Spending | +0.9% | Asia-Pacific core; spill-over to Latin America | Medium term (2-4 years) |
| Product Innovations With Evidence-Based Ingredients | +0.7% | Global; led by North America & Europe | Short term (≤ 2 years) |
| Proliferation Of Online And Retail Distribution Channels | +0.5% | Global; fastest in Asia-Pacific | Short term (≤ 2 years) |
| Source: Mordor Intelligence | |||


Rising Global Infertility Incidence
Roughly 8–12% of couples now struggle with male-factor infertility, and secondary infertility is climbing sharply across Asia-Pacific, with the Philippines reporting some of the highest regional rates. Contributing factors—later childbearing, sedentary lifestyles and environmental stressors—have moved fertility supplements from discretionary status to perceived healthcare essentials. Evidence for nutrients such as myo-inositol and selenium in managing polycystic ovary syndrome (PCOS) underpins long-range demand, particularly for women who postpone pregnancy into their thirties. These structural epidemiological shifts establish a durable growth platform for the fertility supplements market.
Growing Awareness of Preconception Nutrition
Survey work across five high-income countries shows the United States leading on pre-conception knowledge, yet uptake of recommended micronutrient regimens remains inconsistent. Physician guidance is the most trusted information source, elevating clinical backing as a sales catalyst. Research linking optimal copper, manganese and vitamin B12 levels during pregnancy to lower mid-life blood-pressure risk widens the conversation from immediate conception to lifelong health outcomes. By embedding these insights, brands are positioning fertility supplements as part of holistic prenatal wellness rather than short-term fixes.
Expansion of Assisted Reproductive Technologies
The global fertility-services arena is on track to double from USD 35 billion in 2023 to more than USD 70 billion by 2033, paced by a 10% CAGR in Asia. With a single IVF cycle costing USD 30,000–40,000, nutraceuticals that improve oocyte or sperm quality represent cost-effective adjuncts. Resveratrol-fortified multivitamins have delivered higher numbers of mature follicles and raised fertilization rates relative to folic-acid-only controls. Modern sperm-selection devices such as Q300™ drive cumulative pregnancy rates up to 65%, and patients often pair these technologies with antioxidant regimens to maximize outcomes. Together, these trends embed the fertility supplements market deeper into clinical fertility protocols.
Increasing Disposable Income and Healthcare Spending
The expanding middle class in China, India and Southeast Asia is channeling larger household budgets toward reproductive health. Rising insurance coverage for ART, plus government incentives in select provinces, reinforces demand for preparatory micronutrients. Latin American economies are following a similar arc, albeit at an earlier stage, offering incremental runway for the fertility supplements industry.
Restraints Impact Analysis*
| Restraints Impact Analysis | (~) % Impact on CAGR Forecast | Geographic Relevance | Impact Timeline |
|---|---|---|---|
| Stringent regulatory oversight on supplement claims | -0.8% | Global; strictest in North America & Europe | Medium term (2-4 years) |
| Limited clinical evidence supporting efficacy | -0.6% | Global; impacts premium-price tiers | Long term (≥ 4 years) |
| High price sensitivity among consumers | -0.5% | Emerging markets & price-conscious segments worldwide | Short term (≤ 2 years) |
| Competition from alternative treatment modalities | -0.4% | Global; stronger where ART coverage is expanding | Medium term (2-4 years) |
| Source: Mordor Intelligence | |||
Stringent Regulatory Oversight on Supplement Claims
The U.S. FDA now mandates a 75-day pre-market notification for novel dietary ingredients, including substantial toxicology data, before commercialization[2]Center for Science in the Public Interest, “Fertility Claim Warning Letter,” cspinet.org. California’s pending SB 646 will require heavy-metal testing for prenatal vitamins, and advocacy bodies such as the Center for Science in the Public Interest have openly challenged unsubstantiated fertility claims[3] U.S. Food & Drug Administration, “New Dietary Ingredient Notification Final Rule,” Federal Register, federalregister.gov. Compliance outlays climb fastest for smaller firms, effectively raising entry barriers yet gradually building consumer confidence in the fertility supplements market.
Limited Clinical Evidence Supporting Efficacy
While antioxidants can improve sperm concentration and motility, systematic reviews reveal poor linkage to actual live-birth outcomes, owing to study bias and small sample sizes. The evidence gap deters healthcare professionals from recommending high-priced blends lacking robust randomized controlled trials. Brands investing in gold-standard studies, however, can translate validated outcomes into defensible premiums, thereby differentiating themselves within the fertility supplements industry.
*Our forecasts treat driver/restraint impacts as directional, not additive. The impact forecasts reflect baseline growth, mix effects, and variable interactions.
Segment Analysis
By Ingredient: Natural Dominance Faces Synthetic Innovation
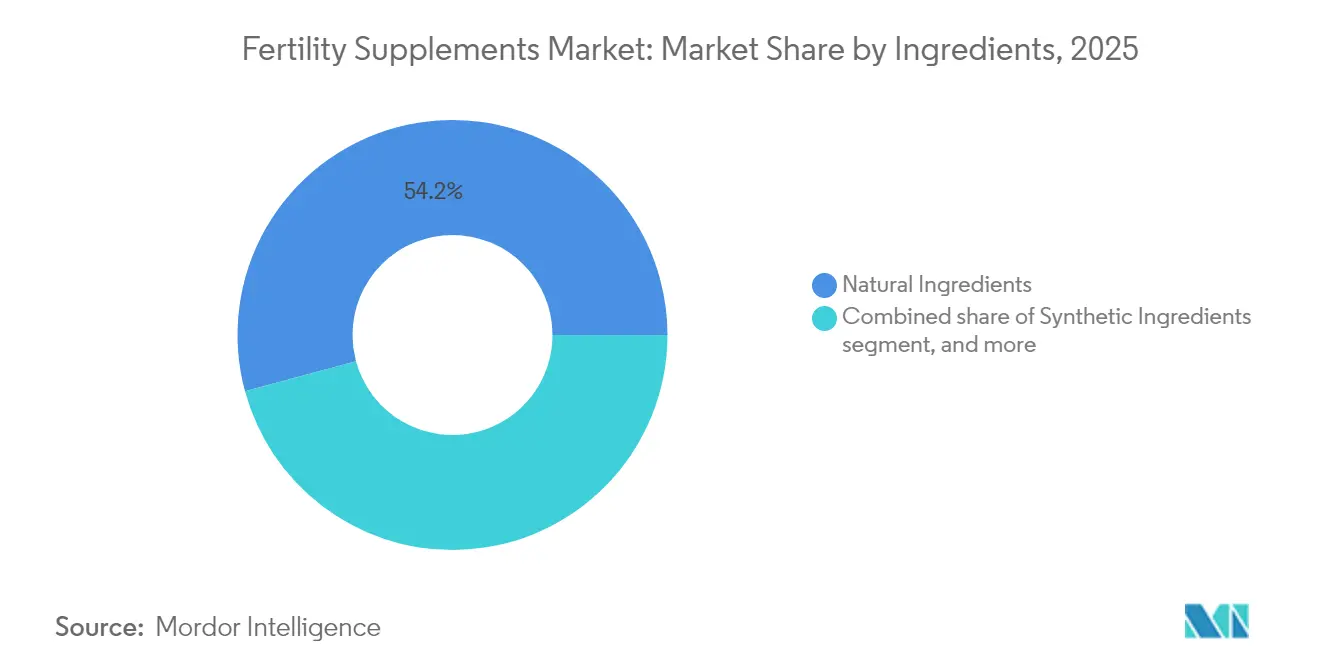
Natural ingredients accounted for 54.22% of the fertility supplements market in 2025, reflecting consumer trust in botanicals such as maca, ashwagandha and tribul us. Vitamins and minerals with long clinical pedigrees—folic acid, zinc and selenium—continue to anchor many formulations. Antioxidants like coenzyme Q10 and omega-3 fatty acids are increasingly positioned as gamete-protective agents against oxidative stress. Synthetic bioactives still meet hesitation, but science-driven messaging around higher absorption and genetic suitability is helping to bridge perceptions.
The blend segment is forecast to log the fastest 8.39% CAGR through 2031, marrying botanical familiarity with synthetic precision. Brands are styling these hybrids as “clinically complete” solutions, justifying premium price tags through comprehensive label claims. For example, Quatrefolic’s superior absorption profile is being paired with whole-herb inositol to meet both female-fertility and MTHFR-related needs. This positioning aligns with rising willingness in North America and Asia-Pacific to invest in condition-specific micronutrient stacks, a critical propellant for the fertility supplements market.


By Form: Capsules Lead While Gummies Surge
Capsules retained a 37.76% revenue share in 2025, appreciated for dose precision and easy inclusion of multi-ingredient matrices. Softgels dominate fat-soluble nutrients such as omega-3 DHA and ubiquinol, whereas tablets offer manufacturing economies for mass-market SKUs. Powders and ready-mix sachets fulfill niche preferences for additive-free or customizable dosing, yet palatability hurdles limit their mainstream uptake.
Gummies are projected to progress at a 9.12% CAGR to 2031—a trajectory mirrored in several adjacent supplement categories—as younger consumers equate health maintenance with snack-like convenience. Formulators address thermal sensitivity and sugar-content warnings by deploying pectin bases and lower-glycemic sweeteners. Should these technological refinements hold, gummies will carve out a larger slice of the fertility supplements market, especially in e-pharmacy baskets.
By Consumer: Female Focus Expands to Male Awareness
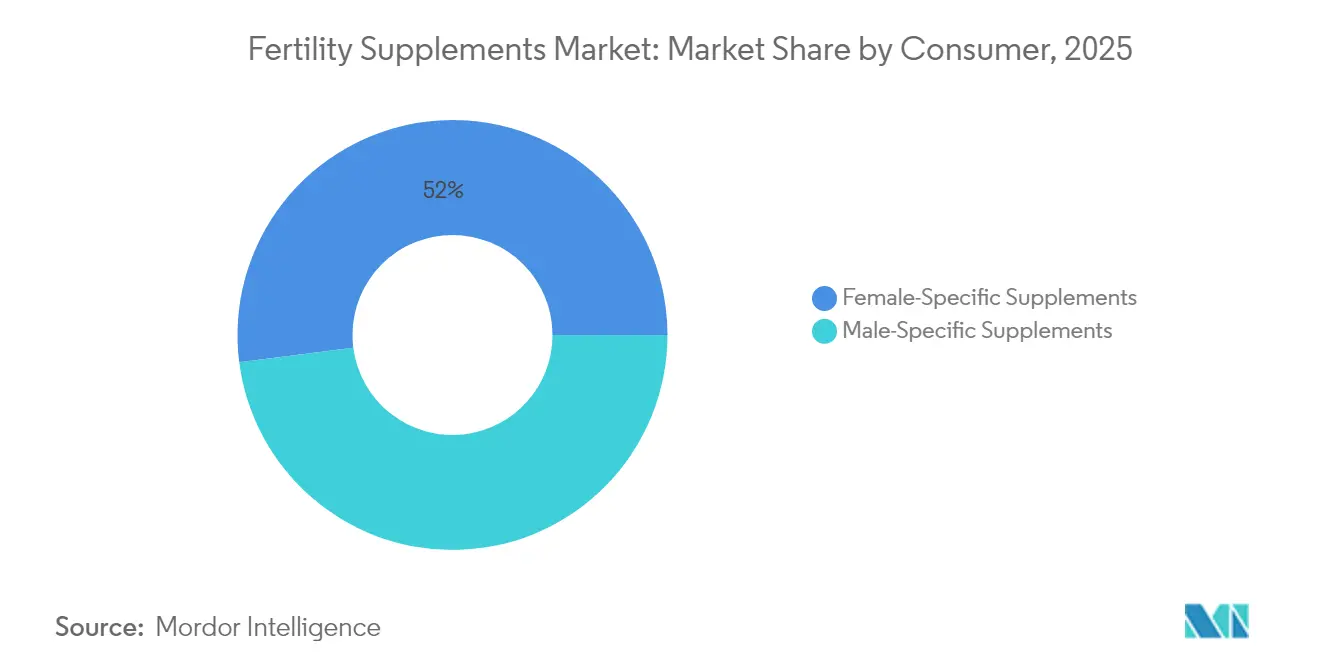
Women-oriented products held 52.02% of the fertility supplements market size in 2025, underpinned by folic-acid mandates and stronger OB-GYN engagement. PCOS-targeting blends that couple myo-inositol with selenium and probiotics are showing rapid shelf-rotation in Asia-Pacific pharmacies. Demand is further stoked by delayed motherhood trends and employer-backed fertility benefit coverage in the United States.
Male-specific SKUs are advancing the fastest at an 8.41% CAGR, aided by greater public exposure of male-factor infertility statistics and encouraging data on L-carnitine, omega-3s and CoQ10. A three-month, 3 g/daily L-carnitine protocol lifted sperm motility from 15% to 50% and count from 25 million/mL to 49 million/mL, validating nutrient intervention for asthenozoospermic patients. Couple-centric bundles—one box for him, one for her—are now common, simplifying buying decisions and enlarging revenue per household within the fertility supplements market.
By Distribution Channel: E-Pharmacy Disrupts Traditional Retail
Retail pharmacies preserved 43.08% market share in 2025 on the strength of in-store clinical advice. Shelf adjacency to prenatal vitamins fosters impulse purchases among women planning pregnancy. Brick-and-mortar chains are experimenting with point-of-care fertility screening kits that funnel shoppers toward bundle deals including ovulation strips and antioxidant capsules.
E-pharmacy is tracking a 9.08% CAGR, catalyzed by discreet procurement, subscription auto-ship and AI-driven product matching. Asia-Pacific markets, where smartphone penetration eclipses primary healthcare infrastructure, illustrate the channel’s capacity to democratize access to premium formulations. Direct-to-consumer startups exploit this momentum through social-media storytelling, while legacy brands counter by strengthening omnichannel presences. As such, online platforms are set to command a larger portion of the fertility supplements market over the forecast horizon.
Geography Analysis
North America controlled 35.41% of global revenues in 2025, buoyed by the highest employer penetration of fertility benefits and a mature supplement culture that accepts premium pricing for clinically backed formulations. The United States’ pre-conception knowledge advantage partially offsets patchy supplement adherence, creating room for professional-only lines that double as prescription adjuncts. Regulatory rigor is also intensifying: the FDA’s 75-day new-ingredient rule is weeding out under-substantiated SKUs but simultaneously consolidating consumer confidence. This confluence of favorable coverage, medical endorsement and consumer trust solidifies North America’s role as the anchor market for fertility supplements.
Asia-Pacific is the fastest-growing theatre, anticipated to log a 7.48% CAGR. Rising infertility—exacerbated by urban lifestyles, postponement of parenting and mounting PCOS incidence—has magnified demand in China, India and the Philippines. The fertility supplements market size for Asia-Pacific is projected to eclipse USD 1.49 billion by 2031, capturing more than one-third of incremental global dollars. Multinationals are responding through local acquisitions—Barentz’s purchase of China’s Fengli Group and Nestlé’s expanded women’s-health platform—while domestic entrants leverage herbal heritages to differentiate in an ingredient-conscious consumer base.
Europe, grounded in stringent health-claim regulation under EFSA, registers steady mid-single-digit growth as brands lead with documented benefits and transparent labelling. South America and the Middle East & Africa are still nascent, yet incremental rises in disposable income and e-commerce penetration are nurturing early adoption. Currency fluctuations and fragmented distribution keep short-term growth tempered, but escalating ART uptake and government-sponsored maternal-health programs point to medium-term potential. Consequently, the fertility supplements market maintains a genuinely global profile, albeit shaped by region-specific regulatory and cultural determinants.


Regulatory Landscape
Regulation for fertility supplements continues to hinge on whether products are positioned as nutritional support or as infertility therapies. In the United States, the Dietary Supplement Health and Education Act (DSHEA) framework places primary responsibility for safety and labeling on manufacturers, while disease-treatment claims can move a fertility-positioned product into drug status and trigger pre-market approval requirements. This claim boundary has become more consequential as brands lean on evidence-led ingredient narratives (such as CoQ10 and methylfolate) to justify premium SKUs.
In Europe, Directive 2002/46/EC governs food supplements and links formulation and labeling to authorized vitamin and mineral sources and levels, with EFSA supporting scientific evaluation and risk assessment that can constrain aggressive claim language. Canada maintains a distinct compliance pathway for certain categories of “supplements” under the Canadian Food Inspection Agency (CFIA) and related pre-market assessment or registration requirements where applicable, reinforcing the need for region-specific dossiers and labeling strategies across global portfolios.
Competitive Landscape
The market remains fragmented; no single supplier controls more than a mid-single-digit percentage of global revenue. Nutraceutical specialists such as Vitabiotics, Fairhaven Health and Theralogix depend on randomized controlled trial portfolios to defend price premiums. Generalist supplement houses GNC and Nature’s Bounty ride brand familiarity and broad retail presence but must update formulations to match evidence-led competitors. Pharmaceutical crossover interest is intensifying: Sanofi’s USD 1 billion purchase of Qunol injects big-pharma resources into the previously niche coenzyme Q10 segment, signalling broader convergence between therapeutics and nutrition.
Strategic playbooks cluster around three levers. First, clinical differentiation: controlled trials not only unlock physician recommendation but insulate margins against commoditization. Second, technology: sustained-release beads, liposomal carriers and taste-masked gummies are opening new demographics and dosing regimens. Third, omnichannel distribution: companies integrate direct-to-consumer subscription portals with in-clinic sampling to capture both digitally native and clinician-guided buyers. Heightened regulatory scrutiny selectively advantages incumbents with dedicated compliance functions, as smaller entrants face cost-prohibitive dossier requirements.
Partnership activity is also brisk. Brands collaborate with fertility clinics to co-develop protocol-specific packs that synchronize with ART cycles, thus embedding supplements into patient pathways. Ingredient vendors partner with finished-product formulators to generate proprietary blends offering mutual exclusivity. Investors have flagged male-fertility products, genetic-testing-led personalization and data-backed subscription models as greenfield categories. Competitive intensity will remain high, yet the growing clinical validation trend underpins rising barriers to entry, helping the fertility supplements market mature without eroding profitability.
Fertility Supplement Industry Leaders
Fairhaven Health
Coast Science
LENUS Pharma GesmbH
Exeltis USA, Inc.
Vitabiotics Ltd.
- *Disclaimer: Major Players sorted in no particular order


Market Opportunities and Future Outlook
Clinic workflows are incorporating more data-driven fertility decision support, which creates room for fertility supplement brands to integrate into protocol-led pathways instead of relying on retail-only positioning. In May 2026, Alife Health received FDA clearance for an AI-powered embryo assessment tool, and in April 2026 FertilAI announced CE marking under EU MDR for fertility cycle optimization decision support. As clinics adopt more standardized, software-guided cycle planning, supplements with dosing logic and documented ingredient rationales (including CoQ10, methylfolate, and L-carnitine) can be packaged into time-bound regimens aligned to clinic milestones, supporting adherence and clearer differentiation versus generic prenatal offerings.
Male-factor optimization is also gaining technical proof points, widening addressable “pre-ART” and “during-ART” use cases that often include antioxidant and micronutrient stacks. In April 2026, BAIBYS reported a clinical pregnancy using an autonomous micro-robotic sperm selection system for ICSI, reinforcing the direction toward measurable lab-side quality improvements that couples may pair with sperm-quality nutrition protocols. At the same time, adjacent-market expansion beyond fertility-only positioning is showing up in established supplement brands, with Fairhaven Health broadening its women’s health commitment beyond fertility in July 2025, which suggests an additional route for fertility supplement players to extend into cycle health, postnatal support, and menopause while keeping practitioner credibility.
Recent Industry Developments
- March 2026: LENUS Pharma GesmbH participated in EAU 2026 in London, highlighting reproductive health and practitioner engagement around fertility-related nutraceuticals. The presence at a major urology forum supports medical-community visibility for male fertility positioning, where product choice often depends on clinician familiarity and evidence narratives.
- October 2025: Fairhaven Health highlighted clinical study outcomes for its Complete Menopause Relief product, citing rapid symptom improvement results. The communication underscores a strategic push beyond fertility-only SKUs into broader women’s health, expanding cross-selling opportunities and smoothing demand seasonality tied to conception planning.
- April 2025: LENUS Pharma GesmbH initiated the launch of PROFERTIL female in Spain through a collaboration with Rubió. The market-entry partnership reflects a localization approach for fertility supplements in regulated, pharmacy-influenced channels, improving distribution reach and in-country stakeholder access.


Research Methodology Framework and Report Scope
Market Definition and Coverage
This market covers finished dietary supplements used to support fertility and preconception reproductive health in women and men, including vitamins, minerals, amino acids, antioxidants, and herbal blends. Coverage includes products sold through retail and online channels that are positioned specifically for conception support.
Scope exclusions: Prescription infertility drugs, IVF lab consumables (such as culture media), and standard prenatal multivitamins used after pregnancy is confirmed are excluded.
Segmentation Overview
- By Ingredient
- Natural Ingredients
- Herbal Extracts (Maca, Ashwagandha, Tribulus)
- Vitamins & Minerals (Folic Acid, Zinc, Selenium)
- Antioxidants (CoQ10, Omega-3, Lycopene)
- Synthetic Ingredients
- Blend of Natural & Synthetic
- Natural Ingredients
- By Form
- Capsules
- Tablets
- Softgels
- Gummies
- Powders
- Other Forms (Liquids, Sprays)
- By Consumer
- Female-Specific Supplements
- Male-Specific Supplements
- By Distribution Channel
- Retail Pharmacy
- E-pharmacy
- Other Distribution Channels
- Geography
- North America
- United States
- Canada
- Mexico
- Europe
- Germany
- United Kingdom
- France
- Italy
- Spain
- Rest of Europe
- Asia-Pacific
- China
- Japan
- India
- Australia
- South Korea
- Rest of Asia-Pacific
- Middle East & Africa
- GCC
- South Africa
- Rest of Middle East & Africa
- South America
- Brazil
- Argentina
- Rest of South America
- North America
Data Sources, Market Sizing, and Validation
Desk Research
Desk work was used to set the market frame and to collect demand and supply signals that can be checked country by country. We relied on public sources such as the US FDA dietary supplement guidance and warning letters, CDC fertility and birth-related indicators, WHO reproductive health publications, and OECD health statistics to understand how the consumer health context is moving.
To build realistic conversion and price assumptions, we also reviewed company annual reports and investor presentations, retailer and pharmacy category pages for pack sizes and price bands, and reputable press coverage on new launches and claims scrutiny. Where needed, paid subscriptions for company financials and news, patent databases, and an import and export shipment-level database were used to validate ingredient trends and cross-check manufacturing footprints. These sources are illustrative, and other public and paid references were also used to collect data, validate assumptions, and clarify open questions.
Primary Interviews and Surveys
Primary work focused on validating what is actually counted as a fertility supplement purchase, how products are positioned (female, male, or couple-focused), and how pricing changes by format and channel. We spoke with a mix of brand and contract manufacturing participants, distributors and pharmacy channel stakeholders, and healthcare and nutrition professionals across APAC, EMEA, and the Americas to close remaining data gaps and pressure-test key assumptions before finalizing the model.
Distribution of primary research fieldwork respondents
| Company type | Respondent position | Region |
|---|---|---|
| Top tier: 36% | CXOs: 17% | APAC: 51% |
| Mid tier: 42% | Functional/Unit leaders: 29% | EMEA: 29% |
| Smaller Players: 22% | Managers: 54% | Americas: 20% |
Market-Sizing & Forecasting
Sizing started with a top-down reconstruction where the addressable preconception demand pool was mapped using fertility intent indicators, age-band population, and treatment-seeking behavior. That pool was then converted into supplement buying rates by channel.
To keep totals grounded, we corroborated the results with selective bottom-up checks based on sampled brand revenue disclosures, typical SKU-level price bands, and volume checks from channel conversations.
The model uses a small set of repeatable inputs, including the share of women and men buying preconception supplements, average consumption duration around conception planning, mix shifts between gummies, capsules, and powders, online versus pharmacy channel share, and observed price-per-day ranges by formulation strength. When a country had limited disclosure, proxy assumptions were applied from a comparable market and then adjusted through expert feedback on affordability and channel maturity.
For forecasting, scenario analysis was used so the forward curve reflects how fast awareness, e-commerce penetration, and clinically backed ingredient adoption can move, without assuming a single straight-line outcome. A short set of scenarios was reviewed with interviewees, and the final forecast follows the scenario that best matches the majority view on demand expansion and pricing progression.
Data Validation & Update Cycle
Outputs were checked against independent signals, including category growth narratives from retailers, changes in regulatory and claim enforcement, and the direction of new product launches and ingredient innovation. If a country result looked unusually high or low versus its demographic profile and channel mix, it was flagged for deeper review and re-checked through follow-up calls and secondary look-backs.
Before sign-off, the model and assumptions go through a multi-step analyst review so arithmetic, unit conversions, and currency timing are consistent across regions. Reports are refreshed annually, and interim updates are made when material events occur, such as major regulatory actions or sharp pricing shifts. Right before delivery, a final pass is completed so clients receive the most current view available at that time.
Mordor Intelligence's Fertility Supplement Market Size Compared Against Other Published Estimates
Different published numbers for fertility supplements are common because the product definition can drift into adjacent wellness categories, and because pricing and usage assumptions are handled in different ways. We keep the build simple to follow, but strict on what gets counted, and then we verify the result using real-world channel and expert checks.
Prenatal multivitamins used after pregnancy is confirmed sit outside Mordor Intelligence's scope, which is one reason our 2025 value is lower than estimates that group prenatal vitamins, women's daily vitamins, and fertility blends together. Another driver is how annual spend is estimated, since some publishers assume a longer usage period per buyer, or apply a single global average selling price without reflecting format mix (gummies versus capsules), online discounting, and local currency conversion timing.
Benchmark comparison
| Source | Market Size | Gaps in Research Methodology |
|---|---|---|
| Mordor Intelligence | USD 2.70 B (2025) | |
| Trade Journal A | USD 2.23 B (2024) | Uses an earlier base year and appears to emphasize consumer supplement sales only, with limited transparency on how practitioner-recommended products and cross-border e-commerce are treated. |
| Regional Consultancy B | USD 4.09 B (2032) | Long-horizon forecast with higher CAGR assumptions, and the scope is often broadened in practice by bundling adjacent prenatal and broader women's health supplement demand into the same spending pool. |
Looking across the figures, the spread is mainly explained by what is included as a fertility product and how yearly spend is converted from price and usage. Our estimate stays traceable to a defined preconception buyer pool, realistic purchase duration, and channel-specific pricing, which makes the outcome easier to reconcile across countries and over time.


Key Questions Answered in the Report
How big is the fertility supplements market today?
The fertility supplements market is valued at USD 2.88 billion in 2026 and is projected to reach USD 3.94 billion by 2031 at a 6.49% CAGR.
Who are the key players in Fertility Supplement Market?
Natural-ingredient formulations lead, capturing 54.22% revenue share in 2025, with blended natural-synthetic products growing fastest.
Why is Asia-Pacific the fastest-growing region?
Rising infertility rates, expanding middle-class purchasing power and rapid e-commerce adoption are driving a 7.48% CAGR in Asia-Pacific.
Do male-specific fertility supplements have clinical backing?
Yes. A three-month 3,000 mg L-carnitine regimen improved sperm motility from 15% to 50% and count from 25 million/mL to 49 million/mL in asthenozoospermic patients.
What regulatory changes are shaping product development?
The FDA’s 75-day new dietary ingredient notification and California’s proposed heavy-metal testing mandate are increasing compliance costs but bolstering consumer trust.
Which sales channel is growing fastest for fertility supplements?
E-pharmacy is advancing at a 9.08% CAGR, outperforming traditional retail pharmacies by leveraging convenience, privacy and subscription models.
Page last updated on:


 Your data is secure and never sold or shared.


