
Fertigation and Chemigation Market Size and Share
Market Overview
| Study Period | 2021 - 2031 |
|---|---|
| Market Size (2026) | USD 52.68 Billion |
| Market Size (2031) | USD 66.33 Billion |
| Growth Rate (2026 - 2031) | 4.72 % |
| Fastest Growing Market | Africa |
| Largest Market | Europe |
| Market Concentration | Medium |
Major Players *Disclaimer: Major Players sorted in no particular order Image © Mordor Intelligence. Reuse requires attribution under CC BY 4.0. | |
Fertigation and Chemigation Market Analysis by Mordor Intelligence
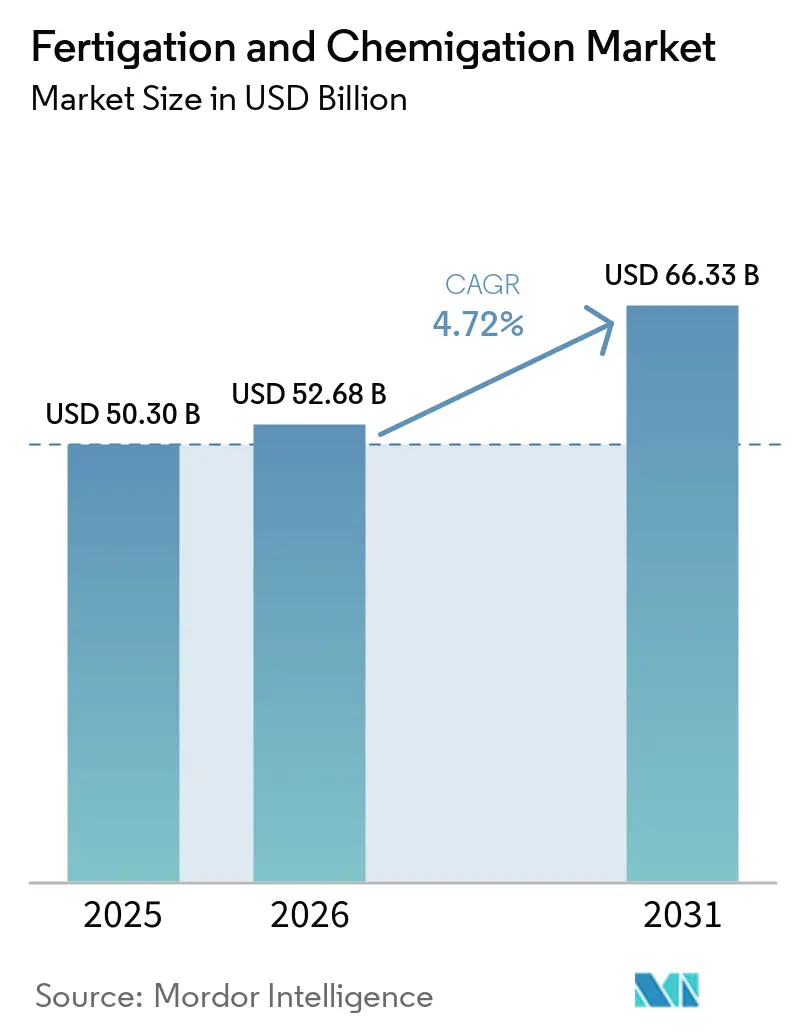
The fertigation and chemigation market size is expected to grow from USD 50.3 billion in 2025 to USD 52.68 billion in 2026 and is forecast to reach USD 66.33 billion by 2031 at 4.72% CAGR over 2026-2031. This growth is driven by increasing water scarcity concerns, rising fertilizer costs emphasizing efficiency needs, and the integration of the Internet of Things (IoT) and Artificial Intelligence (AI) technologies in nutrient delivery systems. These factors are transforming farm management practices, reducing operational waste, and improving adaptability to climate change. Companies are investing in research and development of water-soluble formulations, cloud-based control systems, and sensor technologies that monitor moisture, salinity, and nutrient levels in real-time. Governments across developed and developing nations are expanding micro-irrigation subsidies, facilitating equipment upgrades, and supporting domestic innovation. Input manufacturers are integrating software solutions, agronomic services, and maintenance support to enhance customer retention and value.
Key Report Takeaways
- By input type, fertilizers accounted for 45.42% of the fertigation and chemigation market share in 2025, while biostimulants and micronutrients are projected to grow at a CAGR of 9.68% through 2031.
- By crop type, fruits and vegetables represented 37.35% of the fertigation and chemigation market in 2025, with plantation crops projected to achieve the highest CAGR of 7.62% through 2031.
- By application environment, open-field agriculture maintained a 56.20% share of the fertigation and chemigation market size in 2025, while urban vertical farming is growing at a CAGR of 10.15% during 2026-2031.
- By irrigation type, drip systems dominated with a 60.25% share of the fertigation and chemigation market size in 2025, with subsurface and other systems growing at a CAGR of 11.78% during the same period.
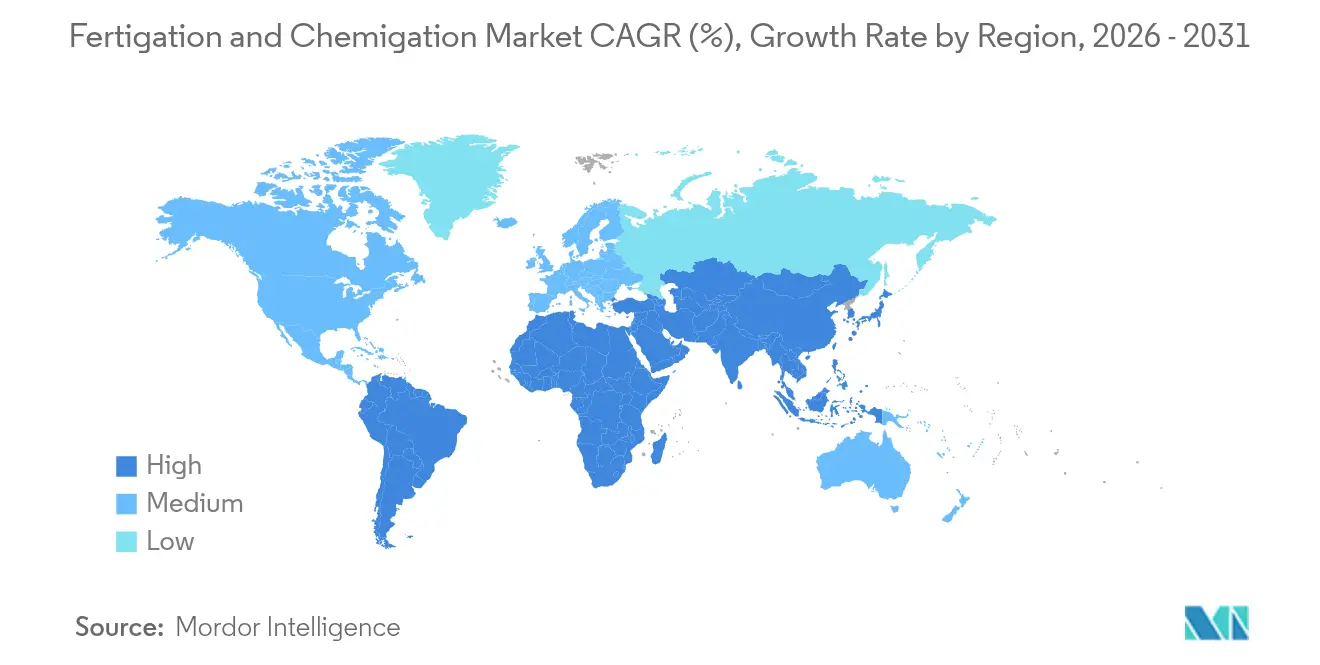
- By geography, Europe captured 33.62% of revenue share in 2025, while Africa is anticipated to grow at the highest CAGR of 8.92% through 2031.
Note: Market size and forecast figures in this report are generated using Mordor Intelligence’s proprietary estimation framework, updated with the latest available data and insights as of 2026.
Market Trends and Insights
Drivers Impact Analysis of Fertigation and Chemigation Market*
| Driver | (~) % Impact on CAGR Forecast | Geographic Relevance | Impact Timeline |
|---|---|---|---|
| Rising Demand for Food Security and Yield Maximization | +1.50% | Global, with highest impact in Asia-Pacific and Africa | Long term (≥ 4 years) |
| Government Subsidies and Micro-Irrigation Incentives | +1.20% | Asia-Pacific, North America, Europe | Medium term (2-4 years) |
| Growing Water Scarcity Heightens Efficient Nutrient Delivery | +1.30% | Middle East, Africa, Asia-Pacific, Western North America | Long term (≥ 4 years) |
| Rapid Adoption of Water-Soluble Specialty Fertilizers | +0.80% | North America, Europe, Asia-Pacific | Medium term (2-4 years) |
| IoT-enabled variable-rate fertigation systems | +0.6% | North America, Europe, Advanced Asia-Pacific markets | Medium term (2-4 years) |
| Labor and Cost Efficiency | +0.4% | Global, with highest impact in labor-constrained developed markets | Short term (≤ 2 years) |
| Source: Mordor Intelligence | |||
Rising Demand for Food Security and Yield Maximization
The global demand for calories is increasing faster than the availability of arable land, requiring farmers to maximize output per unit of water, nutrients, and labor. Fertigation, which delivers nutrients directly to plant root zones, increases crop yields by 15-35% in high-value crops by synchronizing nitrogen, phosphorus, and potassium delivery with plant developmental stages. Commercial orchards and vegetable farms report up to 30% improvement in fertilizer use efficiency, reducing costs during periods of volatile input prices while decreasing nutrient run-off. Fertigation, when integrated with climate-smart farming practices, enables farms to implement data-driven, continuous nutrition programs instead of periodic bulk fertilizer applications.
Government Subsidies and Micro-Irrigation Incentives
Government policies support the adoption of agricultural technology through grants, tax credits, and subsidized loans. The United States Department of Agriculture's 2025 budget allocates USD 10.5 billion to the Natural Resources Conservation Service, with a focus on precision water management systems.[1]Natural Resources Conservation Service, “Budget Summary FY 2025,” United States Department of Agriculture, usda.govSimilar programs in India and China provide reimbursements of up to 55% for low-pressure drip irrigation equipment, encouraging adoption among small and medium-scale farmers. These initiatives have fostered the development of supporting services, including agronomic consulting, sensor production, and software-based irrigation management.
Rapid Adoption of Water-Soluble Specialty Fertilizers
Water-soluble NPK, Ca-Mg blends, and trace-mixes are becoming more prevalent as they prevent emitter clogging and allow multi-nutrient feeding in one application. Research studies demonstrate that water-soluble fertilizers achieve 30% higher nutrient-use efficiency compared to granular applications, supporting compliance with the "5 Rs" framework (right source, rate, time, place, irrigation).[2]Office of Water, “Nutrient Reduction Strategies,” United States Environmental Protection Agency, epa.govManufacturers now offer products specifically formulated for pH-sensitive crops and high-frequency fertigation, increasing adoption in premium fruit and greenhouse production across Europe and North America.
Growing Water Scarcity Heightens Efficient Nutrient Delivery
Agriculture accounts for 70% of global freshwater withdrawals, and this percentage is projected to increase with population growth and changing dietary patterns. Drip-integrated fertigation reduces water consumption by 20-60% compared to flood irrigation methods while reducing nitrate leaching into aquifers. Farmers in arid regions of the Middle East and North Africa who implement fertigation systems experience reduced soil salinity and more consistent crop yields during hot seasons. This irrigation method addresses both water conservation and nutrient efficiency requirements, which are increasingly subject to regulatory oversight.
Restraints Impact Analysis of Fertigation and Chemigation Market*
| Restraint | (~)% Impact on CAGR Forecast | Geographic Relevance | Impact Timeline |
|---|---|---|---|
| High Capital and Operational and Maintenance Costs | -0.90% | Global, with highest impact in developing regions | Medium term (2-4 years) |
| Less Technical Knowledge Among Farmers | -0.80% | Asia-Pacific, Africa, South America | Medium term (2-4 years) |
| Emitter Clogging from Precipitates and Biofilms | -0.50% | Global | Short term (≤ 2 years) |
| Increasing Regulatory Scrutiny on Nutrient Leaching | -0.30% | North America, Europe | Long term (≥ 4 years) |
| Source: Mordor Intelligence | |||
High Capital and Operational and Maintenance Costs
Drip fertigation systems with advanced features require significant infrastructure, including pressure-regulated mainlines, dual filtration, backflow prevention, and programmable controllers. These requirements increase initial costs beyond what many smallholder farmers can afford. Economic analyses indicate that variable-rate fertigation systems have payback periods of over 27 years for commodity crops, while fixed-rate pivot systems achieve payback in 10 years. The financial barriers are particularly challenging in low-income regions with small farm sizes and limited credit access. The ongoing maintenance costs, including system flushing, acid treatment, and sensor calibration, create additional financial pressure, which reduces system upgrades and new purchases.[3]U.S. Government Accountability Office, “Precision Agriculture: Benefits and Barriers,” gao.gov
Less Technical Knowledge Among Farmers
Effective precision nutrient delivery requires an understanding of crop physiology, fertigation chemistry, and the use of monitoring software. Field surveys conducted in South Africa in 2021 identified knowledge gaps as the primary factor affecting adoption rates, with 24% in resource-limited districts compared to 68% in well-resourced areas. In Karnataka, India, insufficient local advisory services limit the return on investment. Inadequate technical support can lead to calibration errors, resulting in emitter blockages or nutrient imbalances that erode farmer confidence in the technology.
*Our forecasts treat driver/restraint impacts as directional, not additive. The impact forecasts reflect baseline growth, mix effects, and variable interactions.
Fertigation and Chemigation Market Segment Analysis
By Input Type:
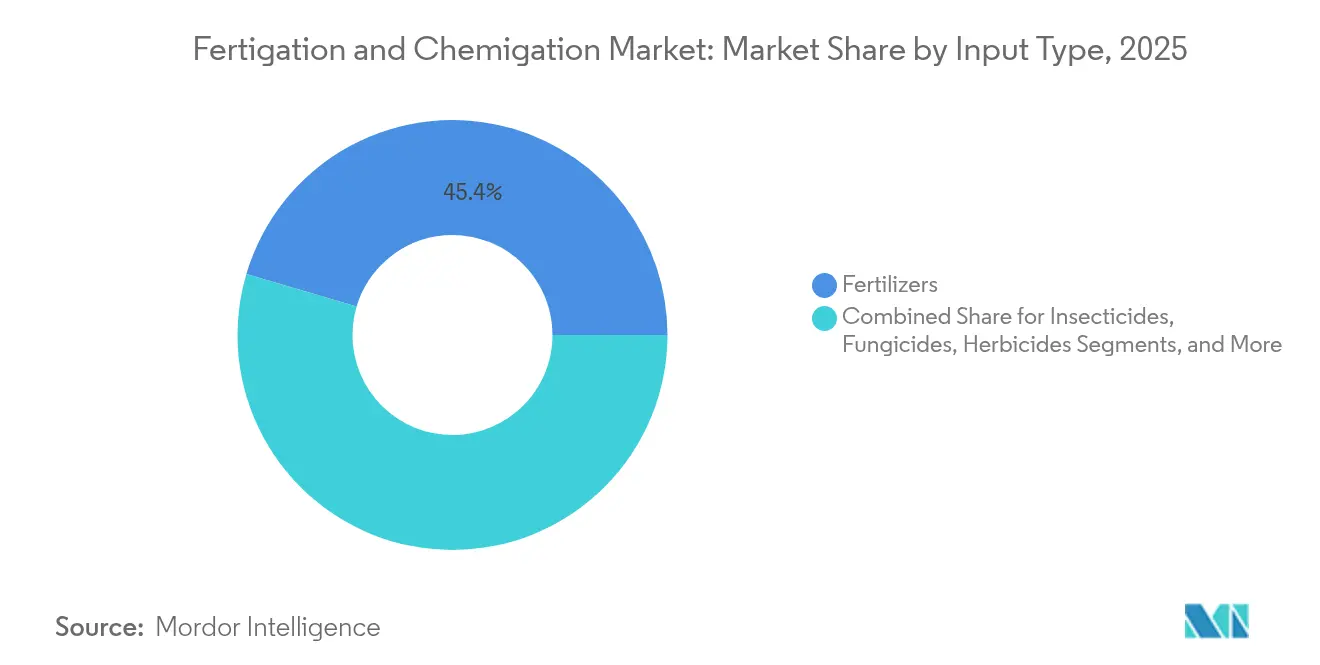
Biostimulants and Micronutrients Extend Efficiency FrontiersThe fertigation and chemigation market is dominated by fertilizers, which accounted for 45.42% of revenue share in 2025. This dominance is primarily due to water-soluble NPK formulations that offer rapid dissolution and minimal line precipitation. Major manufacturers are developing chelated micronutrient blends to address nutrient deficiencies in intensive horticultural operations.
Biostimulants and micronutrients are emerging as significant growth drivers, with projections indicating a 9.68% CAGR from 2026-2031. This growth is driven by farmers seeking consistent yields during unpredictable weather conditions. Research indicates that plant-based extracts and microbial consortia improve nutrient-use efficiency by 30% compared to conventional fertilizer applications, leading major lettuce and berry producers to implement these solutions across their operations. New liquid inoculants designed for low-pressure drip systems enhance soil-microbe interactions without emitter blockage.
Insecticides and fungicides maintain moderate growth rates, as fertigation systems enable uniform distribution throughout dense crop canopies, reducing overall chemical usage while maintaining effective pest control levels. The herbicide segment, though smaller due to application limitations, shows gradual growth in managing glyphosate-resistant weed populations.


By Crop Type:
Plantation Crops Gain TractionFruits and vegetables maintain the largest market share at 37.35% in 2025, driven by their high nutrient timing requirements that fertigation effectively addresses. Drip line fertigation systems demonstrate yield increases of 15-35% in vine crops, strawberries, and leafy greens, particularly in peri-urban areas where high land costs necessitate increased productivity. Cereal and grain producers are transitioning from pilot programs to commercial implementation, with maize and wheat farmers adopting low-pressure systems within crop rotation schedules. The technology also shows increasing adoption in oil crops and pulses, especially in water-scarce regions where split nitrogen applications reduce nutrient loss through volatilization.
Plantation crops, including tea, coffee, cocoa, coconut, and rubber, exhibit unique fertigation adoption patterns. While currently holding a smaller market share, the fertigation and chemigation market for plantation crops is projected to grow at an 7.62% CAGR from 2026-2031. These crops benefit significantly from low-volume, high-frequency nutrient delivery due to their long production cycles and perennial root systems, particularly during extended dry periods. Growers report improved leaf development and bean quality uniformity after implementing drip fertigation, which reduces nutrient leaching in high-rainfall areas. The extended lifespan of plantation crops supports the initial capital investment, as the revenue benefits accumulate over multiple years, improving the overall return on investment.
By Application:
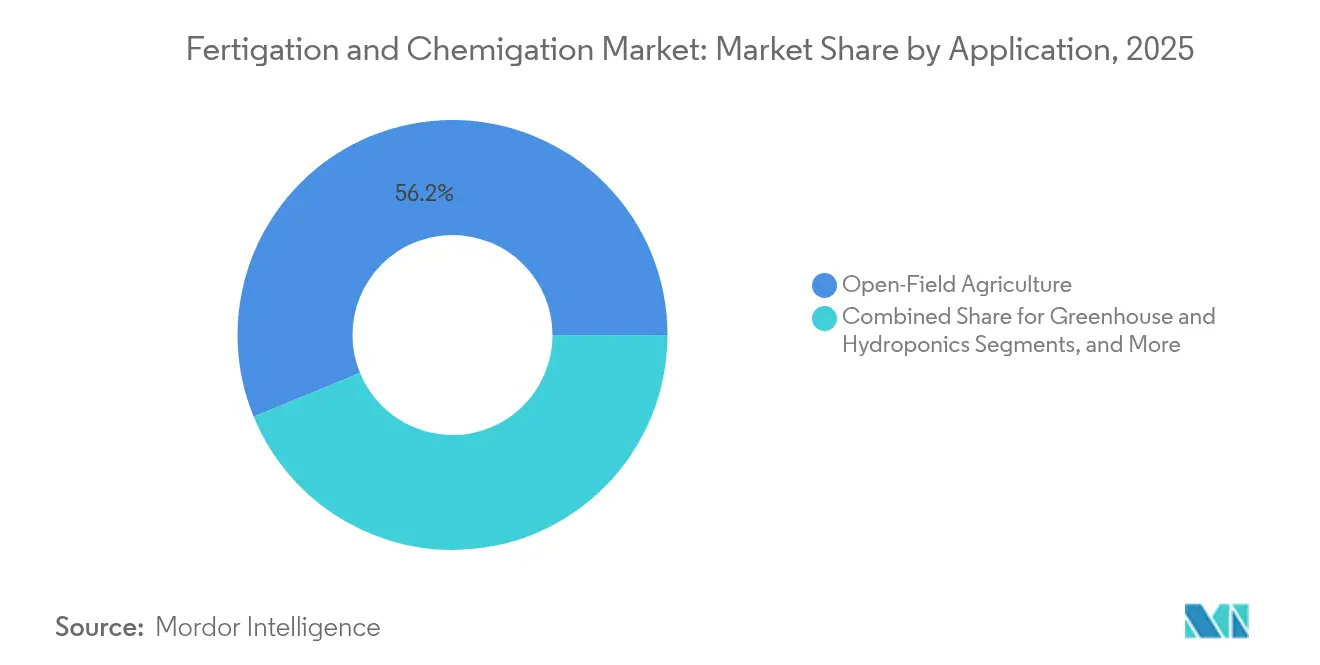
Urban Agriculture AcceleratesOpen-field agriculture accounts for 56.20% of 2025 revenues, driven by the implementation of drip irrigation systems in cotton, sugarcane, and maize cultivation. The integration of precision mapping enables zone-specific fertigation rates that balance yield variations with environmental regulations. The greenhouse and hydroponics segments continue to grow as climate uncertainties underscore the benefits of controlled environment agriculture. The nursery and landscaping segment expands as municipalities implement water-efficient green spaces.
Urban vertical farming is projected to demonstrate the highest growth rate of 10.15% through 2031 in the fertigation and chemigation market, driven by cities' initiatives to localize leafy-green production. The deployment of AI-based scheduling systems optimizes nitrate-to-ammonium ratios based on transpiration requirements, improving operational efficiency. Government incentives, including rooftop farming grants and favorable financing for light-emitting diode grow facilities, support this growth trajectory.
By Irrigation Type:
Drip Technology Maintains CommandDrip irrigation holds a 60.25% market share in 2025, driven by its precision application, minimal evaporation losses, and integration with variable-rate technology. Advanced emitter designs incorporate anti-siphon mechanisms and pressure-compensating labyrinths, ensuring consistent water distribution across uneven terrain. The market for retrofit drip irrigation kits in permanent orchards is expanding as tree-crop producers seek to maintain consistent nutrient delivery during critical fruit development periods. Sprinkler systems rank second, with pivot and linear systems now featuring individual nozzle flow control for precise fertilizer application with minimal drift.
Subsurface and other irrigation systems demonstrate the highest growth rate at 11.78% CAGR. Subsurface drip irrigation (SDI) systems place water and nutrients 25-40 cm underground, reducing surface evaporation and limiting weed growth. Studies indicate SDI increases water productivity by 15% compared to surface irrigation while enhancing nitrate uptake. Pulse irrigation systems are gaining adoption in water-limited smallholder regions, combining cost-effectiveness with efficient water delivery through gravity-fed designs.
Geography Analysis
Europe accounted for 33.62% of the fertigation and chemigation market share in 2025. Growers of olives, vineyards, and greenhouse vegetables have implemented sensor-based fertigation systems to meet EU nitrate directive requirements while improving yield consistency and product quality. The Common Agricultural Policy provides government grants and low-interest loans that support the adoption of advanced systems incorporating soil-moisture sensors, automated filtration, and digital monitoring platforms, shortening payback periods despite increasing labor costs. The extensive greenhouse facilities in the Netherlands, Spain, and Italy drive technology adoption, as controlled environments maximize the effectiveness of precise nutrient application and pH management. Market growth is supported by an established service network, where agricultural input suppliers collaborate with technology companies to deliver complete solution packages, from design through maintenance, targeting medium-sized farming cooperatives that require regulatory compliance without expanding their technical staff.
North America is a significant regional market, supported by widespread adoption of digital technologies, established technical support networks, and increasing demand for efficient fertilizer application. Demand is being strengthened by Midwestern farmers responding to fertilizer price fluctuations, while 78.6% of corn and soybean farmers prioritize fertilizer efficiency, supporting greater adoption of variable-rate pivot fertigation. Federal conservation funding and stringent runoff regulations further strengthen the case for fertigation and chemigation adoption across the region.
Africa is forecast to record the fastest growth, with a CAGR of 8.92% from 2026 to 2031. In 2024, the Africa Fertilizer and Soil Health Summit, in conjunction with regional smart-irrigation initiatives, highlighted the water conservation and nutritional benefits of fertigation. Implementation levels vary significantly, with 24% of farms in South Africa's Vhembe district adopting climate-smart irrigation, compared to 68% in the Capricorn district in 2021. Short Message Service (SMS)-based and low-bandwidth digital extension services are being used to bridge knowledge gaps. Additionally, precision-fertilization programs in Kenya and Tanzania highlight regional interest in mobile applications for nutrient management guidance.

Regulatory Landscape
Chemigation requirements are anchored in pesticide labeling and water-protection safeguards. In the United States, EPA oversight under FIFRA governs whether pesticides can be applied through irrigation, and product labels must explicitly authorize (or prohibit) chemigation use, shaping which inputs can be delivered through fertigation and chemigation systems and how operators document compliant application practices.
At the state and regional level, rules commonly require engineered protections such as backflow prevention, interlocks, and other anti-pollution devices to prevent contamination of wells and surface water. This is reflected in updated chemigation protocols, including Idaho updates in 2024, and codified requirements in states such as Colorado. In Washington, WSDA initiated modernization of WAC 16-202 during 2024 and then advanced changes that streamline chemigation and fertigation oversight, reinforcing a shift toward clearer statewide compliance frameworks for equipment configuration and operational control. In Europe, Regulation (EU) 2020/741 (effective since June 2023) sets minimum quality and monitoring requirements for reclaimed water used in agricultural irrigation, linking water reuse permits to risk management plans and crop or irrigation method categories and increasing the compliance value of monitoring and traceable nutrient delivery practices.
Competitive Landscape
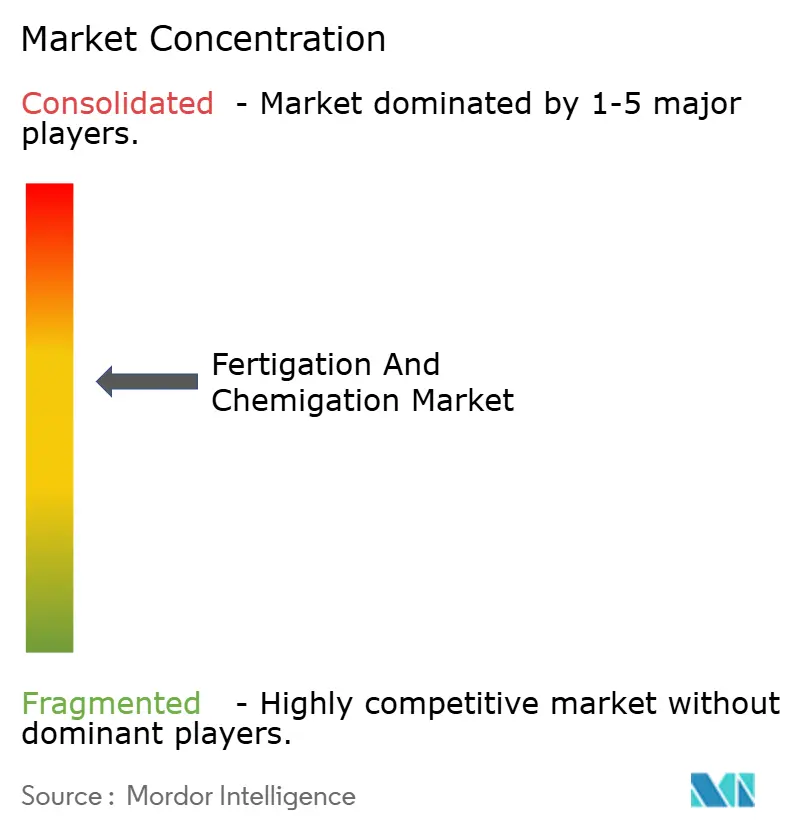
The fertigation and chemigation market maintains a moderate concentration, with five major companies controlling 63% of 2024 revenues. Netafim Limited (An Orbia Business) holds the largest share at 18.2%, followed by Jain Irrigation Systems Limited (Rivulis), Lindsay Corporation, Valmont Industries, Inc., and The Toro Company. These companies are strengthening their market positions through expanded software capabilities and service contracts. The competitive focus has shifted toward developing open-architecture control systems that integrate with third-party sensors, weather data, and farm management platforms.
Significant market potential exists in emerging regions where economic viability depends on cost-efficient equipment and financing options. The vertical farming segment attracts venture capital investment, particularly for start-ups developing lightweight, sensor-equipped modules. Established manufacturers respond through strategic acquisitions of dosing-pump manufacturers and AI company partnerships to enhance their predictive analytics capabilities. Companies are expanding their service offerings to include design, installation, maintenance, and remote monitoring, creating stronger customer relationships through increased switching costs.
Smaller suppliers target specialized markets, such as subsurface drip systems for shallow-root cotton or salt-tolerant vegetable varieties. Specialty fertigation input suppliers are integrating consumable products with equipment leasing options, facilitating vertical integration of supply chains and margin stability.
Fertigation and Chemigation Industry Leaders
Netafim Limited (An Orbia Business)
Jain Irrigation Systems Limited (Rivulis)
Lindsay Corporation
Valmont Industries, Inc.
The Toro Company
- *Disclaimer: Major Players sorted in no particular order
Fertigation and Chemigation Market Companies Covered in this Report
- Netafim Limited (An Orbia Business)
- Jain Irrigation Systems Limited (Rivulis Irrigation Ltd.)
- Lindsay Corporation
- Valmont Industries, Inc.
- The Toro Company
- Rain Bird Corporation
- Automat Industries Private Limited
- Mahindra EPC Irrigation Limited
- Hunter Industries Inc.
- Irritec S.p.A

Market Opportunities and Future Outlook
Remote monitoring and automation are becoming more commercially actionable where regulators explicitly recognize qualified monitoring approaches. Washington State adopted amendments to WAC 16-202 on October 31, 2025 (effective December 1, 2025) to allow remote monitoring for chemigation and fertigation for qualified systems, reducing reliance on mandatory on-site visual checks and increasing demand for connected controllers, verification features, and audit-ready data logs across installed bases.
There is visible whitespace in flow-proportional variable-rate fertigation (VRF) hardware, software, and performance verification, as adoption moves from uniform dosing toward prescription-driven injection that matches irrigation flow and location-specific crop needs. Manufacturer roadmaps support this direction through productized VRF and remote monitoring capabilities, including Agri-Injects April 2026 updates to ReflexCONNECT and ReflexCONNECT uVRF for flow-proportional VRF and remote monitoring. Published methods for mapping nitrogen in flow-proportional VRF systems (Precision Agriculture, May 2026) also help standardize measurement and reporting of injected nutrient mass balance, which ties to tighter nutrient-leaching scrutiny in North America and Europe and strengthens the case for integrated sensing, mixing uniformity, and control-layer upgrades beyond basic irrigation delivery.
Recent Industry Developments in Fertigation and Chemigation Market
- July 2026: Jain Irrigation Systems Limited signed a Memorandum of Understanding with Indian Potash Limited to provide drip irrigation systems for sugarcane cultivation in Gujarat. The arrangement highlights bundling of irrigation hardware with input and agronomic ecosystems, supporting scaled deployment of fertigation-ready drip infrastructure in a major sugarcane geography.
- May 2026: A study published in PLOS One reported yield impacts from combining nano-NPK fertilization with salicylic acid chemigation in tomato production. The findings reinforce ongoing product development and grower interest in specialized, water-soluble and novel formulations that can be applied through irrigation systems while maintaining performance outcomes.
- October 2024: Rivulis launched the D4000 drip system designed to extend drip and fertigation use into sloped and rocky terrain. By opening up difficult-to-irrigate acreage to precision drip layouts, the product expands the addressable base for fertigation consumables and control components in topographically constrained regions.


Fertigation and Chemigation Market Report Scope and Research Methodology
Market Definition and Coverage
This market covers the revenues generated from systems and inputs used to apply water soluble fertilizers and crop protection chemicals through pressurized irrigation in farms and controlled growing setups. It includes the delivery process through irrigation infrastructure where nutrients or chemicals are injected and distributed with irrigation water.
Scope exclusions: It excludes stand-alone nutrient mixing equipment not tied to irrigation delivery, foliar spray equipment, and purely agronomic consulting services.
Segments Covered in This Report
- By Input Type
- Fertilizers
- Insecticides
- Fungicides
- Herbicides
- Biostimulants and Micronutrients
- Other Input Types
- By Crop Type
- Cereals and Grains
- Oilseeds and Pulses
- Fruits and Vegetables
- Plantation Crops
- Turf and Ornamentals
- Other Crop Types
- By Application
- Open-Field Agriculture
- Greenhouse and Hydroponics
- Nursery and Landscaping
- Urban Vertical Farming
- Other Applications
- By Irrigation Type
- Drip Irrigation
- Sprinkler Irrigation
- Other Irrigation Types
- By Geography
- North America
- United States
- Canada
- Mexico
- Rest of North America
- Europe
- Germany
- United Kingdom
- France
- Italy
- Spain
- Russia
- Rest of Europe
- Asia-Pacific
- China
- India
- Japan
- Australia
- South Korea
- Rest of Asia-Pacific
- South America
- Brazil
- Argentina
- Rest of South America
- Middle East
- Turkey
- Saudi Arabia
- United Arab Emirates
- Rest of Middle East
- Africa
- South Africa
- Egypt
- Kenya
- Rest of Africa
- North America
Data Sources, Market Sizing, and Validation
Desk Research
Desk work starts by grounding the market in measurable farming and irrigation activity, and then mapping where fertilizer and chemical application through irrigation is feasible and economically used. Public sources that help this step include, such as USDA and Economic Research Service agriculture datasets, FAOSTAT crop and input indicators, World Bank and UN data for irrigated land and water stress, and OECD-FAO outlook tables for crop area and yield direction.
We also scan open technical references, such as peer reviewed agronomy and irrigation journals, patent databases for injector and dosing innovations, and trade association websites connected to micro irrigation and crop input stewardship. For company context, we review annual reports, investor presentations, and reputable press coverage on irrigation adoption and input efficiency programs. In a few cases, paid subscriptions are used only for company financial intelligence, patent lookups, and shipment level trade checks for relevant components, and then the assumptions are cross-checked back to public signals. This list is not exhaustive, and many other sources were used for data collection, validation, and clarification during the work.
Primary Interviews and Surveys
Primary work focuses on validating how fertigation and chemigation are actually practiced across crop types and irrigation methods, and how pricing and adoption are moving in the current year. We spoke with a mix of irrigation system participants, agri input distributors, farm operators, agronomists, and regional experts across APAC, EMEA, and the Americas so that gaps from desk sources were closed and assumptions were stress-tested before finalizing the model.
Distribution of primary research fieldwork respondents
| Company type | Respondent position | Region |
|---|---|---|
| Top tier: 27% | CXOs: 17% | APAC: 37% |
| Mid tier: 55% | Functional/Unit leaders: 27% | EMEA: 37% |
| Smaller Players: 18% | Managers: 56% | Americas: 26% |
Market-Sizing & Forecasting
Sizing starts with a top-down build where irrigated area, crop mix, and irrigation method adoption are used to reconstruct the realistic demand pool for irrigation-applied nutrients and crop protection in each region. Once that pool is built, pricing and usage intensity are applied using variables like micro irrigation penetration (drip and sprinkler), share of high-value crops under irrigation, fertilizer and pesticide application rate shifts toward water soluble grades, and the pace of protected cultivation and greenhouse expansion.
To keep the totals practical, we then corroborate outputs with selective bottom-up checks, such as sampled average selling price ranges for injectors and dosing equipment, distributor channel checks for input mixes used in fertigation, and supplier-side reality checks on where chemigation is permitted and commonly used. Where country data is thin, proxy indicators are used, and then adjusted after expert feedback so the modeled adoption does not outrun infrastructure readiness.
Forecasting is run using multivariate regression, where the main drivers are irrigated land growth, water scarcity pressure, farm economics for yield improvement, and policy support for micro irrigation. Assumptions are reviewed with interview inputs, and scenarios are used when fertilizer price swings or irrigation subsidy timing can materially shift near-term demand.
Data Validation & Update Cycle
Validation is done by comparing model totals against independent signals that should move in the same direction, such as trends in micro irrigation installations, agriculture input spending, and crop acreage shifts in irrigated belts. When numbers look off, we re-check unit conversions, currency timing, and the split between fertigation and chemigation use cases, and then the logic is reviewed again before sign-off.
The report is refreshed annually, and interim updates are triggered when material events occur, such as sharp fertilizer price changes, major subsidy revisions, or new restrictions on chemical application through irrigation. Before delivery, we do a final pass to ensure the latest public data points and the most recent expert feedback are reflected in the outputs.
Mordor Intelligence's Fertigation and Chemigation Market Sizing Compared With Other Published Estimates
Published market sizes for fertigation and chemigation can vary even when they appear to describe the same topic, because the boundaries are set differently and not all models use the same activity indicators. The most common reasons include what gets counted as part of the delivery system, how water soluble inputs are treated, and which years are used as the anchor for price and adoption.
By tracking irrigated area suitability, micro-irrigation penetration, and injection-enabled usage in the current year, Mordor Intelligence keeps the estimate tied to irrigation-applied demand rather than blending in adjacent input categories that may be used outside irrigation. Differences also come from how chemigation is handled in regions where rules and farm practices limit chemical injection, along with how quickly assumptions are refreshed when fertilizer prices and subsidy programs move.
Benchmark comparison
| Source | Market Size | Gaps in Research Methodology |
|---|---|---|
| Mordor Intelligence | USD 50.30 B (2025) | |
| Global Consultancy A | USD 56.34 B (2026) | Uses a later anchor year and a faster growth runway, and the scope description is less explicit on excluding stand-alone mixing equipment and non-irrigation chemical application, which can lift the counted value. |
| Industry Publisher B | USD 59.10 B (2025) | Appears to apply broader category roll-ups and a higher CAGR path, with limited clarity on how much of the value is tied to pressurized irrigation delivery versus general crop input spending. |
The comparison shows that a one-year shift in the reference point and small scope choices around what is considered irrigation-delivered value can move the market size by several billions. Using clearly defined inclusions, practical adoption drivers, and cross-checks against irrigation activity helps keep the final number traceable and repeatable when the model is updated.


Key Questions Answered in the Report
What is the current value of the fertigation and chemigation market?
The fertigation and chemigation market size reached USD 52.68 billion in 2026 and is projected to climb to USD 66.33 billion by 2031.
Which irrigation method holds the largest share?
Drip systems dominate with 60.25% of fertigation and chemigation market share in 2025 because they deliver water and nutrients precisely to root zones.
Which region is projected to grow the fastest?
Africa is projected to achieve the highest CAGR of 8.92% through 2031, driven by increasing water scarcity and soil health initiatives that encourage fertigation investments.
How are governments encouraging adoption?
Subsidies, grants, and low-interest financing, including programs such as the USDA's conservation funding and India's micro-irrigation incentives, help farmers reduce capital costs and promote the faster adoption of technology.
What is the main barrier to wider adoption of variable-rate fertigation?
High upfront costs remain the chief constraint, with economic studies indicating payback periods that can exceed 27 years for sophisticated systems.
Page last updated on:


 Your data is secure and never sold or shared.


