
Ferritin Testing Market Size and Share
Market Overview
| Study Period | 2020 - 2031 |
|---|---|
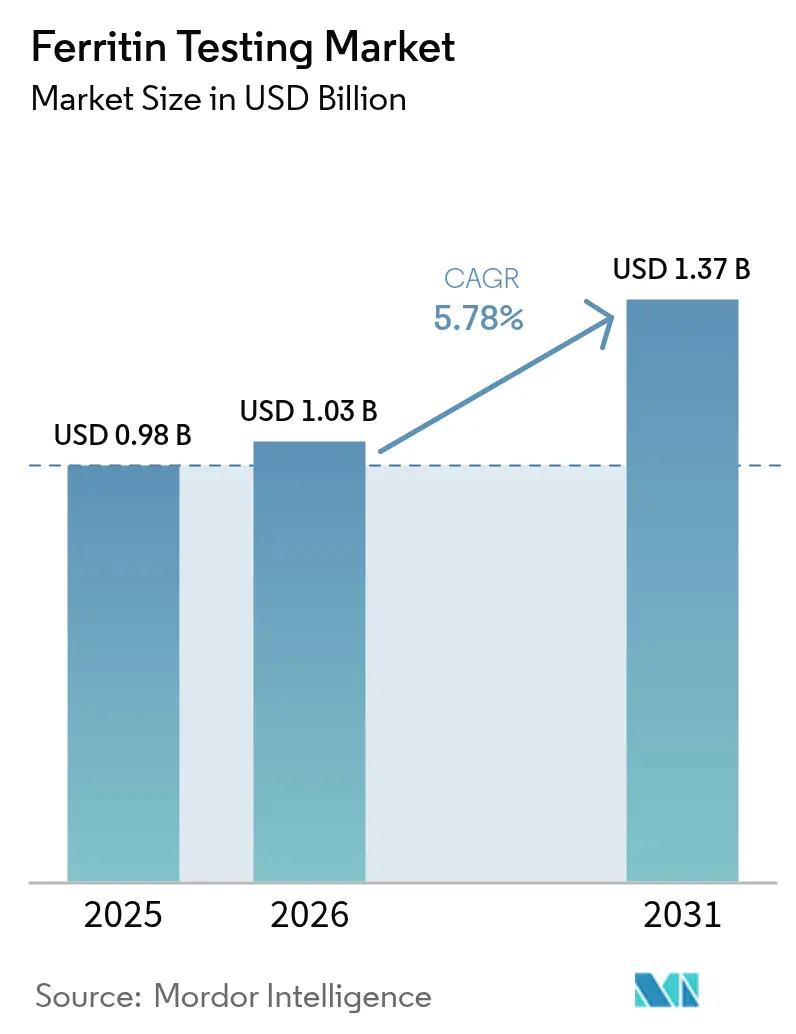
| Market Size (2026) | USD 1.03 Billion |
| Market Size (2031) | USD 1.37 Billion |
| Growth Rate (2026 - 2031) | 5.78 % |
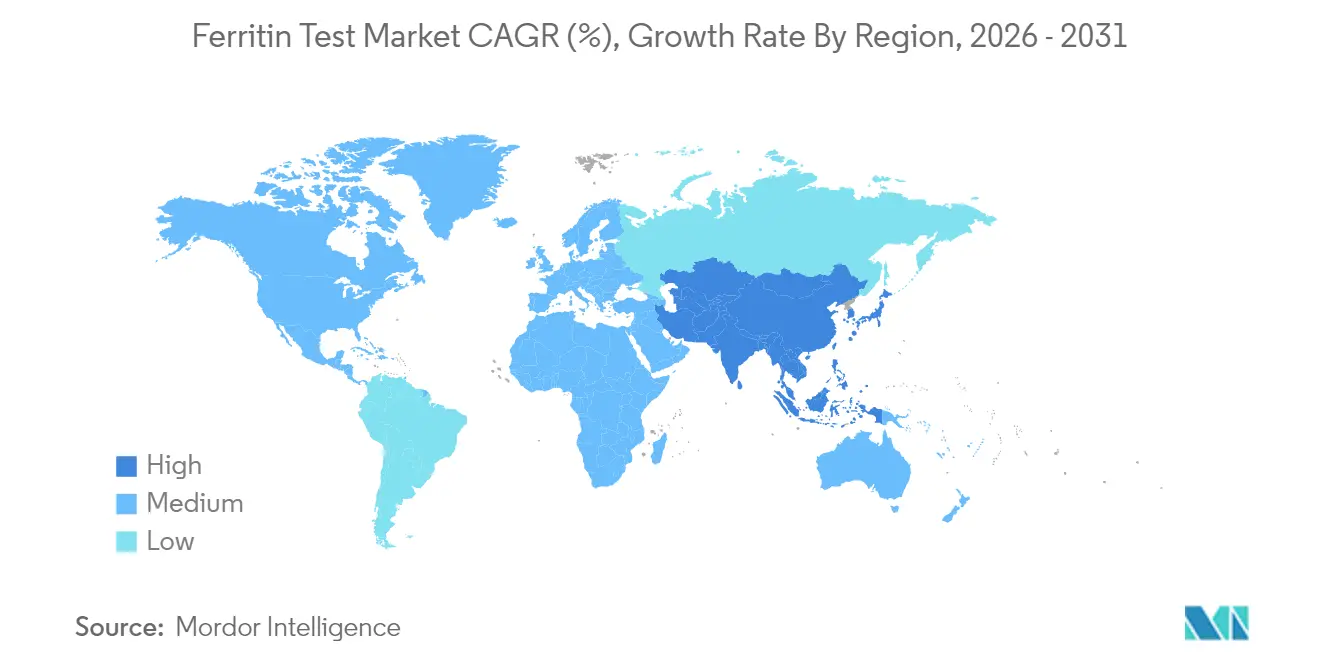
| Fastest Growing Market | Asia Pacific |
| Largest Market | North America |
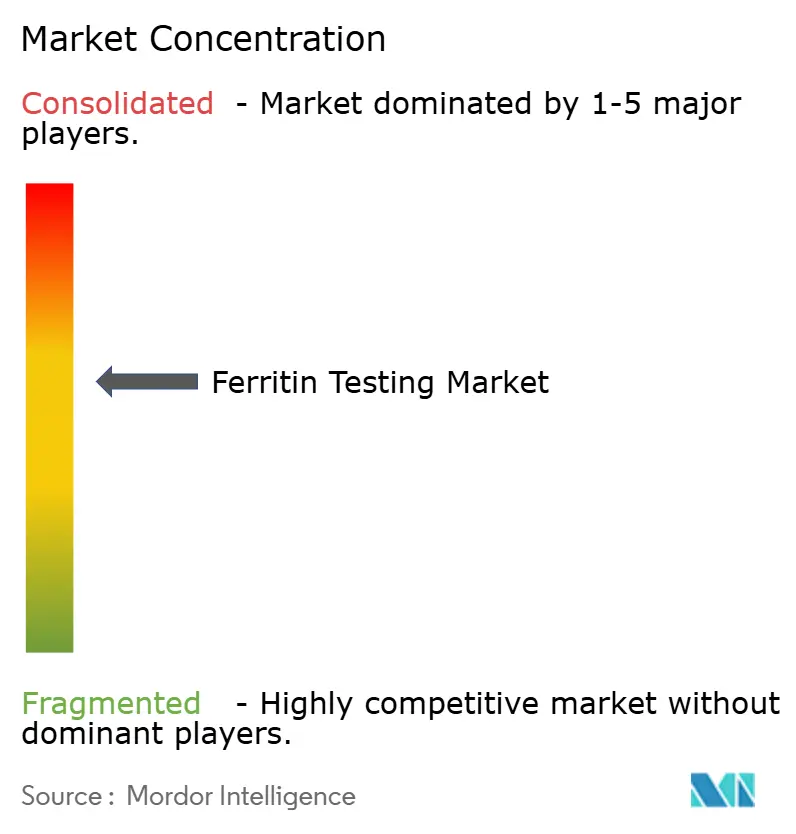
| Market Concentration | Medium |
Major Players *Disclaimer: Major Players sorted in no particular order Image © Mordor Intelligence. Reuse requires attribution under CC BY 4.0. | |
Ferritin Testing Market Analysis by Mordor Intelligence
The ferritin testing market size was valued at USD 0.977 billion in 2025 and estimated to grow from USD 1.03 billion in 2026 to reach USD 1.37 billion by 2031, at a CAGR of 5.78% during the forecast period (2026-2031). Solid expansion stems from wider clinical use of ferritin as both an iron-status index and an inflammatory biomarker, allowing clinicians to monitor chronic kidney disease, metabolic liver disorders, and oncology cases in a single assay. Government screening mandates in maternal health and refugee resettlement, the arrival of point-of-care (POC) devices that shorten results to minutes, and tighter reimbursement frameworks across OECD countries together keep demand on a steady upward track. Wider recognition of ferritin’s prognostic role in cardiovascular and oncology settings, coupled with rising CKD prevalence, is shifting routine iron panels from once-yearly tests toward longitudinal monitoring. Technology suppliers respond by pairing high-throughput chemiluminescence immunoassay (CLIA) systems with mobile-app-enabled lateral-flow readers, positioning themselves for decentralized adoption.
Key Report Takeaways
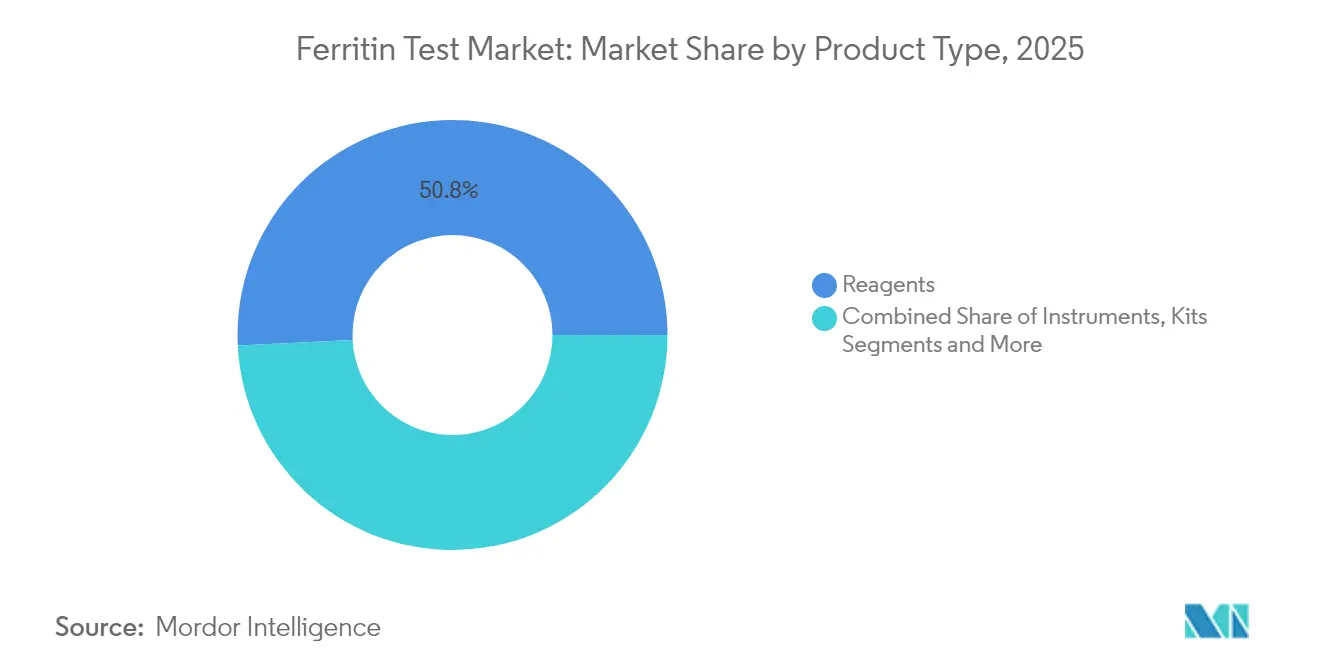
- By product type, reagents led with 50.78% revenue share in 2025, while point-of-care devices are projected to expand at a 8.85% CAGR through 2031.
- By specimen type, serum/plasma accounted for 67.10% of the ferritin testing market share in 2025; whole blood testing is advancing at a 9.95% CAGR.
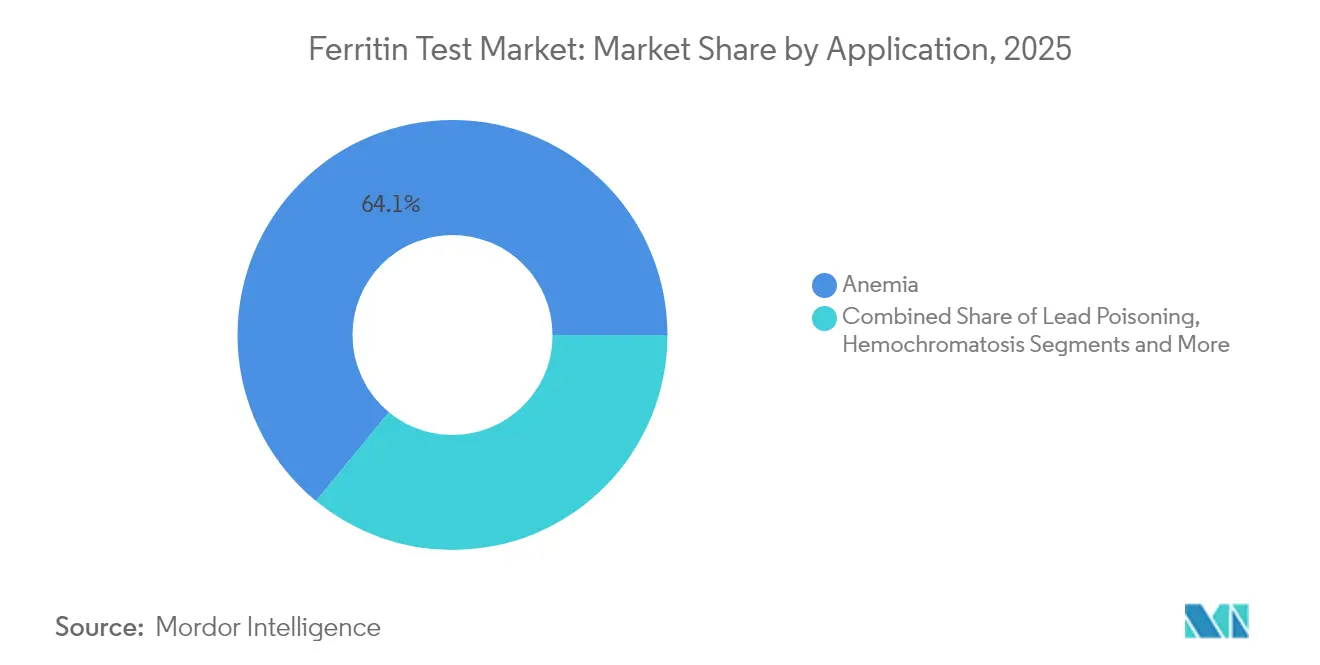
- By application, anemia diagnosis held 64.05% of the ferritin testing market size in 2025, whereas chronic kidney disease applications will rise at a 9.15% CAGR.
- By geography, North America commanded 30.95% revenue share in 2025; Asia-Pacific is set to register the fastest regional CAGR of 8.62% to 2031.
Note: Market size and forecast figures in this report are generated using Mordor Intelligence’s proprietary estimation framework, updated with the latest available data and insights as of 2026.
Market Trends and Insights
Drivers Impact Analysis of Ferritin Testing Market*
| Driver | (~) % Impact on CAGR Forecast | Geographic Relevance | Impact Timeline |
|---|---|---|---|
| Rising Prevalence Of Iron-Deficiency Anemia | 1.8% | Global, with concentration in Sub-Saharan Africa and South Asia | Long term (≥ 4 years) |
| Growing Burden Of Chronic Kidney Disease (CKD)-Linked Anemia | 1.2% | North America & EU, expanding to APAC | Medium term (2-4 years) |
| Expansion Of Government-Funded Maternal Health Screening Programs | 0.9% | APAC core, spill-over to MEA and Latin America | Medium term (2-4 years) |
| Adoption Of POCT Ferritin Devices In Low-Resource Settings | 1.1% | Sub-Saharan Africa, rural India, Southeast Asia | Long term (≥ 4 years) |
| Surge In Clinical Trials Using Ferritin As An Inflammatory Biomarker | 0.7% | Global, led by North America and EU research centers | Short term (≤ 2 years) |
| Reimbursement Expansion For Anemia Work-Ups Across OECD Countries | 0.5% | OECD countries, gradual adoption in emerging markets | Medium term (2-4 years) |
| Source: Mordor Intelligence | |||
Rising Prevalence of Iron-Deficiency Anemia
Iron deficiency anemia affects 1.2 billion people worldwide, with 28.6% prevalence among pregnant women in developing regions.[1] The CDC’s 2024 data brief reported a 9.3% anemia prevalence among the U.S. population aged 2 and older, climbing to 22% in Black communities. These epidemiological burdens compel health systems to institutionalize routine ferritin testing for at-risk groups, supported by the WHO’s 2024 guideline that harmonizes hemoglobin cut-offs globally.[2]Evidence shows ferritin below 30 ng/mL correlates with cognitive decline and reduced exercise tolerance, widening clinical justification for proactive screening. Standardized cut-offs and policy mandates directly feed continuous growth of the ferritin testing market.
Growing Burden of Chronic Kidney Disease (CKD)-Linked Anemia
CKD affects around 850 million people, and 40-60% develop anemia as renal function deteriorates. Hepcidin-mediated iron sequestration complicates management, making ferritin indispensable for differentiating absolute from functional deficiency ijms.com. Japanese practice audits revealed underuse of ferritin monitoring during therapy, flagging untapped market potential.[3] Novel treatments such as ferric carboxymaltose and HIF stabilizers demand precise ferritin tracking to prevent iron overload. A 2024 study linked ferritin above 346.05 μg/L to higher mortality in hemodialysis patients, reinforcing its prognostic importance.
Expansion of Government-Funded Maternal Health Screening Programs
Maternal iron deficiency affects up to 50% of pregnancies worldwide, driving many governments to embed ferritin testing in prenatal protocols. India’s Anemia Mukt Bharat strategy equips rural clinics with digital analyzers, creating predictable test volumes. China’s antenatal reforms after its two-child policy extend routine ferritin screening to a broader obstetric population. Saudi Arabia’s trimester-based guideline highlights demand gaps as compliance remains below 5%, implying large latent opportunity. USAID’s toolkit positions ferritin as an anchor for anemia interventions, influencing donor-funded projects across Africa and Asia.
Adoption of POCT Ferritin Devices in Low-Resource Settings
POC ferritin testing bridges diagnostic gaps where central labs are scarce. India’s deployment of digital hemoglobinometers validates viability, yet supply shortages reveal unmet demand. Smartphone-enabled readers now deliver results in 15 minutes from tiny capillary samples, cutting visit times and boosting adherence. The FDA cleared AnemoCheck Home in 2023, with U.S. retail launch in 2025, signaling regulatory comfort with at-home anemia screening. Ongoing research into saliva-based microfluidic assays targets pediatric and needle-averse groups, laying groundwork for broader decentralized uptake.
Restraints Impact Analysis of Ferritin Testing Market*
| Restraint | (~) % Impact on CAGR Forecast | Geographic Relevance | Impact Timeline |
|---|---|---|---|
| Availability Of Alternative Transferrin Saturation Tests | -0.8% | Global, particularly in cardiology and nephrology practices | Medium term (2-4 years) |
| High Cost Of Automated Immunoassay Analyzers | -0.6% | Emerging markets and small laboratory settings | Long term (≥ 4 years) |
| Limited Diagnostic Infrastructure In Sub-Saharan Africa | -0.4% | Sub-Saharan Africa, rural areas in developing countries | Long term (≥ 4 years) |
| Variability In Reference Ranges Across Ethnic Groups | -0.3% | Global, with emphasis on multi-ethnic populations | Short term (≤ 2 years) |
| Source: Mordor Intelligence | |||
Availability of Alternative Transferrin Saturation Tests
Recent cardiology research shows transferrin saturation (TSAT) correlates more tightly with mortality risk in heart failure than ferritin. Guidelines now advocate TSAT below 20% as the iron-deficiency cut-off, especially in inflammatory states where ferritin may be falsely elevated. The American Heart Association’s 2024 statement encourages hypoferremia-based definitions, which could divert some testing volume away from ferritin. Nonetheless, ferritin remains indispensable in iron supplementation monitoring and in conditions absent of systemic inflammation, softening this restraint’s long-term force.
High Cost of Automated Immunoassay Analyzers
Fully automated CLIA systems cost USD 100,000–500,000, deterring small laboratories and facilities in resource-constrained markets. Ongoing reagent expenses and service contracts add to total ownership costs. Leasing and pay-per-test models help mitigate capital barriers yet uptake remains modest where reimbursement is uncertain. Meanwhile, low-cost lateral-flow readers gain momentum, but their lower analytical precision can limit adoption in oncology or nephrology where tight dosage adjustments rely on exact ferritin values.
*Our forecasts treat driver/restraint impacts as directional, not additive. The impact forecasts reflect baseline growth, mix effects, and variable interactions.
Ferritin Testing Market Segment Analysis
By Product Type:
Reagents Dominate While POCT Devices AccelerateThe reagents segment generated 50.78% of 2025 revenue and anchors the ferritin testing market through constant consumption by automated analyzers in core laboratories. Recent procurement cycles in reference hospitals demonstrate limited sensitivity to economic slowdowns, underscoring the stickiness of reagent demand. High-throughput CLIA platforms such as Roche cobas 8000 can process more than 400 tests per hour, which tightly couples reagent consumption to routine chemistry panels. In parallel, point-of-care devices are set to expand at a 8.85% CAGR, propelled by primary-care chains, emergency departments, and humanitarian clinics seeking rapid turnaround. BD’s fingertip collection tubes paired with Babson Diagnostics’ micro-sample processing hardware illustrate the pivot toward capillary-based workflows. The Preventis SmarTest Ferritin Home kit connected to a smartphone app shows how at-home testing broadens the ferritin testing market.
Industries supplying analyzers integrate middleware that automatically uploads results into electronic health records, simplifying coding for reimbursement. That feature has grown from a nice-to-have to a procurement requirement in North America and Europe. Manufacturers tie analyzer installations to reagent rental contracts, ensuring predictable sales over the device’s lifespan. On the POC side, bioMérieux’s 2025 acquisition of SpinChip Diagnostics signals that major in-vitro diagnostics firms will buy innovation rather than build it in-house. SpinChip’s centrifugal microfluidic platform delivers quantitative ferritin readings from whole blood within 10 minutes, narrowing the historical precision gap between lab-based CLIA and bedside tests. As accuracy converges, price transparency and ease of use will determine the pace at which POC devices erode the incumbent reagent-dominated revenue model.

By Specimen Type:
Serum Dominance Challenged by Whole Blood InnovationSerum and plasma specimens contributed 67.10% of global revenue in 2025, reflecting long-established venipuncture workflows and their proven analytical robustness. Large hospitals prefer serum because high-speed centrifuges and automated track systems already exist to process thousands of samples daily. Yet whole blood testing is gaining traction at a 9.95% CAGR, buoyed by fingertip collection kits that reduce patient discomfort and eliminate centrifugation. Validation studies conducted by BD demonstrate quantitative agreement between capillary and venous draws within clinically acceptable limits, reinforcing clinician trust. Whole blood also aligns with humanitarian missions where cold-chain logistics remain a hurdle, making single-step assays attractive.
The ferritin testing market size for whole blood platforms is projected to broaden as centrifugal microfluidic cartridges achieve limits of detection below 15 ng/mL, adequate for pediatric anemia screening. Urine and saliva remain in early research stages. Pilot data show urinary ferritin tracks body iron stores in infants, though assay sensitivity must improve before commercial roll-out. Saliva-based lateral-flow cassettes under development at several U.S. universities aim to reach a detection threshold of 10 ng/mL, but present challenges in matrix effects and standardization. Long term, non-invasive matrices could unlock new patient cohorts, yet serum and whole blood are poised to remain mainstays through 2031.
By Assay Technique:
CLIA Leadership Faces Lateral Flow DisruptionChemiluminescence immunoassay retained 37.35% of revenue in 2025 due to high analytical sensitivity and seamless integration into consolidated automation lines. Siemens’ Atellica Solution DL IM1600 can run 440 ferritin tests per hour while re-indexing reagents automatically, cutting manual touches. CLIA also provides broad reportable ranges, permitting both anemia and iron-overload evaluation from a single dilution. That entrenched position, however, is being challenged by lateral-flow tests projected to expand at a 8.42% CAGR. Modern readers use CMOS cameras paired with cloud algorithms to quantify signal intensity, bringing coefficient-of-variation values below 8%, acceptable for primary-care decision making.
The ferritin testing market size for lateral flow remains modest today, yet technology breakthroughs such as Preventis’ smartphone-assisted quantitation are improving clinician confidence. ELISA occupies a steady niche in research labs requiring batched testing; multiplex bead-based assays now detect ferritin at sub-femtomolar concentrations, offering future promise for oncology prognostics. BIO-FLASH random-access chemiluminescent analyzers reduce reagent waste by up to 30%, improving operating cost for mid-sized hospitals. Long term, convergence between CLIA precision and lateral-flow convenience will dictate share shifts, with software integration and sample handling ease determining procurement decisions.
By Application:
Anemia Focus Expands to Chronic Disease ManagementAnemia diagnosis generated 64.05% of 2025 revenue, underscoring ferritin’s historical role in iron deficiency work-ups. Yet chronic kidney disease applications are forecast to post the swiftest expansion at a 9.15% CAGR as nephrologists adopt ferritin thresholds to steer intravenous iron and erythropoiesis-stimulating agent dosing. Data linking ferritin above 346.05 μg/L to higher mortality in dialysis patients is prompting practitioners to embed ferritin targets in quality-of-care metrics. Hemochromatosis programs in Europe and North America continue to order ferritin alongside transferrin saturation to monitor genetically predisposed populations.
Beyond traditional domains, oncology trials increasingly track ferritin as a negative prognostic marker. Breast cancer studies find that ferritin plus CA153 improves metastatic prediction compared to CA153 alone, hinting at inclusion in multi-analyte panels. In metabolic dysfunction-associated steatotic liver disease, ferritin exceeding 215.5 μg/L stratifies disease progression risk more accurately than ALT alone. The ferritin testing market is thus broadening into multi-biomarker algorithms that support personalized medicine, reinforcing test frequency and volume growth.
By End User:
Hospital Dominance Shifts Toward Decentralized TestingHospitals accounted for 51.88% of revenue in 2025 as centralized labs run high-throughput CLIA systems used across multiple disciplines. The new FDA regulations that tighten oversight on laboratory-developed tests favor large hospital systems with compliance infrastructure, indirectly consolidating volumes in tertiary centers. Nonetheless, clinics and dedicated POC sites are poised for the fastest growth at a 9.38% CAGR, supported by value-based care contracts that reward immediate diagnosis. Retail pharmacy chains increasingly add ferritin panels to walk-in wellness menus, illustrating care delivery migration.
Diagnostic mega-laboratories still attract esoteric testing, yet profit margins in routine ferritin are thin, encouraging them to outsource on-site phlebotomy to hospital networks. Research institutes make up a smaller share but drive assay innovation, particularly in non-invasive matrices and ultra-high sensitivity detection. Overall, the ferritin testing market is witnessing a dual-channel model in which hospital core labs handle high-volume stable demand, while decentralized POC nodes respond to convenience-driven episodic testing.
Geography Analysis
North America Ferritin Testing Market
North America generated 30.95% of 2025 revenue, anchored by high awareness, comprehensive insurance coverage, and robust analyzer fleets inside acute-care hospitals. The U.S. Preventive Services Task Force’s 2024 update that formalized ferritin screening in pregnancy strengthened baseline demand. Canada’s provincial guidelines mirror the U.S. stance, while immigrant screening programs by the CDC add niche volume. Large commercial laboratories such as Quest Diagnostics benefit from cross-state logistics, reinforcing the region’s leadership.
APAC Ferritin Testing Market
Asia-Pacific is forecast to deliver an 8.62% CAGR, the highest globally, as governments institutionalize large-scale anemia control programs. India’s Anemia Mukt Bharat initiative funds digital reagent analyzers in district hospitals, creating a predictable pipeline for the ferritin testing market. China’s expansion of antenatal care under its two-child policy likewise broadens ferritin screening, while Japan’s nephrology societies issue new monitoring guidelines for CKD. Public-private partnerships accelerated point-of-care device trials in Indonesia and Vietnam, signaling fertile ground for mobile testing services.
EMEA and LATAM Ferritin Testing Market
Europe maintains steady adoption thanks to universal healthcare and the rollout of the In-Vitro Diagnostic Regulation, which harmonizes performance requirements. The ferritin testing market size in Europe remains anchored in hospital labs, but decentralized pilots in the United Kingdom’s NHS community hubs illustrate a gradual shift. Middle East and Africa are projected to expand but from a low base, constrained by infrastructure. Gulf Cooperation Council hospitals invest in automated immunoassay lines to align with JCI accreditation, while Sub-Saharan clinics rely on donor-funded lateral-flow strips. Latin America shows moderate growth, with Brazil incorporating ferritin in national prenatal protocols and Argentina piloting POC analyzers in primary-care outposts.
Regulatory Landscape
Ferritin testing is regulated as an in-vitro diagnostic (IVD) across major markets, with the European Union governed by Regulation (EU) 2017/746 (IVDR) and the United States moving toward fuller FDA oversight for laboratory-developed tests (LDTs). In the EU, Commission Implementing Regulation (EU) 2026/977 (established 4 May 2026) sets uniform quality management and procedural requirements for notified bodies under IVDR, shaping conformity assessment pathways for immunoassays used on automated analyzers and for quantitative point-of-care ferritin systems.
In the United States, the FDA finalized its LDT rule on 6 May 2024, initiating a 4-year phaseout of enforcement discretion so that IVDs manufactured by laboratories generally align with medical device requirements. Stage 1 began in May 2025, covering medical device reporting, correction and removal reporting, and quality system complaint files, which raises compliance expectations for health systems and specialty labs that run ferritin as part of anemia and chronic disease monitoring. In parallel, the United Kingdom continues to regulate IVDs via MHRA guidance for medical devices and in-vitro diagnostics, keeping UKCA-related requirements relevant for suppliers selling ferritin kits and readers into NHS and private laboratory channels.
Value Chain Analysis
The ferritin testing value chain starts with specialized inputs for immunoassays, including monoclonal antibodies and assay chemistries (for example, acridinium ester chemiluminescent labels) and calibrator materials traceable to WHO-linked references, then proceeds to assay formulation, packaging, and instrument-specific configuration for CLIA analyzers and quantitative lateral-flow readers. Manufacturing is concentrated among large IVD platform companies and a smaller tier of kit and point-of-care developers, while distribution flows through direct sales to hospital systems, group purchasing organizations, and laboratory distributors that handle routine reagent replenishment and service contracts for analyzer uptime.
Downstream, clinical laboratories and hospital core labs drive repeat demand through high-throughput workflows, while clinics and decentralized sites increasingly purchase integrated POC systems that combine capillary sampling with app-enabled readers. Supply-side friction points include exposure to transportation bottlenecks and trade-related disruptions for diagnostic reagents (noted by clinical laboratory trade reporting in June 2026), along with procurement shifts in which some large health systems unbundle reagent agreements from analyzer placement to prioritize volume-commitment pricing. Contract and cost scrutiny also increased as laboratories audited vendor invoices tied to IVD import tariff pass-throughs following US Supreme Court-related tariff refund dynamics discussed in April to May 2026, influencing near-term procurement tactics for consumables-heavy ferritin testing programs.
Competitive Landscape
The ferritin testing market is moderately consolidated. Roche Diagnostics, Siemens Healthineers, and Thermo Fisher Scientific anchor the high-throughput CLIA space, leveraging broad reagent portfolios and global service organizations. Roche’s cobas line integrates ferritin alongside infectious disease markers, enabling laboratories to amortize platform costs across multiple panels. Siemens tailors reagent rental contracts that bundle analyzer placement with long-term consumable commitments, locking in share. Thermo Fisher emphasizes open-channel configurations on its Indiko analyzers to support smaller laboratories.
bioMérieux’s EUR 138 million acquisition of SpinChip Diagnostics underlines the strategic weight of POC. The deal gives bioMérieux centrifugal microfluidic technology capable of processing ferritin in under 10 minutes, setting a new benchmark for bedside accuracy. Danaher’s 2025 establishment of two Centers of Innovation in Diagnostics focuses on companion diagnostics, implying ferritin could be embedded in multi-analyte kits tailored to targeted therapies. Regulatory tightening by the FDA around laboratory-developed tests raises compliance costs, favoring multinationals with regulatory resources and automated quality systems.
Smaller innovators differentiate through non-invasive matrices and smartphone connectivity. Sanguina’s AnemoCheck Home leverages colorimetric chemistry interpreted by app-based algorithms, reflecting consumerization trends. Preventis integrates cloud storage for longitudinal ferritin curves, catering to chronic-disease self-management. While incumbents pilot similar digital overlays, execution speed may dictate whether disruptors capture durable share. Overall, the landscape reflects a tug-of-war in which automation scale advantages counterbalance agile POC entrants.
Ferritin Testing Industry Leaders
-
ThermoFisher Scientific
-
bioMérieux SA
-
Siemens Healthineers
-
Abbott Laboratories
-
F. Hoffmann-La Roche Ltd
- *Disclaimer: Major Players sorted in no particular order
Ferritin Testing Market Companies Covered in this Report
- Thermo Fisher Scientific
- Roche
- Siemens Healthineers
- Abbott Laboratories
- HORIBA
- bioMérieux
- Randox Laboratories
- DiaSys Diagnostic Systems
- QuidelOrtho
- Danaher
- Sysmex
- Abnova
- Aviva Systems Biology
- Eurolyser Diagnostica
- Monobind
- Sekisui Diagnostics
- Omega Diagnostics
- Mindray
- Bio-Rad Laboratories
- Euroimmun
Market Opportunities and Future Outlook
Decentralized ferritin testing creates a clear whitespace in low-resource and consumer-adjacent settings, where turnaround time and sample logistics can determine adoption, supported by the market shift toward capillary, smartphone-assisted quantitation. Product activity in this direction includes Preventis SmarTest Pro Ferritin, an app-based lateral flow approach for quantitative ferritin measurement in capillary blood (product information updated January 2026), and Unicharm’s Sofy Kit for Checking Iron Deficiency using menstrual blood for screening (announced November 2025, effective December 1, 2025). Together, these signals point to expanding sampling modalities beyond venipuncture-based serum workflows.
On the regulated lab and health-system side, opportunity is tied to reimbursement stability and compliance-driven consolidation of testing into organizations with established quality infrastructure. In the United States, CMS updates linked to the Clinical Laboratory Fee Schedule (CLFS) set the next data reporting window for applicable laboratories as May 1, 2026 through July 31, 2026 (based on a January 1, 2025 through June 30, 2025 data collection period), and CY 2026 has no phased-in payment reduction under CLFS, supporting operational planning for routine anemia work-ups that include ferritin. Separately, the FDA clearance pathway for ferritin immunological systems remains active, illustrated by Beckman Coulter receiving FDA 510(k) clearance (K234052) in March 2024 for its Access Ferritin immunological test system under 21 CFR 866.5340, reinforcing ongoing platform refresh cycles in hospital and reference lab environments.
Recent Industry Developments in Ferritin Testing Market
- March 2026: Shield Therapeutics announced that the European Medicines Agency adopted a positive opinion to extend the indication for FeRACCRU (ferric maltol) to adolescents aged 12 years and older. Broader labeled use of oral iron therapy increases the number of monitored patients and reinforces routine iron-status tracking that includes ferritin testing. It also supports more standardized anemia management pathways across pediatric-to-adult transitions in Europe.
- November 2025: Unicharm announced the launch of the Sofy Kit for Checking Iron Deficiency, using menstrual blood for screening, effective December 1, 2025. This introduces a consumer-facing sampling modality that can pull screening volume earlier in the care pathway, outside traditional laboratory draws. The move highlights rising interest in at-home or self-collection approaches that can complement confirmatory ferritin testing in clinics and labs.
- March 2024: Beckman Coulter received FDA 510(k) clearance (K234052) for its Access Ferritin immunological test system under 21 CFR 866.5340. The clearance reinforces ongoing platform refresh cycles in hospital and reference lab environments and expands ferritin testing capabilities in routine anemia and iron-status monitoring programs.
Ferritin Testing Market Report Scope and Research Methodology
Market Definition and Coverage
This market covers revenues generated from ferritin tests used to quantify ferritin levels in human samples, which helps clinicians assess iron status and related clinical conditions. It includes commonly used laboratory and point-of-care formats that are purchased and used by routine testing settings.
Scope exclusions: Tests that only measure other iron markers without directly determining ferritin are excluded (for example, hemoglobin-only or transferrin saturation-only testing).
Segments Covered in This Report
- By Product Type
- Instruments
- Reagents
- Kits
- Point-of-Care Devices
- Automated Analyzers
- By Specimen Type
- Serum/Plasma
- Whole Blood
- Other Specimens
- By Assay Technique
- ELISA
- Chemiluminescence Immunoassay (CLIA)
- Immunoturbidimetric Assay
- Lateral Flow Assay
- Others
- By Application
- Anemia
- Hemochromatosis
- Lead Poisoning
- Chronic Kidney Disease
- Other Applications
- By End User
- Hospitals
- Diagnostic Laboratories
- Clinics / POCT Centers
- Research Institutions
- By Geography
- North America
- United States
- Canada
- Mexico
- Europe
- Germany
- United Kingdom
- France
- Italy
- Spain
- Rest of Europe
- Asia-Pacific
- China
- Japan
- India
- Australia
- South Korea
- Rest of Asia-Pacific
- Middle East and Africa
- GCC
- South Africa
- Rest of Middle East and Africa
- South America
- Brazil
- Argentina
- Rest of South America
- North America
Data Sources, Market Sizing, and Validation
Desk Research
Desk research was used to build the starting structure of the model and to anchor the clinical and utilization context for ferritin testing. We referred to public health and statistics sources such as the World Health Organization anemia and nutrition references, Centers for Disease Control and Prevention materials on iron deficiency, National Institutes of Health clinical resources, and the US Census Bureau population data as a demand pool base.
On the supply and commercialization side, we also used sources such as company annual reports, investor presentations, product documentation on manufacturer websites, regulatory listings where relevant, and peer reviewed laboratory medicine journals that describe ferritin assay methods and typical use patterns (for example ELISA and chemiluminescence immunoassays). Where needed, subscribed company financials and intelligence databases, plus a patent database, were used to cross-check company activity and product footprints. These examples are not exhaustive, and many other public sources were also used for data collection, validation, and research clarification.
Primary Interviews and Surveys
Primary work was used to pressure test assumptions that desk research cannot settle cleanly, especially on test ordering frequency, channel mix, and pricing movements across care settings. We spoke with stakeholders from diagnostic laboratories, hospital labs, distributors, and assay and analyzer focused participants across APAC, EMEA, and the Americas, and then reconciled differences through follow-up where responses conflicted.
Distribution of primary research fieldwork respondents
| Company type | Respondent position | Region |
|---|---|---|
| Top tier: 33% | CXOs: 14% | APAC: 46% |
| Mid tier: 46% | Functional/Unit leaders: 36% | EMEA: 32% |
| Smaller Players: 21% | Managers: 50% | Americas: 22% |
Market-Sizing & Forecasting
Sizing starts with a top-down build where population cohorts and likely tested patient pools are reconstructed by region, and then converted into expected ferritin test volumes using clinical testing behavior and care access assumptions. Once the demand pool is shaped, the model applies typical tests per patient per year and then multiplies by an average realized price that reflects a mix of hospital labs, diagnostic labs, and point-of-care use.
To make sure the totals are not drifting, we corroborate them with selective bottom-up approximations, such as sampled supplier and channel checks, and a volume times ASP cross-check for major regions using interview inputs. Key variables that guide the model include anemia prevalence and screening intensity, pregnancy testing patterns in routine panels, adoption of automated immunoassay analyzers in laboratories, reagent to instrument utilization ratios, and the share of testing running through hospital versus independent labs, which together explain why volumes and pricing differ across geographies.
For forecasting, scenario analysis is used so that changes in screening guidelines, lab automation expansion, and reimbursement pressure can be translated into separate growth paths. Where primary inputs are missing for smaller countries or low transparency channels, proxy assumptions are used from clinically similar markets and then adjusted after expert review so the estimates stay practical and repeatable.
Data Validation & Update Cycle
Validation is done by triangulating model outputs against independent signals, and then checking whether implied per capita testing and price levels look realistic versus interview feedback and publicly observed diagnostics spend patterns. When a region shows a sharp jump or an unusual drop, the underlying drivers are re-checked, and respondents are re-contacted if the variance cannot be explained by a clear change in utilization or pricing.
Before sign-off, the workbook is reviewed in multiple steps so that formulas, unit conversions, and currency treatment are consistent across countries and years. Reports are refreshed annually, with interim updates triggered by material events such as guideline shifts, regulatory changes affecting assay availability, or meaningful pricing resets. Right before delivery, a final pass is completed so clients receive the latest updated view.
Mordor Intelligence's Ferritin Testing Market Size Measured Against Other Published Estimates
Published market sizes for ferritin testing often look inconsistent because the underlying scope and counting logic can vary a lot across studies. Differences usually come from what is counted as a ferritin test, how prices are averaged across lab settings, and how quickly assumptions get refreshed when testing behavior shifts.
Tests that only measure other iron markers without directly determining ferritin sit outside Mordor Intelligence's scope, which can pull the total lower versus studies that bundle a wider iron panel under the same heading. The spread also comes from whether pricing is treated as a blended realized price across hospital and independent labs or a list-price style view, and whether demand is built from tested patient pools versus broader disease prevalence without a utilization bridge.
Benchmark comparison
| Source | Market Size | Gaps in Research Methodology |
|---|---|---|
| Mordor Intelligence | USD 1.03 B (2026) | |
| Global Consultancy A | USD 0.99 B (2025) | Uses a different base year and reporting window, and the scope description does not clearly separate ferritin-only testing from broader iron status diagnostics, which can shift the counted revenue pool. |
| Industry Publisher B | USD 0.50 B (2025) | Appears to apply narrower revenue capture and a longer forecast frame, and the pricing basis is not transparent across hospital labs versus diagnostic laboratories, which can understate the blended realized market value. |
Taken together, the table shows that year selection, what is treated as a ferritin test, and how pricing is blended across care settings explain most of the gap. When inputs are tied back to clear utilization steps and checked with interview feedback, the final value becomes easier to trace and to update when assumptions change.
Key Questions Answered in the Report
What is the current value of the ferritin testing market?
The ferritin testing market stood at USD 1.03 billion in 2026 and is projected to reach USD 1.37 billion by 2031.
Which region grows fastest in ferritin testing?
Asia-Pacific posts the highest forecast CAGR of 8.62% as government screening programs and point-of-care adoption accelerate.
Why are point-of-care ferritin tests important?
POC ferritin devices provide results in under 15 minutes using small capillary samples, improving screening reach in low-resource or high-throughput settings.n the Ferritin Testing Market.
How does CKD influence ferritin testing demand?
CKD-related anemia affects up to 60% of patients, driving repeated ferritin monitoring to guide intravenous iron therapy and assess mortality risk.