
Facility Management Software Market Size and Share
Market Overview
| Study Period | 2020 - 2031 |
|---|---|
| Market Size (2026) | USD 2.98 Billion |
| Market Size (2031) | USD 4.95 Billion |
| Growth Rate (2026 - 2031) | 10.68 % |
| Fastest Growing Market | Asia Pacific |
| Largest Market | North America |
| Market Concentration | Medium |
Major Players *Disclaimer: Major Players sorted in no particular order Image © Mordor Intelligence. Reuse requires attribution under CC BY 4.0. | |
Facility Management Software Market Analysis by Mordor Intelligence
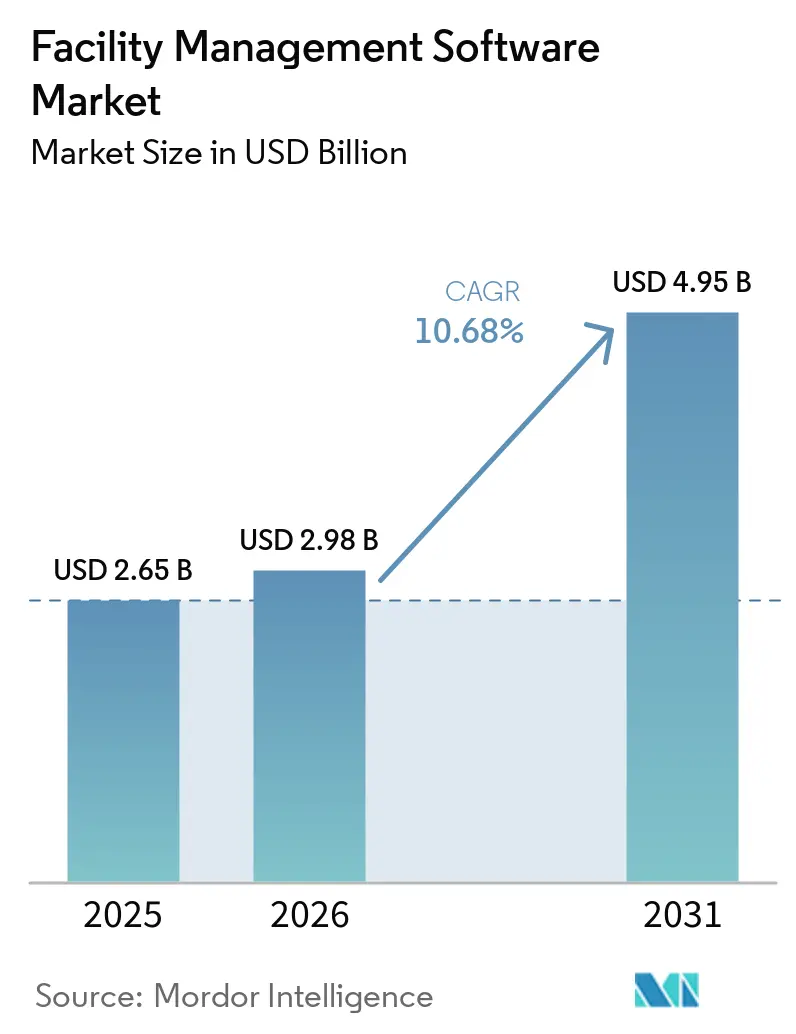
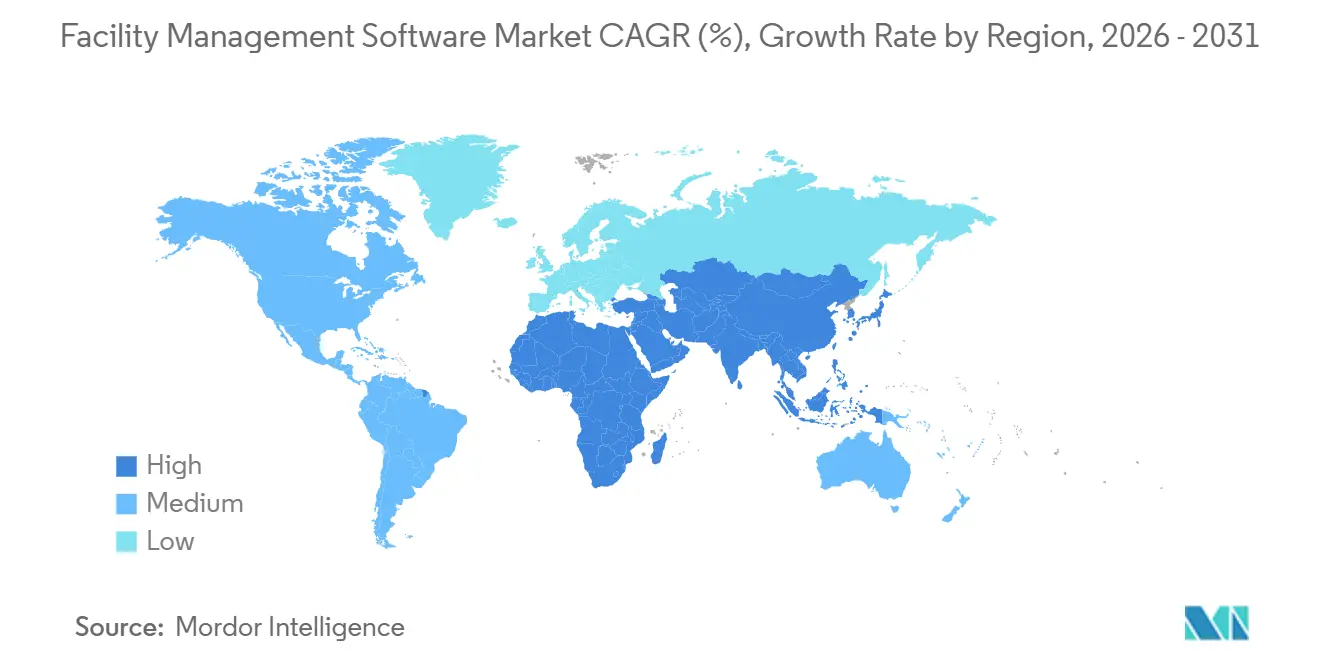
The Facility Management Software Market size is expected to increase from USD 2.65 billion in 2025 to USD 2.98 billion in 2026 and reach USD 4.95 billion by 2031, growing at a CAGR of 10.68% over 2026-2031. Robust growth reflects the accelerated migration to the cloud, the rapid integration of IoT sensors, mounting sustainability mandates, the need for hybrid workspace optimization, and the widening adoption across public infrastructure. Cloud-based deployment captured 72.12% share in 2025, IoT-enabled predictive maintenance cut downtime costs by up to 40%, and energy-management modules outpaced legacy asset tools as net-zero commitments reshaped procurement. Competitive intensity increased as incumbents integrated AI and digital twin capabilities, while implementation costs and cybersecurity concerns continued to pose headwinds. Regional momentum diverged: North America held 37.46% of the revenue in 2025, yet the Asia-Pacific region is advancing at a 26.30% CAGR through 2031.
Key Report Takeaways
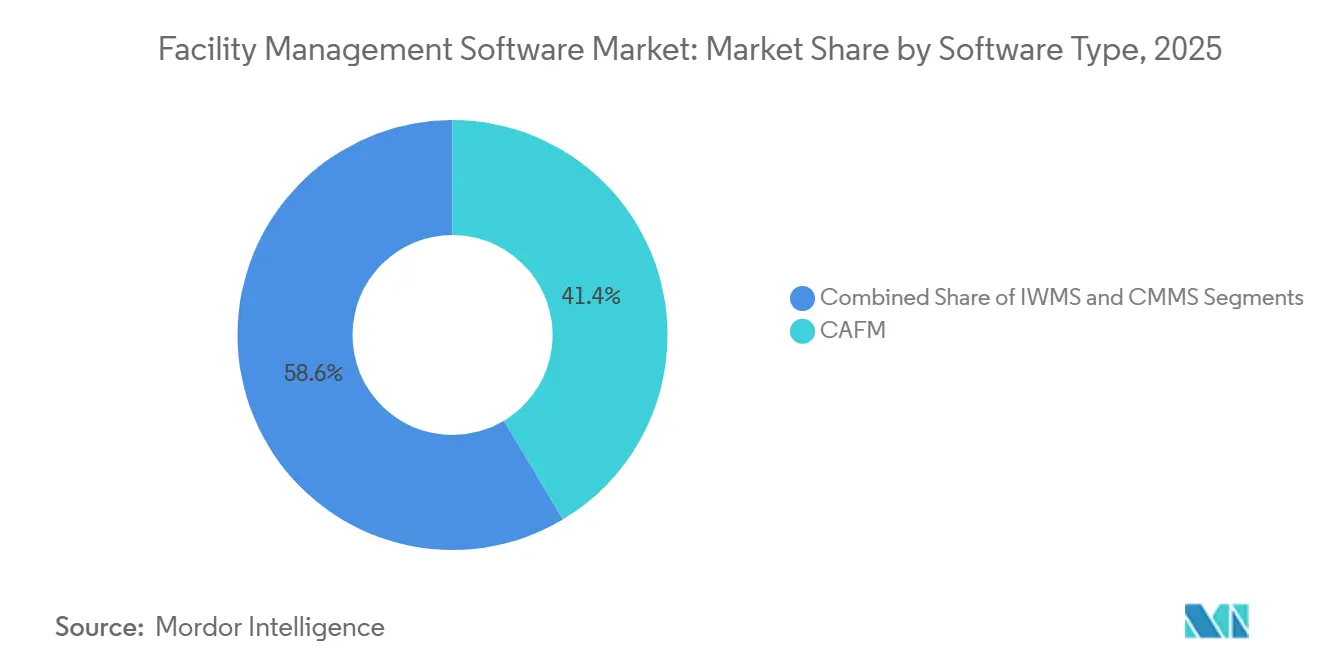
- By software type, computer-aided facility management led with a 41.40% revenue share in 2025, whereas integrated workplace management systems are projected to grow at a 16.80% CAGR through 2031.
- By deployment model, cloud solutions dominated with a 72.12% market share in 2025, while on-premises solutions remained the slowest-growing segment at a 3.1% CAGR through 2031.
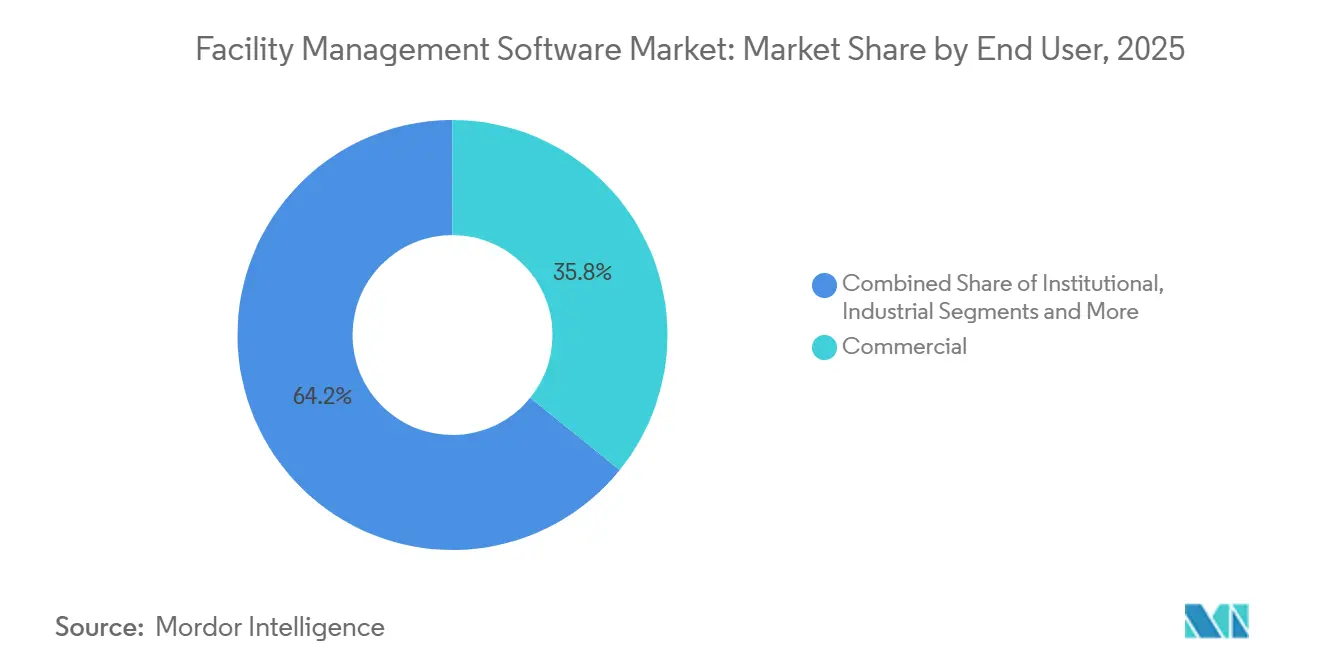
- By end user, commercial facilities generated 35.80% of the revenue in 2025; public infrastructure is forecast to expand at an 18.50% CAGR through 2031.
- By functionality, asset management retained 32.91% of the facilities management software market size in 2025; however, energy-management modules are expected to grow at a 21.30% CAGR through 2031.
- By geography, North America held a 37.46% revenue share in 2025; the Asia-Pacific region is projected to rise at a 26.30% CAGR through 2031.
Note: Market size and forecast figures in this report are generated using Mordor Intelligence’s proprietary estimation framework, updated with the latest available data and insights as of January 2026.
Market Trends and Insights
Drivers Impact Analysis of Facility Management Software Market*
| Driver | (~) % Impact on CAGR Forecast | Geographic Relevance | Impact Timeline |
|---|---|---|---|
| Growing Adoption of Cloud-Based SaaS Platforms | +2.5% | Global, strongest in North America and Europe | Medium term (2-4 years) |
| Integration of IoT Sensors for Predictive Maintenance | +2.0% | Asia-Pacific manufacturing hubs, North America commercial real estate | Short term (≤ 2 years) |
| Rising Focus on Sustainability and Energy Efficiency | +1.8% | Europe, North America, Asia-Pacific | Long term (≥ 4 years) |
| Proliferation of Hybrid-Work Models Driving Space-Optimization Tools | +1.5% | North America and Europe commercial offices, Asia-Pacific financial districts | Short term (≤ 2 years) |
| Smart-City Mandates in Emerging Economies | +1.2% | Asia-Pacific core, Middle East, selected South America metros | Long term (≥ 4 years) |
| Increasing Use of Digital Twins for Asset Lifecycle Management | +1.0% | North America and Europe industrial, the Middle East mega-projects, Asia-Pacific infra | Medium term (2-4 years) |
| Source: Mordor Intelligence | |||
Growing Adoption of Cloud-Based SaaS Platforms
Subscription economics convert capital expenditure into operating expenses, broadening access for mid-market buyers while shortening deployment cycles from 18 months to roughly six months. ServiceNow’s workplace suite secured 1,200 enterprise customers in 2025, citing pricing flexibility as the top factor.[1] Multi-tenant architectures enable vendors to continuously push AI updates, a benefit that on-premises systems lack. Such agility strengthens vendor lock-in and raises switching costs, underpinning sustained double-digit expansion.
Integration of IoT Sensors for Predictive Maintenance
Sensor proliferation enables a shift from reactive to predictive maintenance, resulting in up to 40% lower downtime. Fracttal’s roll-out of 50,000 vibration sensors across Latin American plants detected failures 72 hours in advance and saved USD 12 million in 2024[2]. Edge computing and 5G connectivity enable sub-second alerts, while partnerships, such as SAP’s 2025 tie-up with Siemens’ MindSphere, integrate telemetry with asset histories for optimized spare-part planning.
Rising Focus on Sustainability and Energy Efficiency
Revised regulations, such as Europe’s 2024 Energy Performance of Buildings Directive, compel continuous energy monitoring to avoid penalties. Deloitte’s 2024 survey found 61% of facility managers rank energy analytics above traditional CMMS features. Platforms like Schneider Electric’s EcoStruxure combined with Microsoft Azure Digital Twins track real-time carbon output across 12,000 buildings, cutting HVAC energy 18-22% in pilot programs.
Proliferation of Hybrid-Work Models Driving Space-Optimization Tools
Hybrid schedules yielded an average U.S. office utilization of 40% in 2024, prompting widespread desk-booking deployment. VergeSense sensors covering 85 million square feet revealed 67% underutilization of conference rooms, sparking the need for AI reallocation tools. Financial gains are tangible: JLL Technologies identified USD 340 million in annual lease savings for Fortune 500 clients in 2024 by merging badge data with sensor readings.
Restraints Impact Analysis of Facility Management Software Market*
| Restraint | (~) % Impact on CAGR Forecast | Geographic Relevance | Impact Timeline |
|---|---|---|---|
| Legacy System Integration Complexities | -0.8% | Acute in North America and Europe, with aging BMS infrastructure | Medium term (2-4 years) |
| High Up-Front Implementation and Training Costs | -0.7% | Global, especially mid-market enterprises in Asia-Pacific and South America | Short term (≤ 2 years) |
| Data-Privacy and Cyber-Security Concerns | -0.6% | Europe (GDPR), North America state privacy laws | Long term (≥ 4 years) |
| Shortage of FM-Specific Data-Analytics Talent | -0.5% | Asia-Pacific emerging markets, Middle East infrastructure projects | Long term (≥ 4 years) |
| Source: Mordor Intelligence | |||
Legacy System Integration Complexities
Proprietary protocols inflate project costs by 40-60%, with Siemens Desigo CC controllers requiring custom middleware for third-party IWMS integration. Honeywell’s 2024 launch of 47 pre-built connectors reduced some friction, yet 38% of projects still exceeded budgets. Healthcare campuses illustrate the challenge: a 12-building migration to Johnson Controls OpenBlue lasted 14 months due to pneumatic legacy controls.
High Up-Front Implementation and Training Costs
Total cost of ownership averaged USD 1.8 million over five years for portfolios between 2-5 million square feet, with 42% of spend allocated to change management. Smaller organizations face disproportionate costs, delaying adoption despite strong ROI projections. Training burdens remain heavy: a 2025 municipal roll-out of Accruent’s Famis 360 demanded 2,400 staff-hours and consumed 18% of budget.
*Our forecasts treat driver/restraint impacts as directional, not additive. The impact forecasts reflect baseline growth, mix effects, and variable interactions.
Facility Management Software Market Segment Analysis
By Software Type:
IWMS Platforms Gain Ground on Unified Data ModelsIntegrated workplace management systems represented the fastest-growing segment, with a 16.80% CAGR through 2031. However, computer-aided facility management retained 41.40% of the facilities management software market share in 2025. Large enterprises favor IWMS for consolidated lease, capital project, and energy analytics, as evidenced by deployments of IBM TRIRIGA and Oracle Primavera Unifier. Computerized maintenance management systems appeal to asset-intensive verticals, with mobile-first vendors such as UpKeep and MaintainX posting 89% adoption within 60 days. The facilities management software market size for IWMS is forecast to expand rapidly as CFOs strive to replace three or more point solutions by 2027, while CAFM remains entrenched in sectors prioritizing rapid roll-out and lower complexity.
IWMS complexity demands longer roll-out horizons, often six to 12 months, while CMMS achieves faster time to value technician-centric workflows. Planon’s integration of CMMS within its IWMS architecture during 2024 blurred segment lines. Archibus introduced digital-twin visualization in 2025 to narrow capability gaps, although its CAFM roots still underpin its value proposition. Market bifurcation persists: Fortune 500 landlords consolidate around IWMS, mid-market industrial players lean toward CMMS simplicity, and commercial real-estate groups balance CAFM familiarity with selective IWMS upgrades.

By Deployment Model:
Cloud Dominance Reshapes Vendor EconomicsCloud solutions accounted for 72.12% of the revenue in 2025 and are progressing at an 11.30% CAGR through 2031, reflecting subscription affordability, continuous AI updates, and lower IT overhead. The facilities management software market size for cloud deployments surged as Oracle migrated Primavera to Oracle Cloud Infrastructure, with 78% of new clients choosing SaaS in 2024[3]. On-premises deployments persist in defense and regulated sectors where data sovereignty matters, but R&D outlays favor cloud enhancements. Hybrid deployments bridge the security and analytics needs; SAP S/4HANA for Real Estate enables hospitals to keep sensitive room assignments on-site while processing occupancy insights in Azure.
Multi-tenant economics allow pure-play SaaS vendors to undercut legacy pricing by 40-50%. ServiceChannel handled 14 million work orders in 2024, proving scalability benefits. ISO 27001 certification has become a standard, with Eptura and Planon both achieving compliance in 2024 to alleviate enterprise security concerns. Over time, cloud adoption is expected to compress margins for on-premises support while stimulating ecosystem partnerships centered on AI, digital twins, and IoT telemetry.
By End User:
Public Infrastructure Adoption Accelerates on Smart-City MandatesPublic infrastructure is the fastest-growing end-user segment, with an 18.50% CAGR through 2031, driven by national smart-city programs in China and India. China’s 2024 mandate for digital twins in metropolitan areas with a population of over 5 million inhabitants spurred IWMS adoption across Shenzhen and Chengdu. India’s Smart Cities Mission earmarked USD 1.2 billion for FM procurement, with Cisco’s Kinetic platform winning key contracts. Commercial real estate remained the largest segment, accounting for 35.80% of revenue in 2025, as firms reoptimized their portfolios for hybrid work; however, growth is moderating alongside office downsizing trends.
Institutional buyers, such as hospitals and universities, prioritize CMMS to document preventive maintenance for compliance, while industrial plants gravitate toward asset-centric CMMS solutions like Brightly’s Corrigo to manage 890,000 machines globally. Franchise-oriented hospitality chains increasingly adopt configurable platforms to standardize maintenance across decentralized property owners, bolstered by JLL Technologies’ 2024 release of franchise-friendly Corrigo modules. Despite diverse needs, the rapid rise of public infrastructure underscores how municipal accountability and voter scrutiny drive the digitization of asset management.
By Functionality:
Energy Management Surges on Net-Zero CommitmentsEnergy-management modules are forecast to rise at a 21.30% CAGR through 2031, surpassing the 32.91% market share of facilities management software that asset-management tools commanded in 2025. Corporate decarbonization pledges boost demand for real-time carbon dashboards and AI-optimized HVAC scheduling. Schneider Electric’s EcoStruxure and Microsoft’s Azure Digital Twins partnership trimmed building energy by 18-22% across 12,000 sites in 2024. Maintenance management growth is steady as predictive analytics replace reactive workflows, while space management tools peaked amid pandemic-driven seat optimization projects.
Asset management remains foundational, providing depreciation and capital planning insights. Yet sustainability credentials increasingly sway purchasing decisions: 67% of facility managers prioritized energy analytics in Deloitte’s 2024 poll. Vendors answer with embedded ESG reporting, dynamic tariff benchmarking, and automated certificate audits. Over the forecast period, energy management is expected to command a larger slice of the facilities management software market size, especially in Europe where non-compliant owners face escalating fines.
Geography Analysis
North America Facility Management Software Market
North America generated 37.46% of the revenue in 2025, driven by stringent performance ordinances in cities such as New York and San Francisco that require energy benchmarking. The U.S. General Services Administration’s 2024 mandate for digital building oversight opened a USD 340 million procurement avenue. Canada trails by roughly two years, but British Columbia’s 2024 code update accelerated adoption in Vancouver. Mexico’s nearshoring boom spurred a 28% growth in CMMS in 2024, as manufacturers prioritized uptime.
Europe Facility Management Software Market
Europe’s revised 2024 EPBD compels near-zero energy in new buildings, funneling EUR 500 million (USD 565 million) in German grants toward IWMS and energy platforms. France and the Nordics mirror Germany’s incentives, while the United Kingdom’s 2025 Building Safety Act tightens maintenance documentation rules, boosting CMMS demand.
APAC Facility Management Software Market
The Asia-Pacific region is the fastest-growing region, with a 26.30% CAGR through 2031, driven by China’s smart-city investments and India’s digitization of municipal assets. Japan’s Society 5.0 program interconnected 23,000 public buildings with national IoT backbones in 2024. South Korea allocated KRW 780 billion (USD 590 million) for smart-building retrofits. Australia’s 2024 National Construction Code revisions have enforced energy modeling, leading to increased SaaS energy-management subscriptions in Sydney and Melbourne.
MEA and South America Facility Management Software Market
Middle East demand centers on mega-projects: Saudi Arabia’s NEOM integrated IBM TRIRIGA and Siemens Desigo CC for end-to-end asset oversight. Dubai Municipality’s 2025 rule mandates the adoption of digital twins in towers exceeding 20 floors, ensuring sustained IWMS procurement. Africa is nascent, but it gains traction as Nigeria updates its national building code. South America’s momentum rests in Brazil, where São Paulo’s 2024 performance law accelerated IWMS penetration; Chile follows with green-building incentives, while Argentina’s macroeconomic headwinds dampen spending.
Regulatory Landscape
Building-energy and smart-building rules are a key external driver for facility management software procurement, especially where energy benchmarking and automation are required. In the European Union, the revised Energy Performance of Buildings Directive (EU) 2024/1275 requires member states to transpose provisions covering building automation and smart metering into national law by May 29, 2026, which pushes owners of larger non-residential buildings toward continuous monitoring, fault detection, and benchmarking workflows supported by FM platforms. To operationalize compliance, CEN/TR 18276:2026 (published February 2026) provides a BACS-oriented checklist for evaluating EPBD conformity.
Data access and privacy obligations also affect product requirements and deployment choices. EPBD Article 16 addresses non-discriminatory access to building systems data for owners and managers, which supports demand for interoperable integrations across BMS, IoT telemetry, and IWMS/CAFM layers. In the United States, local performance ordinances such as New York City Local Laws 84 and 97 reinforce annual benchmarking and emissions-cap tracking for large buildings, increasing demand for auditable energy and asset records. At the same time, these requirements raise cybersecurity and data-governance expectations for cloud deployments.
Value Chain Analysis
The value chain starts with software product development (CAFM/IWMS/CMMS modules), cloud and platform infrastructure, and security and compliance layers. It then goes through system integration and implementation partners that connect FM suites to BMS, IoT sensors, ERP/finance, and identity systems. Integration captures meaningful value because legacy protocol and data-model constraints often require middleware, connectors, and data normalization before energy, maintenance, and space workflows can be unified. As cloud adoption expands (72.12% share in 2025), platform vendors and hyperscaler ecosystems increasingly shape reference architectures, uptime SLAs, and compliance certifications.
Downstream, value concentrates in managed services, continuous optimization, and outcome-linked programs such as predictive maintenance, energy analytics, and hybrid-workplace utilization. Vendor roadmaps and lifecycle actions also influence partner activities and customer migration services. IBM is consolidating real estate and facilities management capabilities under the Maximo Application Suite via Maximo Real Estate and Facilities, while ending new orders for TRIRIGA SaaS as of January 28, 2026 (with support concluding September 30, 2027). Platform consolidation shifts services demand toward data migration, API-led integration (including OpenShift-aligned architectures), and ongoing configuration to maintain compliance with evolving energy and data-access requirements.
Competitive Landscape
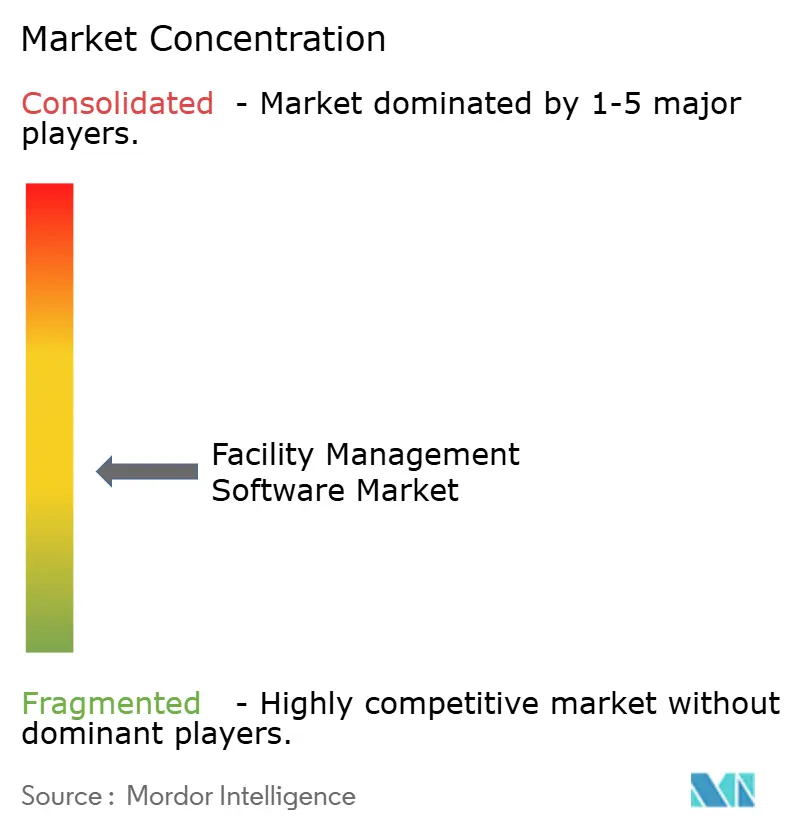
The market is moderately fragmented, with the top five vendors holding a combined share of roughly 38% in 2025. IBM, Oracle, and SAP dominate Fortune 500 IWMS deployments via ERP bundling, whereas mid-market buyers gravitate toward Planon, Accruent, and Eptura for speed and cost benefits. Siemens’ USD 1.5 billion acquisition of Brightly Software in January 2025 and ServiceNow’s USD 2.5 billion purchase of Moveworks in November 2024 highlight an acquisition race for AI capabilities. Mobile-first disruptors UpKeep and MaintainX expanded their user base by 180,000 in 2024, undercutting incumbent pricing by up to 50%.
The strategic focus centers on embedding predictive analytics and generative AI for work-order triage, along with enhanced IoT integrations. Trimble’s 2024 patent filing for computer-vision space algorithms typifies IP-driven differentiation. Regional vendors protect their niches through localized compliance features and language support, yet face margin compression as global SaaS platforms expand their regional data centers. Competitive intensity is projected to intensify through 2027, with laggards at risk of being commoditized amid rising expectations for AI.
Facility Management Software Industry Leaders
-
IBM Corporation
-
Oracle Corporation
-
SAP SE
-
Trimble Inc.
-
SIERRA ODC Private Limited
- *Disclaimer: Major Players sorted in no particular order
Facility Management Software Market Companies Covered in this Report
- IBM Corporation
- Oracle Corporation
- SAP SE
- SIERRA ODC Private Limited
- Trimble Inc.
- Broadcom Inc.
- Accruent LLC (Fortive)
- Planon Software
- Eptura
- UpKeep Technologies
- FTMaintenance (FasTrak)
- Brightly (Siemens)
- Infor (Hexagon)
- Limble CMMS
- MaintainX Inc.
- FMX (Facilities Management eXpress)
- eMaint (Fluke Corporation)
- Dude Solutions
- iOFFICE + SpaceIQ
- Archibus
- ServiceChannel
Market Opportunities and Future Outlook
Regulatory-driven automation and energy compliance create a clear whitespace for FM platforms that can package monitoring, fault detection, and audit-ready reporting into deployable templates. The EU EPBD (EU) 2024/1275 transposition deadline of May 29, 2026, along with supporting guidance such as CEN/TR 18276:2026, raises the priority of BACS-aligned workflows and evidence trails. This supports vendors and integrators that can connect BMS data, meters, and energy-management modules with limited custom development. EPBD Article 16 also points to an opportunity for vendors that build secure, non-discriminatory data access features, including role-based sharing, APIs, and vendor-neutral connectors, to reduce lock-in concerns while supporting multi-system oversight.
A second opportunity is migration and consolidation as enterprises rationalize point solutions and legacy IWMS estates into fewer platforms. IBM ending new orders for TRIRIGA SaaS in January 2026, along with consolidating capabilities into Maximo Real Estate and Facilities, increases demand for structured migration tooling, partner-led delivery, and hybrid deployment designs that preserve sensitive operational data while enabling analytics. At the same time, predictive maintenance and AI-assisted service workflows support higher attach rates for IoT integrations and work-order triage, which creates room for sensor-agnostic onboarding, pre-built connectors, and packaged service offerings that combine software with specialist operational expertise, for example HVACR-focused maintenance and monitoring programs.
Recent Industry Developments in Facility Management Software Market
- July 2026: Announced a strategic partnership with Carter Synergy to integrate HVACR expertise with Accruent's IoT-based predictive monitoring and CAFM system for multi-site retail estates. The collaboration expands CAFM and IoT driven FM capabilities for retail properties and strengthens cross-sell opportunities within Accruent's platform by improving asset reliability and service coverage.
- July 2026: Announced the availability of Trimble Financials software in the United States, a simplified financial management and job costing solution for small-business contractors. The move directly affects construction and FM project cost management and subcontractor workflows, potentially extending Trimble's FM ecosystem into finance and influencing project economics and vendor lock-in.
- April 2026: IBM Maximo Application Suite as a Service for Government achieved FedRAMP Moderate Authorization, enabling federal agencies to manage assets and facilities in the cloud. The authorization activates government adoption of cloud based FM platforms and supports AI enabled facilities management and platform consolidation.
- February 2026: SIERRA ODC Private Limited successfully completed a three-week implementation of eFACiLiTY at Lake Turkana Wind Power (LTWP). eFACiLiTY is a comprehensive IWMS and CAFM platform that centralizes and automates facility, asset, maintenance, and service operations. The implementation digitized LTWP’s substation equipment and overhead power collector network, covering 365 wind turbines across 40,000 acres. It also automated work orders, material requests, asset management, and inventory tracking, reducing manual paperwork and improving operational efficiency and auditability.
Facility Management Software Market Report Scope and Research Methodology
Market Definition and Coverage
This market covers revenue earned from facility management software that helps plan, run, and track building and workplace operations, including assets, maintenance work orders, space usage, and related compliance reporting, across private and public facilities.
Scope exclusions: We exclude outsourced facility services and hardware-only building controls unless they are bundled and priced as part of the software subscription or license.
Segments Covered in This Report
- By Software Type
- Computer-Aided Facility Management (CAFM)
- Integrated Workplace Management Systems (IWMS)
- Computerized Maintenance Management Systems (CMMS)
- By Deployment Model
- Cloud
- On-Premise
- Hybrid
- By End User
- Commercial
- Institutional
- Public Infrastructure
- Industrial
- Other End User Segments
- By Functionality
- Asset Management
- Maintenance Management
- Space Management
- Energy Management
- By Geography
- North America
- United States
- Canada
- Mexico
- Europe
- Germany
- United Kingdom
- France
- Italy
- Spain
- Russia
- Rest of Europe
- Asia-Pacific
- China
- Japan
- India
- South Korea
- Australia
- Rest of Asia-Pacific
- Middle East
- Saudi Arabia
- United Arab Emirates
- Turkey
- Rest of Middle East
- Africa
- South Africa
- Nigeria
- Rest of Africa
- South America
- Brazil
- Argentina
- Rest of South America
- North America
Data Sources, Market Sizing, and Validation
Desk Research
Desk research was used to map the demand setting and to anchor assumptions that are relatively easy to verify across countries and end users. Public sources such as the U.S. Energy Information Administration (building energy use and efficiency signals), the U.S. General Services Administration (federal facility footprint and modernization activity), Eurostat (nonresidential construction and building stock indicators), and the International Energy Agency (policy and energy intensity trends) were used to understand where software demand is likely to expand.
We also reviewed company filings, annual reports, earnings decks, credible press coverage, and association publications that discuss workplace trends, maintenance digitization, and sustainability reporting. Where needed, paid databases for company financials, news, patent lookups, and shipment-level trade checks were used to fill gaps around vendor revenue splits and pricing direction. The desk sources listed above are illustrative only, and we relied on other public references for cross-checks and clarification.
Primary Interviews and Surveys
Primary work focused on validating what buyers actually pay for, how deployments are packaged, and which modules get adopted first across industries and regions. We spoke with facility teams, IT and digital workplace leaders, and channel and implementation participants so that pricing logic, renewal patterns, and cloud migration timing could be checked directly and then used to adjust model inputs where desk signals were incomplete.
Distribution of primary research fieldwork respondents
| Company type | Respondent position | Region |
|---|---|---|
| Top tier: 31% | CXOs: 12% | APAC: 47% |
| Mid tier: 53% | Functional/Unit leaders: 32% | EMEA: 30% |
| Smaller Players: 16% | Managers: 56% | Americas: 23% |
Market-Sizing & Forecasting
Sizing starts with a top-down build where enterprise and public-sector digital operations spend, combined with the active building and workplace footprint, are used to reconstruct the addressable pool for facility software. That pool is then shaped by practical adoption rates and by average software pricing patterns (subscription and license mixes), and the totals are checked against selective bottom-up approximations like sampled vendor revenues, module-level ASP ranges, and channel feedback on typical seat or site counts.
Inputs were kept market-specific and repeatable, including the pace of cloud deployment versus on-premise, adoption of IWMS, CAFM, and CMMS platforms, average facilities per organization for key end users, module attach rates for maintenance, space, and energy management, and renewal and expansion behavior as organizations add sites. When a bottom-up check had missing disclosure, we used conservative ranges derived from multiple interviews and public financial commentary, and then adjusted only if the implied spend per site did not look realistic for the region.
For forecasting, scenario analysis was used so that adoption and pricing can be stressed under faster or slower cloud migration, capital spending cycles, and policy-led sustainability reporting pressure. The final projection reflects a base case agreed through expert feedback, and it is further kept consistent with observable signals like construction activity direction and energy efficiency investment priorities.
Data Validation & Update Cycle
Outputs are validated through multiple passes where model totals are compared with independent indicators such as enterprise software spending direction, building stock expansion, and disclosed software revenue trends for relevant categories. Large variances are investigated by reviewing geography splits, implied pricing per site, and adoption rates by end user, followed by targeted re-contacts when a specific assumption is driving the swing.
Before sign-off, the model and calculations are reviewed by another analyst, and any anomalies are documented and corrected. Reports are refreshed annually, with interim updates triggered by material events such as sharp pricing changes, major regulatory updates tied to energy reporting, or a clear shift in deployment mix. Right before delivery, a final check is performed so clients receive the latest aligned view.
Mordor Intelligence's Facility Management Software Market Sizing Compared With Other Published Estimates
Published market numbers for facility management software can look far apart because the scope is not always treated the same and because pricing assumptions move quickly as cloud subscriptions expand. Differences also show up when some studies use older base years, mix constant currency with current currency, or apply adoption rates that are not tested with buyer-side inputs.
The main gap comes from whether adjacent facility services and building automation software are folded into the same total, where Mordor Intelligence counts only software revenue tied to CAFM, IWMS, and CMMS style platforms and keeps implementation services out unless they are inseparable in the software contract price.
Benchmark comparison
| Source | Market Size | Gaps in Research Methodology |
|---|---|---|
| Mordor Intelligence | USD 2.98 B (2026) | |
| Global Consultancy A | USD 3.60 B (2026) | Includes a broader spend pool by adding a portion of facility services and bundled implementation fees, which inflates software-only revenue in multi-year enterprise contracts. |
| Industry Association B | USD 2.30 B (2025) | Uses an earlier base year and a narrower vendor set that overweights on-premise licenses, and it does not fully adjust for faster cloud subscription expansion and module attach rates. |
The comparison shows that most variance is explained by what is counted as software revenue and how quickly pricing and adoption are refreshed. By keeping inputs tied to observable deployment mix, module adoption, and buyer-validated pricing ranges, the model remains traceable to clear steps that can be repeated when new signals emerge.
Key Questions Answered in the Report
What is the current global value of facilities management software?
Spending reached USD 2.98 billion in 2026 and is forecast to approach USD 4.95 billion by 2031.
Which deployment model is expanding fastest?
Cloud-based subscriptions, already holding 72.12% share in 2025, are growing at an 11.30% CAGR through 2031.
How quickly is Asia-Pacific demand increasing?
Regional revenue is projected to climb at a 26.30% CAGR through 2031, the highest worldwide, led by smart-city programs in China and India.
What payback period are buyers seeing on energy-management modules?
AI-optimized HVAC scheduling and real-time analytics have trimmed energy costs 18-22%, delivering payback in roughly 14 months.
Which factor most commonly delays large implementations?
Integration with legacy building-management systems can extend project timelines by 6-9 months and raise budgets 40-60%.
What level of market concentration characterizes the supplier landscape?
The top five vendors control about 38% of global revenue, indicating moderate concentration with ample room for niche providers.