
Facial Care Products Market Size and Share
Market Overview
| Study Period | 2021 - 2031 |
|---|---|
| Market Size (2026) | USD 138.74 Billion |
| Market Size (2031) | USD 187.59 Billion |
| Growth Rate (2026 - 2031) | 6.22 % |
| Fastest Growing Market | South America |
| Largest Market | Asia Pacific |
| Market Concentration | Medium |
Major Players *Disclaimer: Major Players sorted in no particular order Image © Mordor Intelligence. Reuse requires attribution under CC BY 4.0. | |
Facial Care Products Market Analysis by Mordor Intelligence
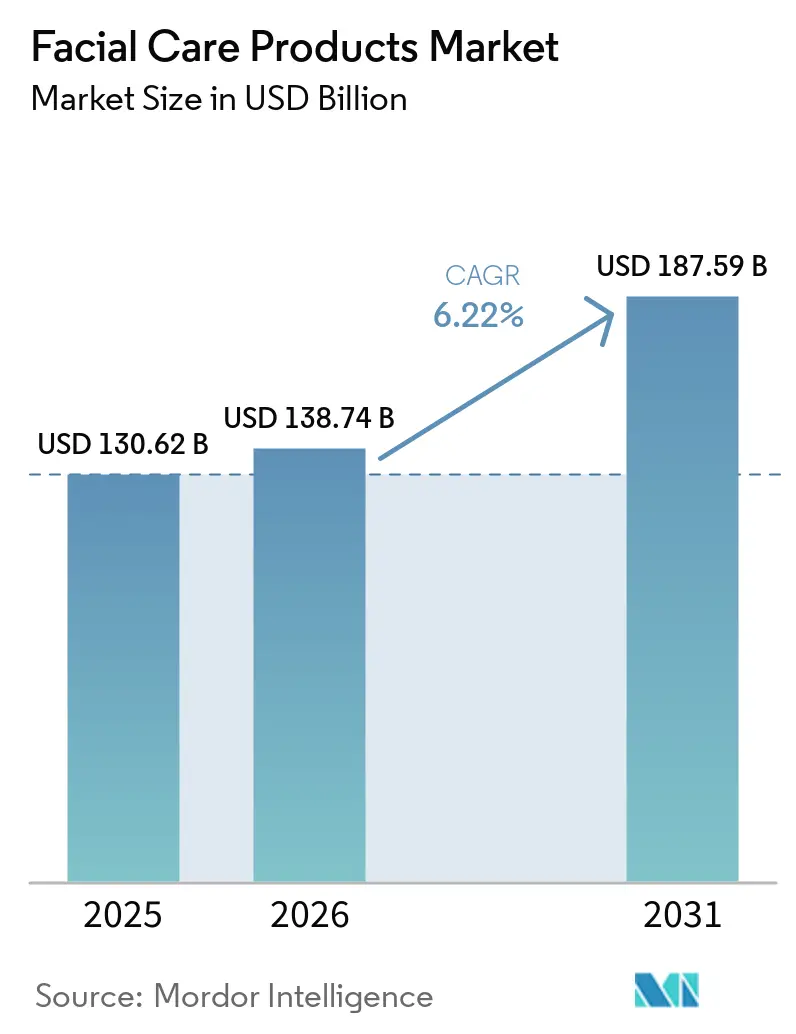
The facial care market size was valued at USD 130.62 billion in 2025 and estimated to grow from USD 138.74 billion in 2026 to reach USD 187.59 billion by 2031, at a CAGR of 6.22% during the forecast period (2026-2031). Current momentum stems from a consumer shift toward preventive skin health, stringent scrutiny of ingredient transparency, and rapid product innovation. Asia-Pacific continues to anchor growth as localized C-beauty formulations and K-beauty exports scale, while South America records the fastest expansion on the back of botanical-based offerings and rising disposable income. Premiumization, propelled by masstige strategies, compresses the distance between price and science-backed efficacy. Online social commerce redraws distribution economics, and biotechnology reshapes the supply chain for actives and emollients.
Key Report Takeaways
- By product type, moisturizers and creams led with 58.45% revenue share of the facial care market in 2025, whereas toners are set to expand at a 6.78% CAGR through 2031.
- By formulation, conventional formulations retained 68.24% of the facial care market share in 2025, yet natural and organic variants will grow at a 6.89% CAGR, outpacing the headline rate.
- By category, mass offerings accounted for 70.22% of the facial care market size in 2025, and premium offerings are forecast to rise at a 7.36% CAGR, outstripping the mass segment.
- By distribution channel, online retail stores are projected to grow at a 7.53% CAGR to 2031, eroding the 48.21% share held by beauty and health stores in 2025.
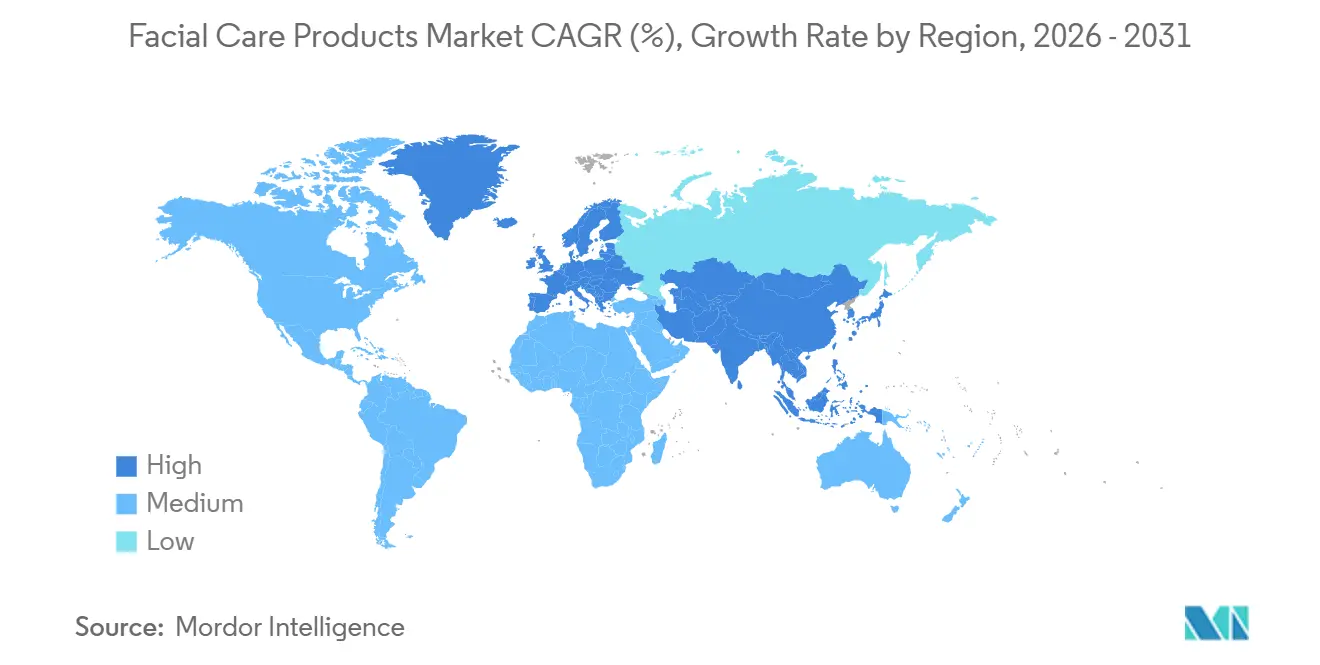
- By geography, Asia-Pacific captured 47.21% of 2025 revenue; South America is projected to advance at an 8.03% CAGR, the fastest among all regions.
Note: Market size and forecast figures in this report are generated using Mordor Intelligence’s proprietary estimation framework, updated with the latest available data and insights as of January 2026.
Market Trends and Insights
Drivers Impact Analysis of Facial Care Products Market*
| Driver | (~) % Impact on CAGR Forecast | Geographic Relevance | Impact Timeline |
|---|---|---|---|
| Consumer inclination towards organic and natural products | +1.2% | Global, with strongest adoption in North America and Europe | Medium term (2-4 years) |
| Influence of social media and celebrity endorsement | +0.8% | Global, particularly strong in Asia-Pacific and North America | Short term (≤ 2 years) |
| Technological innovations in product formulations | +0.6% | Global, led by North America and Europe research and development centers | Long term (≥ 4 years) |
| Increasing demand for anti-aging products | +0.5% | Global, with highest impact in developed markets | Medium term (2-4 years) |
| Growing demand for multifunctional facial care products | +0.7% | Global, with early adoption in urban centers | Medium term (2-4 years) |
| Growing awareness regarding skin-related issues | +0.4% | Global, accelerated by health campaigns | Short term (≤ 2 years) |
| Source: Mordor Intelligence | |||
Consumer inclination towards organic and natural products
The shift toward organic and natural facial care products represents a fundamental transformation in consumer behavior, driven by heightened awareness of ingredient safety and environmental sustainability. This trend extends beyond food to personal care, where consumers increasingly scrutinize ingredient lists and seek products free from synthetic chemicals. The California Department of Public Health's Cosmetic Safety Program mandates that products labeled as organic must contain at least 70% organic content, establishing regulatory frameworks that support market transparency[1]. The convergence of health consciousness and environmental stewardship creates a powerful market force that transcends traditional demographic boundaries. These efforts are also enhancing brand reputation and fostering long-term customer loyalty among environmentally conscious consumers. For instance, in October 2023, Kimirica Organic launched its first plant-based Hydrating + Brightening Face Cream for dull and dehydrated skin. The product offers hydration and brightening.
Influence of social media and celebrity endorsement
Social media platforms have fundamentally altered how consumers discover, evaluate, and purchase facial care products, creating unprecedented influence over market dynamics. The Federal Trade Commission's examination of social media data from 2024 practices reveals that platforms collect extensive demographic information, user metrics, and shopping behaviors, enabling highly targeted advertising that drives consumer purchasing decisions. Research on behavioral advertising demonstrates that targeted advertisements increase purchase intentions compared to random products, though they often present offerings from smaller, less familiar vendors. This dynamic creates opportunities for emerging brands to gain market share through strategic social media positioning, while established companies must adapt their marketing strategies to maintain relevance. Celebrity equity deepened when Coty increased its stake in Kylie Cosmetics, proving that creator-led labels can command enterprise-level valuations. Brand value is thus migrating from traditional advertising to direct community engagement.
Technological innovations in product formulations
Formulation science is moving from empirical chemistry to molecular dermatology. Peptide complexes, such as Matrixyl and Argireline, retail for under USD 30 per unit through The Ordinary, demonstrating that clinical-grade actives can penetrate mass channels. Retinoid alternatives like bakuchiol deliver collagen stimulation with limited irritation according to peer-reviewed trials. Barrier repair follows the 3-1-1 lipid ratio, a model commercialized by CeraVe with dermatologist backing. The integration of research findings enables manufacturers to create more sophisticated skincare solutions. As a result, manufacturers are launching new product formulations in the market. For instance, in February 2025, the Nivea brand launched an advanced skincare segment with the launch of the Luminous Even Glow Range. The range includes a serum, night cream, day cream, and face wash. It features Thiamidol along with Salicylic Acid, Green Tea, and Hyaluronic Acid to help improve skin tone, hydration, and clarity. Advanced formulations allow companies to combine multiple skincare benefits in a single product, meeting consumer preferences for simplified routines.
Increasing demand for anti-aging products
Demographic shifts toward an aging population create sustained demand for anti-aging facial care products, supported by increased healthcare spending and longevity trends. The United States Census data projects that by 2030, 20% of the United States population will be aged 65 or older, with older adults outnumbering children under 18 by 2034. Anti-aging products benefit from scientific validation and clinical efficacy claims, differentiating them from general skincare offerings. Premium price tolerance rises when clinical data backs technology claims. The intersection of aging demographics with increased beauty consciousness among individuals creates a robust market foundation that extends beyond traditional cosmetic applications to include preventive skincare and dermatologically recommended treatments. In response, the Purple Pompa brand introduced an innovative skincare range in August 2024, focused on achieving age balance. The anti-aging products include creams, toners, and moisturizers. In addition, partnerships between cosmetic brands and dermatology clinics are expanding access to medically backed skincare, further driving consumer trust and adoption of anti-aging facial care solutions.
Restraints Impact Analysis of Facial Care Products Market*
| Restraint | (~) % Impact on CAGR Forecast | Geographic Relevance | Impact Timeline |
|---|---|---|---|
| Proliferation of counterfeit products | -0.3% | Global, with highest impact in emerging markets | Short term (≤ 2 years) |
| Health concerns over chemical ingredients | -0.2% | Global, particularly in regulated markets | Medium term (2-4 years) |
| Growing adoption of at-home skin treatment services | -0.4% | Developed markets, urban centers | Medium term (2-4 years) |
| Fluctuating raw material prices | -0.3% | Global, with supply chain dependencies | Short term (≤ 2 years) |
| Source: Mordor Intelligence | |||
Proliferation of counterfeit products
The counterfeit facial care products market threatens legitimate manufacturers and consumer safety, as government data indicates extensive illicit trade networks. These counterfeit products contain harmful ingredients and are manufactured in poor conditions, creating health risks and reducing consumer trust. The Department of Homeland Security reports that e-commerce growth has facilitated counterfeit product distribution, necessitating increased import monitoring and online platform oversight. The rapid expansion of online marketplaces has made it increasingly difficult for authorities to track and prevent the sale of counterfeit products. U.S. Customs seized USD 3.4 billion in counterfeit items in 2023, while EU authorities intercepted 86 million units, with cosmetics prominent in both tallies. Fake products can replicate authentic packaging and even batch codes, eroding brand equity when adverse reactions occur. LVMH addresses authenticity with Aura, a blockchain that tracks each unit from factory to point of sale.
Growing adoption of at-home skin treatment services
The growth of at-home skincare treatments and telehealth services affects traditional facial care product sales by providing alternative skin health management options. The Bureau of Labor Statistics forecasts 10% employment growth for skincare specialists from 2023 to 2033, due to increased consumer demand for professional treatments and mobile facial services. At-home devices covering LED therapy, micro-current, and ultrasonic infusion are forecast to rise by 2033, reducing spa visitation frequency. Professional operators now bundle in-clinic treatments with device-enabled upkeep programs. Brands supplying both service protocols and retail devices secure recurring revenue streams. The combination of professional expertise and convenient delivery methods competes with traditional facial care products. The availability of at-home treatment devices and professional-grade formulations reduces the distinction between consumer and professional markets.
*Our forecasts treat driver/restraint impacts as directional, not additive. The impact forecasts reflect baseline growth, mix effects, and variable interactions.
Facial Care Products Market Segment Analysis
By Product Type:
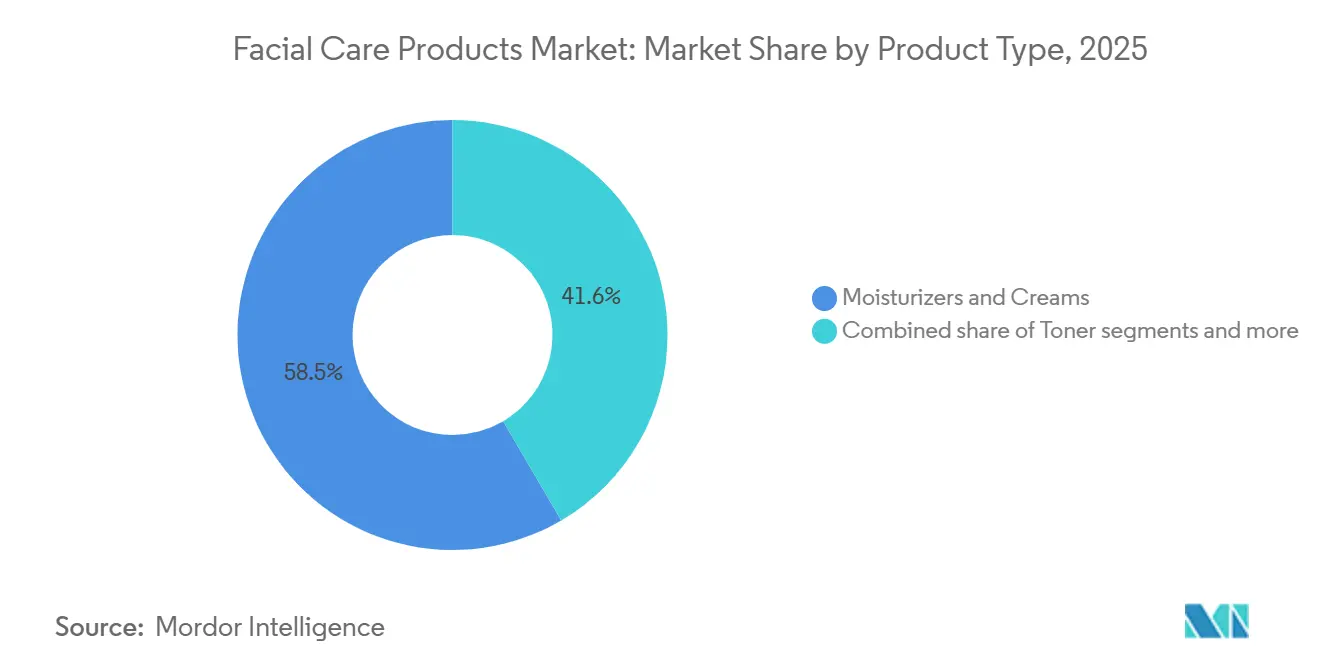
Toners Drive Multi-Step AdoptionMoisturizers and creams dominated 2025 revenue with 58.45%, reflecting their central role in maintaining the skin barrier. Toners will post a 6.78% CAGR through 2031, the highest within the facial care market, as multi-layer hydration routines originating in Korea become mainstream. The 7-skin method popularized the idea that toners can function as treatment vehicles rich in fermented filtrates, propelling sales of essence-toner hybrids. Exfoliating toners containing polyhydroxy acids expand addressability to sensitive-skin users. Cleansers undergo premiumization via oil-to-milk textures that avoid barrier disruption, while masks move from occasional indulgence to nightly sleep packs. Other formats, such as facial serums, benefit from targeted active delivery, commanding premium pricing.
The Bureau of Labor Statistics reports that personal care products experienced 1.0% price increases in March 2025, indicating inflationary pressures that may shift consumer preferences toward value-oriented formulations within each category[2]. Product type segmentation increasingly blurs as manufacturers develop hybrid formulations that combine cleansing, treatment, and moisturizing benefits in single products. This trend toward multifunctional products reflects consumer demand for simplified skincare routines without compromising skincare efficacy, creating opportunities for innovation across traditional category boundaries.

By Formulation:
Biotech Blurs Conventional–Natural DivideConventional products held a 68.24% share in 2025, yet natural and organic options will grow at a 6.89% CAGR. COSMOS sets a 95% natural origin threshold and bans GMOs and parabens, providing a harmonized framework for cross-border trade. Precision fermentation now yields hyaluronic acid and squalane at scale, enabling “naturally identical” positioning and lowering environmental impact. This market segmentation aligns with broader consumer trends, where health awareness, taste preferences, and environmental concerns drive organic product purchases across categories. To capitalize on this growing interest, manufacturers are revamping and expanding their product offerings by introducing a wide range of organic facial care products that contain plant-based, clean-label ingredients, with claims such as ‘organic’, ‘natural’, ‘chemical-free’, and ‘cruelty-free’.
The United States Food and Drug Administration's Modernization of Cosmetics Regulation Act strengthens ingredient oversight by requiring manufacturers to validate safety claims and maintain comprehensive records. This regulatory framework benefits natural ingredient suppliers with transparent sourcing and processing documentation, while creating additional compliance requirements for conventional formulations using synthetic compounds. The ingredient composition influences product positioning, as natural and organic products generate higher margins despite elevated production costs. Synthetic ingredients still offer cost and stability advantages. Phenoxyethanol remains a reliable preservative, and silicones give the desired slip. However, EU restrictions on microplastics and certain UV filters force even conventional brands to reformulate.
By Category:
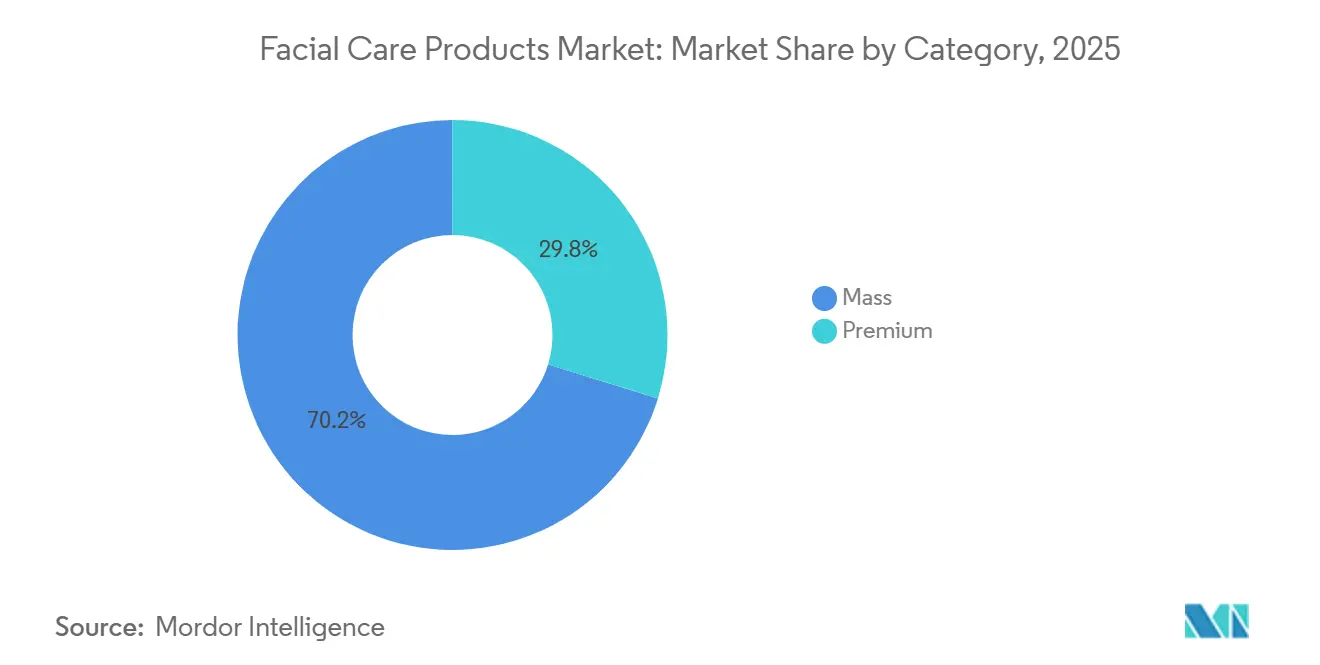
Masstige Collapses Price–Quality PerceptionMass products accounted for 70.22% of 2025 revenue, yet premium offerings will grow at a 7.36% CAGR. The Ordinary proved that transparent, high-concentration actives can retail below USD 10 without undermining credibility. CeraVe leverages dermatologist endorsements to straddle mass and prestige positioning. Premium brands respond by emphasizing patented technology and sensorial packaging. Estée Lauder prices Advanced Night Repair above USD 100 per ounce, substantiating the premium through Chronolux Power Signal research. This trend correlates with rising disposable incomes and growing health awareness among consumers. Additionally, the accessibility of premium products through e-commerce and specialty retailers is narrowing the gap between mass and premium facial care product offerings.
According to the Bureau of Labor Statistics, consumer spending on personal care products and services increased by 9.7% in 2023, indicating strong market demand across both segments[3]. Premium products gain momentum through advanced formulation technologies, supported by federal initiatives that enable the commercialization of innovative skincare solutions. Market success across both mass and premium segments increasingly relies on clinical evidence, ingredient disclosure, and eco-friendly packaging to meet consumer demands for transparency and environmental responsibility. Brands that align with wellness trends and offer multifunctional benefits are particularly well-positioned to capture evolving consumer preferences. Mid-tier labels risk squeeze as consumers polarize between affordable efficacy and experiential luxury. Strategies include vertical integration to lower the cost of goods or acquisition by conglomerates.
By Distribution Channel:
Social Commerce Rewrites RetailBeauty and health stores captured 48.21% revenue in 2025 thanks to experiential discovery, yet online retail will expand at a 7.53% CAGR to 2031. TikTok Shop converted short-form video engagement into USD 2.5 billion sales within its first year, showing how entertainment integrates with checkout. Instagram Shopping exposes 130 million users to product tags each month. Sephora and Ulta embed virtual try-on tools and buy-online-pick-up-in-store services to maintain relevance. Supermarkets and hypermarkets serve as convenient access points for regular purchases, while pharmacies and drug stores capitalize on their health-oriented positioning and professional guidance. Alternative distribution channels, such as subscription services, provide new routes to market outside traditional retail networks.
Distribution channels continue to adapt to retail trends that emphasize omnichannel experiences, where consumers conduct online research and make purchases across various platforms. The expansion of online retail creates market entry opportunities for new brands while prompting traditional retailers to strengthen their market position through customized services and unique product offerings. Moreover, the rise of social commerce and influencer-driven marketing is blurring the lines between content and commerce, enabling direct-to-consumer engagement and boosting conversion rates. Supermarkets lose share as shoppers research ingredients before purchase. Direct-to-consumer sites capture full margin and first-party data. Salons and spas offset slower service traffic by retailing professional-grade products, blending treatment and take-home regimens.
Geography Analysis
APAC Facial Care Products Market
Asia-Pacific generated 47.21% of 2025 revenue for the facial care market. Local brands fuse traditional medicine ingredients with modern textures, resonating with cultural identity. K-beauty exports reached USD 13.2 billion in 2023, with a national goal of USD 20 billion by 2030. Japan focuses on barrier science and UV protection, reflecting consumer preference for concise routines. ASEAN growth accelerates as mobile commerce penetrates secondary cities. The region's market position stems from robust manufacturing capabilities and domestic consumption patterns, with South Korea and Japan driving product innovation and beauty technology development. China's growing middle class provides significant market opportunities, while Southeast Asian markets show increased sophistication in product preferences and premium skincare adoption.
South America Facial Care Products Market
South America is forecast to expand at an 8.03% CAGR through 2031, the fastest regional pace in the facial care market. The region's expansion results from growing middle-class populations and shifting preferences toward premium personal care products. Brazil dominates regional demand with its large population and established beauty culture. The region leverages established supply chains for natural ingredients and manufacturing infrastructure that supports local market demand. Brazil ranks fourth globally in beauty spending led by Natura and O Boticário. Indigenous Amazonian oils and butters give local brands a clean-beauty narrative. ANVISA maintains EU-comparable safety protocols, supporting export ambitions.
EMEA, North America and APAC Facial Care Products Market
North America maintains a mature market characterized by consumer preferences for scientifically validated products and strong brand loyalty toward companies with established research capabilities. Europe focuses on sustainability and ingredient transparency, generating demand for natural and organic formulations that meet environmental regulations and consumer expectations. The region's aging population sustains anti-aging product demand, while younger consumers drive growth in multifunctional and technology-enhanced products. The Middle East and Africa offer growth opportunities due to young populations and increasing urbanization, though market development varies by country based on economic conditions and regulations. India’s Ayurvedic subcategory gains traction, though oversight remains separate from conventional cosmetic regulation under the Ministry of Ayush.
Regulatory Landscape
Facial care products face tightening ingredient and manufacturing oversight across major markets, raising the cost of global compliance and shortening the cycle for reformulation. In the European Union, the Cosmetics Regulation (EC) No 1223/2009 continues to be updated through Commission regulations, including Commission Regulation (EU) 2026/78 (with changes effective 1 May 2026) and Commission Regulation (EU) 2026/909 (published 28 April 2026), which amend annexes governing restricted/prohibited substances and conditions of use for specific ingredients.
In the United States, the FDA is implementing the Modernization of Cosmetics Regulation Act of 2022 (MoCRA), which strengthens expectations around safety substantiation, facility and product requirements, and records access, while final cosmetic GMP rulemaking remains a longer-term action. Many manufacturers reference ISO 22716 in the interim. Regulatory divergence also shows up in the United Kingdom, where 2026 amendments to cosmetics restrictions update ingredient prohibitions and labeling thresholds, while ASEAN markets pursue harmonization, including the Philippines FDA Circular No. 2026-0001 adopting consolidated amendments to the ASEAN Cosmetic Directive to align ingredient standards across member markets.
Competitive Landscape
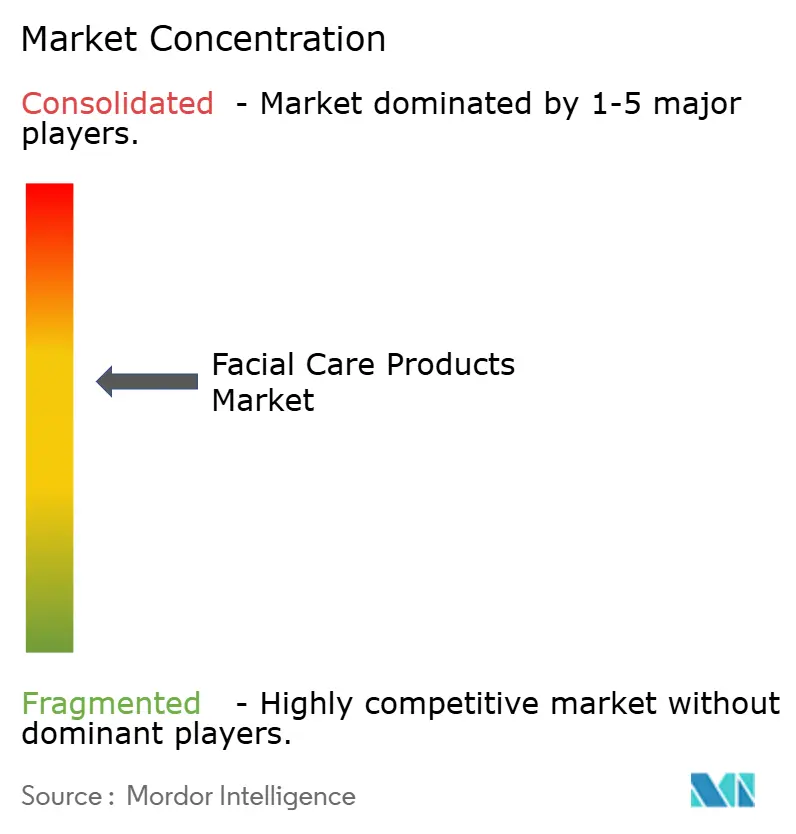
The facial care products market demonstrates moderate concentration, which enables both established companies and new entrants to capture market share through distinct strategies. Major players in the market include The Estée Lauder Companies Inc., L'Oréal SA, Shiseido Company Limited, Unilever PLC, and The Procter and Gamble Company, among others. Large multinational corporations maintain their market positions through scale advantages, robust distribution networks, and substantial research capabilities. Smaller companies compete effectively by focusing on niche segments, implementing direct-to-consumer business models, and developing specialized formulations for specific consumer requirements.
Companies in the market prioritize natural and organic product development, digital marketing initiatives, and integrated distribution strategies that serve customers across various channels. The industry's technological advancement centers on personalization systems, AR-based product testing, and consumer data analytics to improve customer relationships and loyalty. Key growth opportunities exist in sustainable packaging development, men's facial care segments, and age-targeted formulations. However, the market faces significant challenges from counterfeit products, emphasizing the need for product authentication systems and secure distribution methods.
New market entrants include biotech firms developing innovative ingredients, personalized subscription services, and digital platforms combining professional skincare advice with product suggestions. Success in the market increasingly depends on companies' ability to balance scientific validity with strong brand relationships, establishing lasting competitive advantages in this expanding market. The market is increasingly rewarding for companies successfully combining scientific credibility with brand connections, creating sustainable differentiation in an increasingly crowded marketplace.
Facial Care Products Industry Leaders
-
The Estée Lauder Companies Inc.
-
L'Oréal SA
-
Shiseido Company Limited
-
The Procter and Gamble Company
-
Unilever PLC
- *Disclaimer: Major Players sorted in no particular order
Facial Care Products Market Companies Covered in this Report
- L’Oréal SA
- Unilever PLC
- The Estée Lauder Companies Inc.
- Shiseido Company Limited
- Procter and Gamble Company
- Beiersdorf AG
- Johnson and Johnson Services Inc.
- Amorepacific Corporation
- Coty Inc.
- Natura & Co
- Groupe Clarins
- Kao Corporation
- LG Household & Health Care
- KOSÉ Corporation
- LVMH Moët Hennessy-Louis Vuitton
- Revlon Inc.
- Mary Kay Inc.
- Pierre Fabre Group
- Colgate-Palmolive Company
- Oriflame Cosmetics AG
Market Opportunities and Future Outlook
Scale-up of dermo-cosmetic and mass facial care production is creating room for faster regional rollouts and retailer-led exclusives, supported by specific capacity additions in Europe. Beiersdorf completed a EUR 300 million expansion of its Poznan, Poland production center in June 2025, doubling capacity to 500 million units annually for brands including Nivea and Eucerin, while Pierre Fabre announced a EUR 50 million investment in May 2026 to expand its Avène plant in France, targeting a doubling of production capacity from 100 million to 200 million units by 2029. These capacity projects raise the bar on supply reliability and shorten replenishment cycles for high-velocity facial SKUs, increasing the strategic value of localized manufacturing for brands selling across the EU and neighboring export corridors.
Personalization and clinical-style positioning are also strengthening premiumization within facial care routines, particularly through online-first channels where diagnosis and regimen-building can convert directly into baskets. In June 2026, Ludient launched in the United States with an AI-driven approach based on millions of skin data points, reflecting broader adoption of diagnostic-led skincare systems used by major players (for example, L'Oréal’s SkinConsult AI) to structure consumer journeys around measurable concerns such as dark spots, barrier repair, and wrinkle depth. In parallel, ingredient-led innovation is expanding addressable micro-segments (for example, regenerative and longevity-oriented actives), supported by peer-reviewed work on delivery systems including microneedle-assisted hyaluronic-acid tip dissolution for periorbital wrinkle applications, enabling more targeted facial treatments within the market scope (leave-on and wash-off facial formulations).
Recent Industry Developments in Facial Care Products Market
- July 2026: L'Oréal Paris launched a reformulated Revitalift Hyaluronic Acid & PDRN+ Anti-Wrinkle Plumping Serum, adding PDRN as a regenerative-oriented ingredient within a flagship anti-aging franchise. The update signals faster ingredient turnover in mass-premium facial serums as brands compete on newer bio-inspired actives and claim substantiation.
- June 2025: Beiersdorf completed a EUR 300 million expansion of its production center in Poznan, Poland, doubling annual manufacturing capacity to 500 million units to support skincare brands including Nivea and Eucerin. The added capacity strengthens supply resilience for core facial care formats such as creams and cleansers and supports broader multi-market rollout cadence.
- April 2024: Sisley Paris unveiled Neurae, a skincare line positioned around neuroscience and the skin-emotion link, targeting signs such as dullness, fatigue, and tension that can connect to premature aging narratives. The launch underscores premium differentiation through science-led storytelling and new claim territories beyond traditional anti-aging descriptors.
Facial Care Products Market Report Scope and Research Methodology
Market Definition and Coverage
This market covers retail sales value of products used mainly for facial skin care, including rinse-off and leave-on formats such as cleansers, toners, serums, moisturizers, masks, and exfoliants across major regions.
Scope exclusions: We exclude body care products, beauty devices, ingestible supplements, and professional in-clinic facial services from the market value.
Segments Covered in This Report
- Product Type
- Cleansers
- Masks
- Moisturizers and Creams
- Toner
- Other Product Types
- Formulation
- Conventional
- Natural/Organic
- Category
- Mass
- Premium
- Distribution Channel
- Supermarkets/Hypermarkets
- Beauty and Health Stores
- Online Retail Stores
- Others Distribution Channel
- Geography
- North America
- United States
- Canada
- Mexico
- Rest of North America
- Europe
- Germany
- United Kingdom
- Italy
- France
- Spain
- Netherlands
- Poland
- Belgium
- Sweden
- Rest of Europe
- Asia-Pacific
- China
- India
- Japan
- Australia
- Indonesia
- South Korea
- Thailand
- Singapore
- Rest of Asia-Pacific
- South America
- Brazil
- Argentina
- Colombia
- Chile
- Peru
- Rest of South America
- Middle East and Africa
- South Africa
- Saudi Arabia
- United Arab Emirates
- Nigeria
- Egypt
- Morocco
- Turkey
- Rest of Middle East and Africa
- North America
Data Sources, Market Sizing, and Validation
Desk Research
Desk work starts by grounding the model in public demand and supply signals that can be checked year over year. We mainly use official statistics and reference series such as UN Comtrade for trade flows, World Bank and IMF indicators for macro baselines, and OECD datasets where household spending cuts are needed for context.
To keep category definitions practical, we also review sources such as U.S. FDA cosmetic labeling guidance and EU Cosmetics Regulation pages, plus trade association materials that describe common product groupings and typical claims. Company filings, investor decks, earnings call notes, and reputable press interviews are then used to understand mix shifts like premiumization, channel expansion, and pricing behavior. Where available through internal subscriptions, we also consult a paid patent database and an import and export shipment-level database to sanity check innovation intensity and cross-border movement signals. These examples are not exhaustive, and many other public and paid sources are referenced for data collection, validation, and clarification.
Primary Interviews and Surveys
Primary work focuses on filling the gaps that public data cannot explain well, especially around category boundaries, channel splits, and price ladders. We speak with brand and private label teams, distributors, retailers, and industry consultants across key regions, and then we re-check assumptions when responses show unusual pricing, promotion depth, or demand shifts by format.
Distribution of primary research fieldwork respondents
| Company type | Respondent position | Region |
|---|---|---|
| Top tier: 33% | CXOs: 19% | APAC: 42% |
| Mid tier: 47% | Functional/Unit leaders: 30% | EMEA: 37% |
| Smaller Players: 20% | Managers: 51% | Americas: 21% |
Market-Sizing & Forecasting
We build the market using a top-down approach where consumer spend patterns and beauty and personal care category totals are reconstructed by region, and then filtered into facial-only care based on product mix evidence. Once that view is formed, the totals are corroborated with selective bottom-up checks such as sampled price per unit by format, retailer and distributor channel checks, and a light roll-up of reported category revenues for large participants.
Inputs used in the model include indicators such as per-capita personal care expenditure, inflation and currency timing for the base year, online penetration shifts, and pricing movement by key facial formats (cleansers, serums, moisturizers, and masks). We also track packaging and claim trends (for example, sensitive skin and anti-aging positioning) because they often signal mix upgrades that can move value faster than volume. Forecasting is done using scenario analysis supported by short-run smoothing on the historical series, and then adjusted based on what interviewees expect for promotion intensity, premium mix, and channel growth over the next few years. Where bottom-up signals are missing in smaller countries, gaps are handled using proxy ratios from comparable markets, followed by a re-check against regional totals so the roll-up remains consistent.
Data Validation & Update Cycle
Outputs are reviewed through multiple checks so the totals remain consistent with real-world signals. We compare modeled value growth against independent indicators like consumer spending direction, trade movement for key inputs and finished goods, and reported pricing behavior, and then we investigate large variances before sign-off.
A second analyst review is used to catch category overlaps, unexpected step changes, and currency conversion issues, and respondents may be re-contacted when assumptions move materially. Reports are refreshed annually, and interim updates are made when major events affect demand or pricing, followed by a final pre-delivery pass so clients receive the latest view.
Mordor Intelligence's Facial Care Products Market Size Measured Against Other Published Estimates
Published market sizes for facial care products can look far apart, even when the same end use is being discussed, because each publisher draws the boundary in its own way and chooses different base years. The timing of currency conversion, the way online-only sales are treated, and whether professional services are bundled in are also common reasons for the spread.
By tracking category boundaries and refresh timing, Mordor Intelligence keeps this estimate focused on retail facial care products only, which avoids inflating totals with in-clinic facials, devices, or adjacent body care that sometimes gets blended into a broader skin care number.
Benchmark comparison
| Source | Market Size | Gaps in Research Methodology |
|---|---|---|
| Mordor Intelligence | USD 138.74 B (2026) | |
| Trade Media Bulletin A | USD 116.62 B (2024) | Uses an earlier base year and a broader facial care definition that can include professional treatments and dermatology procedures, which changes what is counted as market value. |
| Industry Data Publisher B | USD 169.59 B (2024) | Appears to apply a wider product basket and a different value build that can lift totals, and it is less clear how retail pricing, channel weights, and currency timing are normalized across regions. |
The comparison mainly shows that year selection and scope decisions move the market number more than small modeling tweaks do. When the boundary stays limited to retail facial care products and the value build is tied back to visible spend and price signals, the final number is easier to trace and repeat during updates.
Key Questions Answered in the Report
How large is the facial care market in 2026?
The facial care market size stands at USD 138.74 billion in 2026 with a 6.22% CAGR outlook to 2031.
Which region records the fastest facial care growth?
South America leads with an 8.03% CAGR forecast, propelled by Brazil’s robust beauty spending and botanical formulations.
Which product segment is growing the quickest?
Toners post the fastest growth at a 6.78% CAGR as multi-step hydration routines gain global acceptance.
How are online channels impacting facial care sales?
Online retail, powered by social commerce on platforms like TikTok Shop, is projected to expand at 7.53% CAGR and capture share from beauty specialty stores.