
Face And Ear Bow Market Size and Share
Market Overview
| Study Period | 2020 - 2031 |
|---|---|
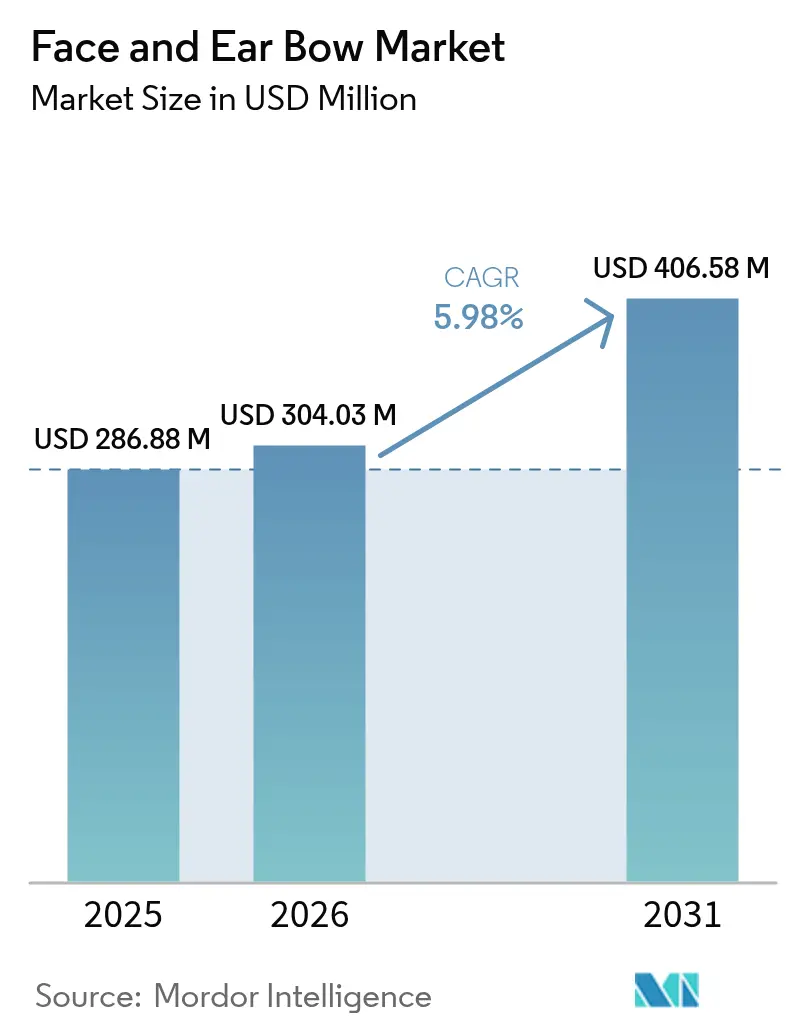
| Market Size (2026) | USD 304.03 Million |
| Market Size (2031) | USD 406.58 Million |
| Growth Rate (2026 - 2031) | 5.98 % |
| Fastest Growing Market | Asia Pacific |
| Largest Market | North America |
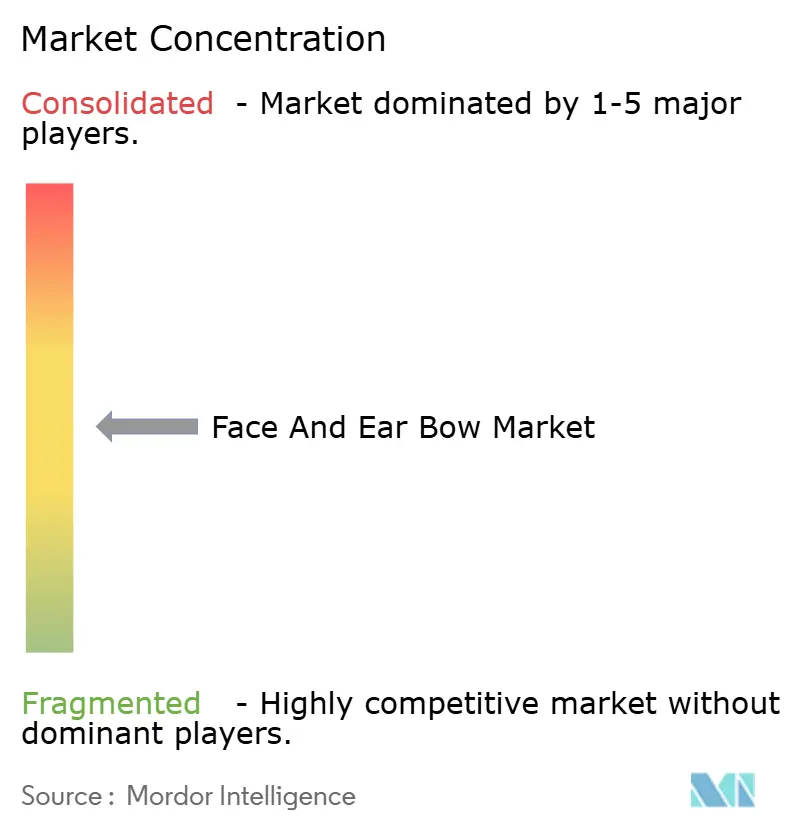
| Market Concentration | Medium |
Major Players *Disclaimer: Major Players sorted in no particular order Image © Mordor Intelligence. Reuse requires attribution under CC BY 4.0. | |
Face And Ear Bow Market Analysis by Mordor Intelligence
The face and ear bow market size was valued at USD 286.88 million in 2025 and estimated to grow from USD 304.03 million in 2026 to reach USD 406.58 million by 2031, at a CAGR of 5.98% during the forecast period (2026-2031). The expansion reflects a clear shift toward precision-driven prosthodontic workflows, wider adoption of virtual instrumentation that links directly with CAD-CAM systems, and rising demand for geriatric dental rehabilitation. Digital dentistry lowers chair-time, improves diagnostic repeatability, and broadens treatment indications, especially in full-arch restorations. Meanwhile, additive manufacturing cuts component costs and speeds customization, helping smaller practices access premium technology. Competitive rivalry intensifies as leading suppliers pursue integrated software-hardware suites and as AI-assisted occlusion mapping edges closer to chair-side use.
Key Report Takeaways
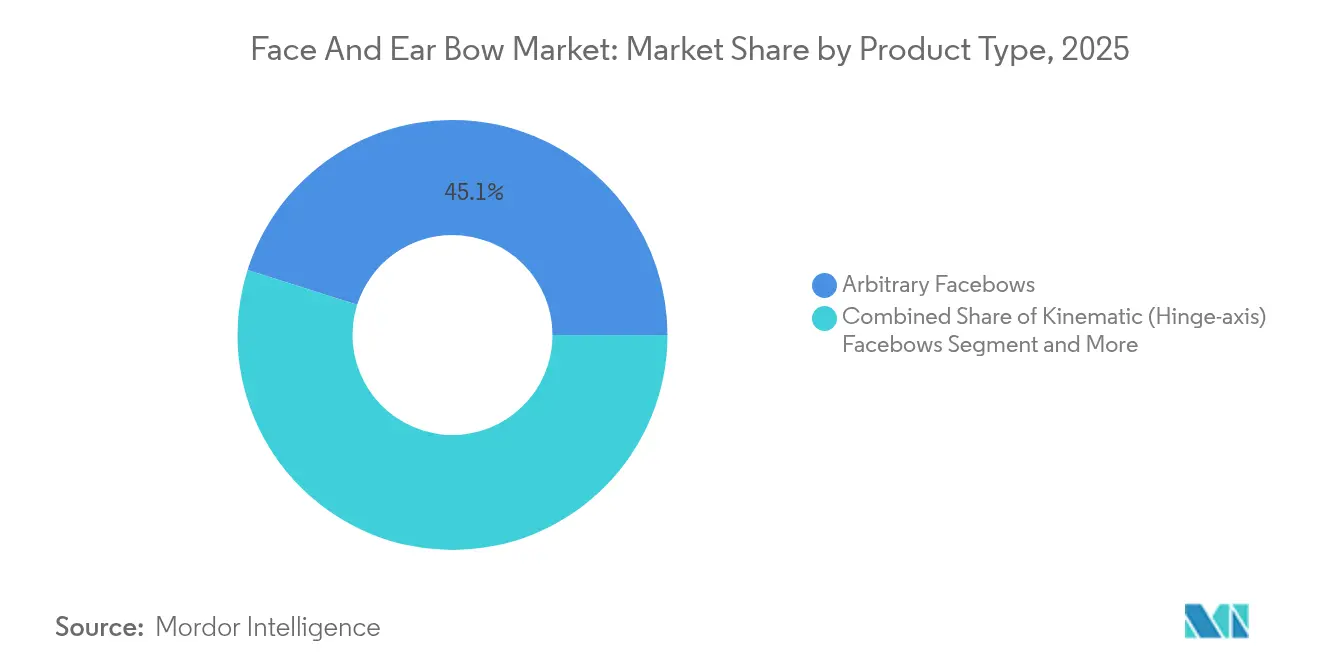
- By product type, Arbitrary Facebows led with 45.12% revenue share in 2025, whereas Digital/Virtual Facebows are projected to expand at a 12.24% CAGR to 2031.
- By material, Aluminum Alloys accounted for 37.10% share of the face and ear bow market size in 2025, while Titanium is set to advance at a 9.28% CAGR through 2031.
- By application, Prosthodontics held 51.78% of total revenue in 2025; Maxillofacial & Implant Surgery is forecast to register a 10.45% CAGR during 2026-2031.
- By end user, Dental Clinics commanded 41.66% share in 2025, whereas Dental Laboratories are on course for a 9.22% CAGR up to 2031.
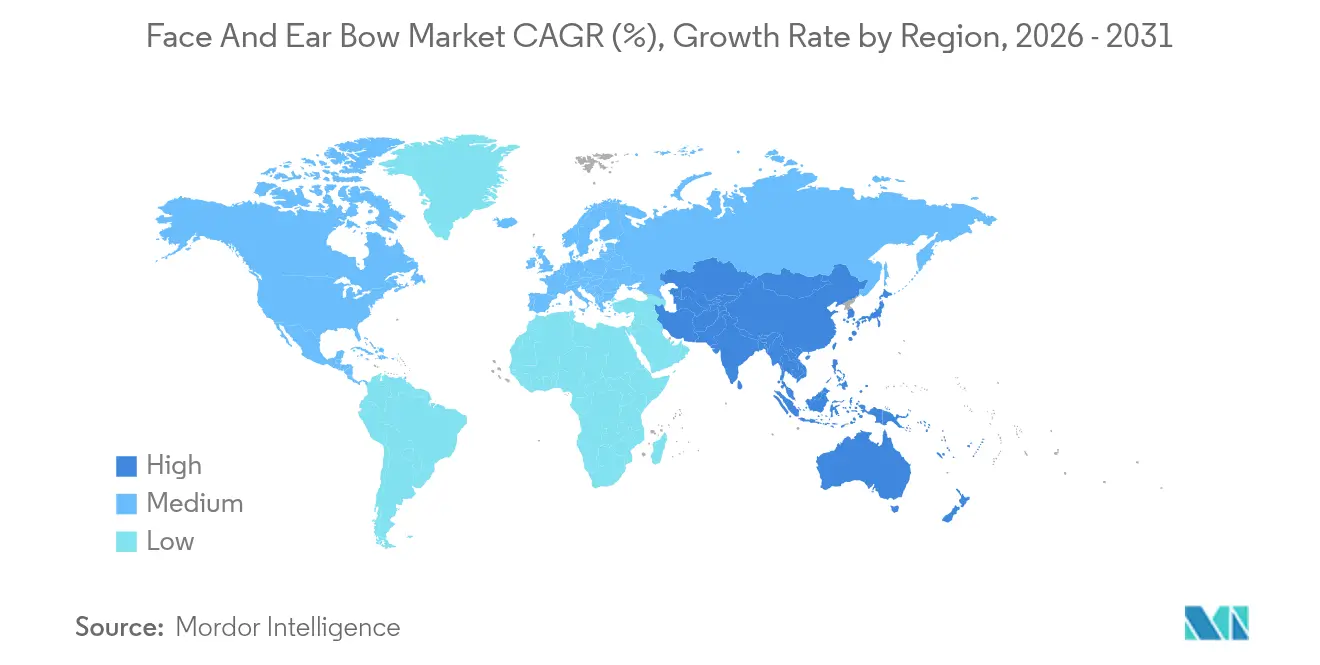
- By geography, North America contributed 34.40% of 2025 revenue; Asia-Pacific is expected to climb at an 8.51% CAGR through 2031.
Note: Market size and forecast figures in this report are generated using Mordor Intelligence’s proprietary estimation framework, updated with the latest available data and insights as of 2026.
Global Face And Ear Bow Market Trends and Insights
Drivers Impact Analysis*
| Driver | (~) % Impact on CAGR Forecast | Geographic Relevance | Impact Timeline |
|---|---|---|---|
| Rising prosthodontic procedures among ageing population | +1.8% | North America, Europe, East Asia | Long term (≥ 4 years) |
| Surge in cosmetic & orthodontic corrections | +1.2% | Global urban centers | Medium term (2-4 years) |
| Increasing oral-hygiene awareness campaigns | +0.9% | Asia-Pacific, Latin America, Middle East | Medium term (2-4 years) |
| Digital/Virtual Facebows enable chair-side CAD-CAM | +1.1% | Developed economies first | Short term (≤ 2 years) |
| Dental-tourism driven procedure volumes | +0.8% | Asia-Pacific, Latin America, Eastern Europe | Medium term (2-4 years) |
| 3-D printed custom facebow parts lower costs | +0.7% | Global manufacturing hubs | Short term (≤ 2 years) |
| Source: Mordor Intelligence | |||
Rising Prosthodontic Procedures Among Ageing Population
Rapid population ageing in most high-income nations is enlarging the pool of edentulous or partially dentate patients who require complex full-arch rehabilitations. Accurate transfer of the hinge-axis relationship with a facebow materially raises implant success, masticatory efficiency, and long-term comfort[1]Risako Taue et al., “Oral Function Status of Older Patients Seeking Dental Implant Treatment,” International Journal of Implant Dentistry, intjimplantdentistry.com. Public health agendas now frame oral function as central to healthy ageing, prompting insurers and policymakers to promote early restorative interventions. Academic curricula consequently reinforce facebow skills, while manufacturers roll out lighter frames and simplified clamps to serve geriatric ergonomics. Taken together, these forces transform the face and ear bow market by embedding precision recording into routine senior care.
Digital/Virtual Facebows Enable Chair-Side CAD-CAM
Virtual facebow systems integrate optical jaw-tracking sensors with intraoral scanners to generate 4D articulator positions in real time. The workflow merges directly into CAD platforms, eliminating mechanical indexing errors and cutting appointment counts by nearly 40%. Dentists report streamlined lab communication, faster remakes, and higher first-fit rates, especially when treating bilateral free-end saddles. Software updates push automatic condylar path simulation that aids TMJ diagnostics, further widening clinical uptake. Early adopters in Europe and the United States have driven a visible shift in purchasing decisions, anchoring digital options as the premium tier of the face and ear bow market.
Surge in Cosmetic & Orthodontic Corrections
Elective orthodontic demand, powered by clear aligners with mandibular advancement modules, calls for precise jaw orientation to harmonize smile arcs and facial symmetry[2]Advancing the Mandible While Aligning the Teeth, British Dental Journal, nature.com. Digital smile-design platforms frequently import facebow data to calibrate incisal edge position and occlusal plane angulation. Clinics focused on aesthetic treatments thus adopt hybrid workflows that combine virtual facebows with photo-realistic rendering, minimizing mid-course corrections. Marketing campaigns highlighting “facial harmony” heighten consumer expectations for functional as well as visual improvements, sustaining robust segment growth within the face and ear bow industry.
3-D Printed Custom Facebow Parts Lower Costs
Selective laser melting and resin-based printing now reproduce forks, condylar rods, and earpieces with dimensional accuracy below 60 µm. Labs print consumable components on demand, reducing stockholdings and allowing chair-side customization for patients with craniofacial asymmetry. Cost modelling shows 20-30% savings compared with machined aluminum alternatives, encouraging smaller practices in emerging markets to buy system shells and print accessories locally. Regulatory files submitted under FDA Class I exemptions smooth the pathway to mass adoption[3]Centers for Medicare & Medicaid Services, “42 CFR 410.24,” ecfr.gov.
Restraints Impact Analysis*
| Restraint | (~) % Impact on CAGR Forecast | Geographic Relevance | Impact Timeline |
|---|---|---|---|
| High device & accessory pricing | -0.9% | Emerging economies | Long term (≥ 4 years) |
| Limited reimbursement for dental prosthetics | -0.6% | North America, Europe | Long term (≥ 4 years) |
| Evidence questioning routine facebow need | -0.4% | Academic centers worldwide | Medium term (2-4 years) |
| AI occlusion-mapping scanners as substitutes | -0.3% | High-tech early adopters | Short term (≤ 2 years) |
| Source: Mordor Intelligence | |||
Limited Reimbursement for Dental Prosthetics
Most public and private payers classify prosthodontics as elective, leaving patients to cover the bulk of procedure costs. Out-of-pocket expenditure dampens demand for premium accessories, including titanium facebow kits or full digital solutions. In Europe, benefit caps and long waiting lists steer many seniors toward basic dentures without detailed jaw-relation transfer. Some insurers pilot outcome-based bundles that could eventually reimburse precision mounting when linked to reduced remake rates, yet momentum remains slow. Consequently, pricing pressure restrains full penetration of advanced systems within the face and ear bow market.
Evidence Questioning Routine Facebow Need
Several randomized studies suggest minimal occlusal differences when complete dentures are mounted with or without a facebow in straightforward cases. Thought leaders argue for selective use, reserving detailed articulation for full-mouth reconstructions or steep occlusal plane alterations. Dental schools increasingly teach streamlined methods alongside traditional techniques, creating practitioner ambiguity. While complex implant cases still rely on accurate hinge-axis transfer, the academic debate limits blanket adoption and nudges buyers toward mid-priced arbitrary systems rather than fully digital rigs.
*Our forecasts treat driver/restraint impacts as directional, not additive. The impact forecasts reflect baseline growth, mix effects, and variable interactions.
Segment Analysis
By Product Type: Digital Innovation Drives Market Evolution
In 2025, Arbitrary Facebows controlled the largest slice of the face and ear bow market share at 45.12%. Digital/Virtual Facebows, though smaller in starting base, are forecast to post a compelling 12.24% CAGR to 2031, outpacing every other device class. The rising preference mirrors clinics’ shift toward single-visit prosthetics and cloud-linked lab services. Meanwhile, Kinematic Facebows sustain a core presence in postgraduate programs and research centers, whereas Ear-Bows cater to orthognathic surgery where temporal bone references are essential.
Investments in motion-capture optics and AI-driven landmark detection have narrowed the cost gap between digital and mechanical alternatives, encouraging practitioners to trade up. Manufacturers bundle cloud licenses, articulator models, and online training to simplify onboarding. Accessories, including fork pans and orbital indicators, increasingly come in recyclable resin variants compatible with office printers, extending lifecycle value. As these trends coalesce, the face and ear bow market continues to pivot toward data-rich virtual instrumentation without entirely displacing reliable mechanical baselines.


By Material: Titanium Emerges as Premium Choice
Aluminum Alloys accounted for 37.10% revenue in 2025 and continue to anchor entry-level kits through ease of machining and familiar handling. Titanium components, although costlier, are projected to log a 9.28% CAGR, attracting high-end clinics seeking superior corrosion resistance and reduced patient allergenicity. Stainless Steel retains a foothold in budget-sensitive regions, while reinforced engineering plastics gain share in disposable accessories such as bite forks.
The face and ear bow market size for titanium assemblies is expected to widen as additive manufacturing cuts scrap rates and supports hollow-frame geometries that lower chairside fatigue. Cross-compatibility standards introduced by major articulator vendors encourage modular upgrades, allowing practices to add titanium forks to existing aluminum frames. Continuing education courses now highlight the biomechanical benefits of lightweight, high-yield alloys, raising practitioner comfort and futureproofing purchase decisions within the face and ear bow industry.
By Application: Maxillofacial Surgery Shows Rapid Expansion
Prosthodontics remained the dominant application, commanding 51.78% revenue in 2025, yet Maxillofacial & Implant Surgery is set to grow faster at 10.45% CAGR as multidisciplinary teams adopt precision positioning for osseous reconstructions. Orthodontics & Occlusal Analysis continues to benefit from aligner-driven demand and from broader interest in temporomandibular disorder prevention.
Surgeons now use virtual facebow data to pre-bend reconstruction plates and to calibrate navigation systems before entering the theatre. In prosthodontics, chair-side CAD-CAM crowns achieve tighter marginal fits when mounted on articulators aligned via real-time jaw tracking. Orthodontists rely on facebow-encoded virtual setups to simulate mandibular advancement and airway improvements. As a result, the face and ear bow market integrates seamlessly with emerging digital-surgical ecosystems that prioritize outcome predictability and inter-specialty collaboration.

By End User: Dental Laboratories Gain Momentum
Dental Clinics contributed the bulk of orders at 41.66% in 2025, reflecting direct patient encounters. Dental Laboratories, however, are projected to grow at 9.22% CAGR, bolstered by centralization of complex prosthetic workflows and scalable investment in high-precision hardware.
Labs increasingly request virtual facebow files embedded within intraoral scan packages to mill prostheses without stone models, sharpening turnaround times. Hospitals and surgical centers maintain stable demand as they upgrade to titanium kits for trauma and oncologic cases. These dynamics spread capital expenditure across the value chain and boost the overall face and ear bow market size by linking chair-side capture to off-site fabrication under a shared digital thread.
Geography Analysis
North America retained leadership with 34.40% of global revenue in 2025 thanks to mature insurance coverage for implant dentistry and deep penetration of chair-side CAD-CAM systems. Clinics across the United States and Canada continue migrating to virtual registries because large group practices favor standardized, evidence-based protocols that reduce remakes. Regional research grants foster prototypes that pair jaw-tracking sensors with AI occlusal simulators, sustaining technology leadership and brand loyalty in the face and ear bow market.
Europe follows a similar path, although adoption varies among national health systems. Germany, France, and the Nordics show high per-capita expenditure, whereas Southern Europe remains price-sensitive and leans on aluminum or stainless-steel kits. Tightened Medical Device Regulation (MDR) rules in 2025 push suppliers to invest in post-market surveillance, improving reliability across the face and ear bow industry. Cross-border dental tourism into Hungary, Croatia, and Spain supports volume growth as cost-competitive clinics advertise full-arch packages that include virtual articulation.
Asia-Pacific is the fastest-growing territory, expected to post an 8.51% CAGR. Healthcare modernization programs in China and India expand public dental insurance coverage, while private hospitals in Thailand and South Korea capitalize on inbound medical travel. The face and ear bow market size in the region widens further as local manufacturers offer 3-D printed accessories that comply with global standards but at lower price points. Government-led oral-health campaigns heighten functional-rehabilitation awareness among middle-income populations, channeling steady demand for precise jaw registration services.

Competitive Landscape
The competitive field is moderately fragmented, with roughly a dozen established brands vying alongside regional specialists. Solventum Corporation, Dentsply Sirona, and KaVo Kerr anchor the premium tier by integrating virtual facebow modules into broader digital-dentistry ecosystems. Solventum bundles cloud analytics that predict hinge-axis drift, while Dentsply Sirona offers hands-on certification via its global academy network.
Mid-sized firms such as Whip Mix, Panadent, and Amann Girrbach differentiate through articulator compatibility and robust service programs. Whip Mix leverages 3-D printing know-how to market fork blanks, enabling labs to customize bite surfaces in-house. Start-ups focus on AI occlusion scanners that could bypass mechanical devices for simple cases; however, regulatory clearance and clinical validation remain hurdles, safeguarding current revenue streams within the face and ear bow market.
Strategic alliances, including OEM agreements with scanner manufacturers, accelerate time-to-market for hybrid systems. Patent activity centers on sensor fusion algorithms that merge optical tracking and inertial measurement to improve resolution without patient motion artifacts. Given these developments, competitive intensity is likely to rise, though brand reputations built on measurement reliability continue to anchor purchasing decisions in the face and ear bow industry.
Face And Ear Bow Industry Leaders
Whipmix Store
Jensen Dental
Dentatus
Advance Dental Design Inc.
Shofu Inc.
- *Disclaimer: Major Players sorted in no particular order

Market Opportunities and Future Outlook
The clearest whitespace in the face and ear bow market sits at the interface between mechanical recording and fully digital virtual mounting. Clinics and laboratories are moving toward integrated 3D virtual patient workflows that combine intraoral scans, facial scanning, CBCT, and jaw-tracking to transfer maxillary position into virtual articulators. However, the market still lacks broadly adopted, cross-vendor protocols for reference planes (for example Frankfort horizontal vs axis-orbital) and for repeatable capture quality across different devices and operator techniques.
That gap creates room for suppliers to package validated protocols, training, and software workflows that reduce variability while staying compatible with legacy systems such as the Panadent Kois Dentofacial Analyzer and KaVo Arcus/Arcus EVO, which remain widely used in mixed analog-digital practices. A second opportunity centers on lower-cost customization and distributed manufacturing for accessories and patient-specific components. Evidence from prosthodontic digitization research points to additive manufacturing enabling low-cost, patient-specific face-bows and extraoral scan body systems that substitute conventional face-bow procedures in virtual mounting, aligning with the shift toward digital/virtual facebows. At the same time, comparative reproducibility work published in April 2026 on mechanical face-bows versus facial scanning and CBCT for maxillary position transfer highlights ongoing clinical scrutiny of accuracy and repeatability, pushing vendors to emphasize metrology, calibration routines, and audit trails, not just new hardware. As these validation efforts progress, offerings that combine validated digital transfer steps, chairside workflow ease, and lab-ready file standards can directly address remakes, rework, and inconsistent mountings.
Recent Industry Developments
- April 2026: Comparative prosthodontic research evaluated the reproducibility of mechanical face-bows versus facial scanning and CBCT approaches for transferring maxillary position into virtual workflows. The findings reinforced clinician focus on measurable accuracy and repeatability in digital mounting. This, in turn, is shaping procurement toward systems with stronger validation, calibration steps, and protocol support.
- July 2025: Align Technology introduced an Invisalign System configuration with mandibular advancement occlusal blocks for Class II cases in 10-16-year-olds, embedding more explicit jaw-relationship metrics into aligner planning. The update supports broader orthodontic adoption of quantified jaw orientation data. It also benefits adjacent recording and articulation tools used in complex occlusal analysis workflows.
- October 2024: HuFriedyGroup acquired SS White Dental, expanding its dental manufacturing footprint and restorative workflow portfolio. The combination strengthened scale and cross-selling leverage in instruments and restorative adjacencies that interact with prosthodontic and lab workflows. Those workflows include facebow-based mounting and jaw relation transfer used across common restorative and surgical pathways.


Research Methodology Framework and Report Scope
Market Definition and Coverage
This market is defined as the revenue generated from face bows and ear bows used in dental procedures to record jaw position and transfer it to articulators for treatment planning and restoration work, across the covered geographies.
Scope exclusions: We exclude general dental imaging devices, CAD-CAM systems as standalone products, and routine hand instruments that do not perform facebow or earbow transfer functions.
Segmentation Overview
- By Product Type
- Kinematic (Hinge-axis) Facebows
- Arbitrary Facebows
- Digital / Virtual Facebows
- Ear-Bows
- Accessories
- By Material
- Aluminum Alloys
- Stainless Steel
- Titanium
- Engineering Plastics & Composites
- By Application
- Prosthodontics
- Orthodontics & Occlusal Analysis
- Maxillofacial & Implant Surgery
- By End User
- Dental Laboratories
- Dental Clinics
- Hospitals & Surgical Centers
- Geography
- North America
- United States
- Canada
- Mexico
- Europe
- Germany
- United Kingdom
- France
- Italy
- Spain
- Rest of Europe
- Asia-Pacific
- China
- Japan
- India
- South Korea
- Australia
- Rest of Asia-Pacific
- Middle East and Africa
- GCC
- South Africa
- Rest of Middle East and Africa
- South America
- Brazil
- Argentina
- Rest of South America
- North America
Data Sources, Market Sizing, and Validation
Desk Research
Desk work starts by building the demand context for dental restorative and orthodontic procedures, and then mapping where face bows and ear bows are typically used in those workflows. Public sources help anchor the direction of the market, such as CDC oral health resources, NIH and NLM indexed clinical literature, and WHO oral health statistics.
To convert that context into a usable model, we also refer to sources such as the US FDA device databases for product classifications and recalls, UN Comtrade trade statistics for relevant instrument shipment signals, and patent databases to track technology shifts like digital and virtual facebow integrations. We then layer in company filings, investor presentations, and reputable dental association websites to check adoption language, pricing notes, and distribution patterns. These desk sources are not exhaustive, and many additional public and paid references were used for data collection, validation, and clarification.
Primary Interviews and Surveys
Primary interviews and surveys are used to confirm how often face bows and ear bows are used by procedure type, how purchasing decisions are made, and how pricing changes by channel and geography. We speak with a mix of manufacturers, distributors, dental lab professionals, and clinicians across major regions so the assumptions from desk research can be stress-tested against real buying behavior.
Distribution of primary research fieldwork respondents
| Company type | Respondent position | Region |
|---|---|---|
| Top tier: 28% | CXOs: 20% | APAC: 44% |
| Mid tier: 50% | Functional/Unit leaders: 31% | EMEA: 32% |
| Smaller Players: 22% | Managers: 49% | Americas: 24% |
Market-Sizing & Forecasting
The core sizing is built using a top-down approach where procedure volumes and dental service activity are translated into a realistic addressable demand pool for jaw registration and transfer steps, and then filtered by adoption of articulator-based workflows. Once the demand pool is formed, average selling price ranges are applied with adjustments for product mix (kinematic versus arbitrary systems, and accessory attach rates) and regional price differences.
To keep the totals practical, the outputs are then corroborated with selective bottom-up approximations, such as roll-ups from a sampled set of suppliers and distributors, channel checks on typical clinic and lab purchasing frequencies, and a simple ASP times volume sense-check. Inputs used in the model include restorative and prosthodontic procedure trends, dental clinic and lab density, adoption of digital dentistry that can shift usage patterns, replacement cycles for mechanical components, and import trends for dental instruments where relevant. For forecasting, scenario analysis is used around procedure growth and adoption rates, and the year-by-year path is smoothed using exponential smoothing so short-term spikes do not overstate the long-run trend. When coverage gaps show up in bottom-up checks, we fill them using conservative ranges tied back to the demand pool and validated interview ranges.
Data Validation & Update Cycle
Validation is done through multiple checks so the final numbers are not driven by one assumption. We compare modeled totals against independent signals, such as trade movement direction, procedure trend markers, and the implied per-clinic utilization, and then investigate any large variances before sign-off.
A second analyst reviews the key inputs, the math steps, and the reasonableness of regional splits, followed by a final pass that checks for unit consistency and currency timing. If a major variance is detected, respondents are re-contacted to confirm whether the shift is real or due to a scope mismatch. The report is refreshed annually, and interim updates are made when material events occur so clients receive a current view at the time of delivery.
Mordor Intelligence's Face and Ear Bow Market Size Compared With Other Published Estimates
Published market values for face bows and ear bows can differ a lot because each publisher draws the boundary in its own way and also chooses different input signals for demand and pricing. The year used as the anchor, the treatment of accessories, and the way regional pricing is converted to USD can all move the final number.
By tracking procedure-linked demand signals and refreshing the product-mix and currency timing assumptions, Mordor Intelligence keeps the face and ear bow estimate tied to usage in prosthodontic and related clinical workflows rather than broad dental instrument totals. Some estimates expand scope into adjacent dental devices or apply a single ASP uplift across regions without checking how clinics and labs actually buy, which can inflate the total in a small-ticket instrument category.
Benchmark comparison
| Source | Market Size | Gaps in Research Methodology |
|---|---|---|
| Mordor Intelligence | USD 304.03 M (2026) | |
| Industry Publisher A | USD 286.00 M (2025) | Uses a different base year and a longer horizon, and the scope description is narrower on product types, which can shift the counted accessory and premium system mix versus a broader workflow-based view. |
| Global Research Firm B | USD 0.20 B (2024) | Provides limited clarity on what is included, and the headline value appears sensitive to broad segmentation buckets and simplified regional averaging, which can undercount or overcount depending on whether accessories and replacement demand are captured. |
The table shows that most of the spread comes from scope boundaries and how the demand pool is constructed, not from small arithmetic differences. When the model is anchored to clear clinical usage steps, checked with price and mix ranges, and then reconciled with trade and channel reality checks, the output becomes easier to explain and repeat year after year.


Key Questions Answered in the Report
How big is the face and ear bow market in 2026?
The face and ear bow market size is valued at USD 304.03 million in 2026.
What is the expected growth rate through 2031?
Revenue is projected to grow at a 5.98% CAGR, reaching USD 406.58 million by 2031.
Which product category grows fastest?
Digital/Virtual Facebows are forecast to expand at a 12.24% CAGR owing to CAD-CAM integration.
Which material gains the most traction?
Titanium components post the strongest momentum with a 9.28% CAGR due to superior biocompatibility.
Which region offers the highest growth potential?
Asia-Pacific leads future expansion with an 8.51% CAGR, supported by dental tourism and healthcare investment.
What restrains broader adoption?
Limited reimbursement for precision prosthodontics and high device pricing continue to restrict uptake.
Page last updated on:


 Your data is secure and never sold or shared.


