
Eye Tracking Solutions Market Size and Share
Market Overview
| Study Period | 2022 - 2031 |
|---|---|
| Market Size (2026) | USD 1.87 Billion |
| Market Size (2031) | USD 6.75 Billion |
| Growth Rate (2026 - 2031) | 29.20 % |
| Fastest Growing Market | Asia-Pacific |
| Largest Market | North America |
| Market Concentration | Medium |
Major Players *Disclaimer: Major Players sorted in no particular order Image © Mordor Intelligence. Reuse requires attribution under CC BY 4.0. | |
Eye Tracking Solutions Market Analysis by Mordor Intelligence
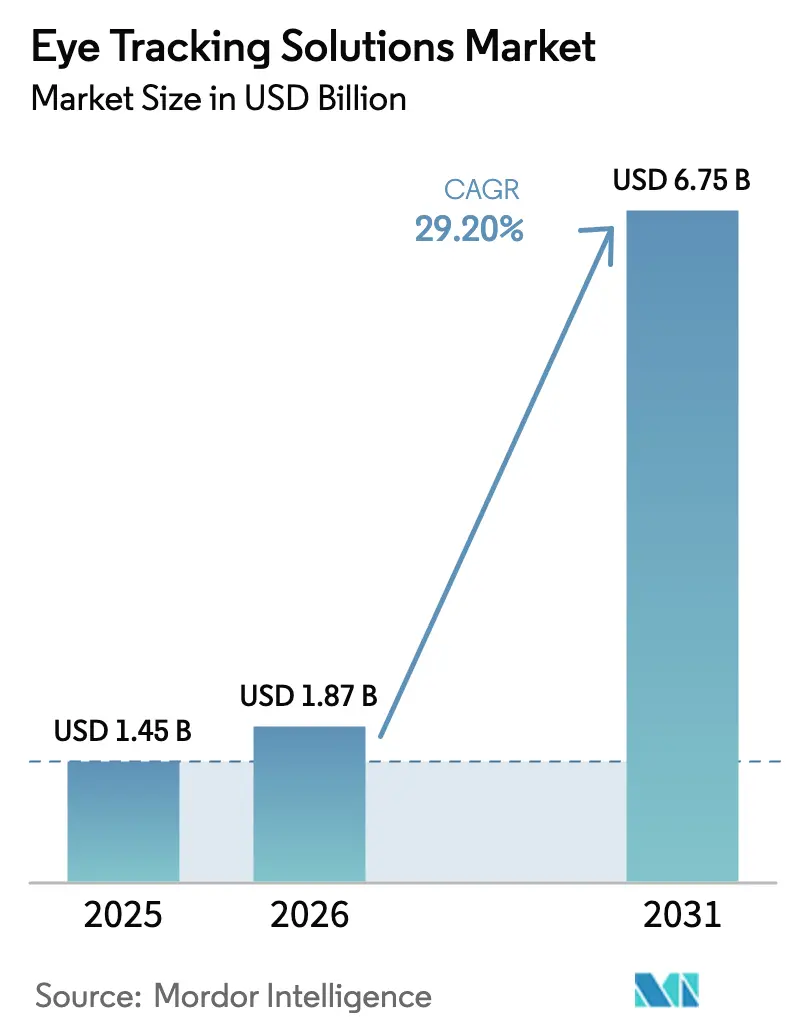
The eye-tracking solutions market size is expected to grow from USD 1.45 billion in 2025 to USD 1.87 billion in 2026 and is forecast to reach USD 6.75 billion by 2031 at 29.2% CAGR over 2026-2031. The surge is underpinned by mandatory in-cabin safety rules in Europe and China, the quest for foveated rendering in virtual and augmented reality headsets, and broader adoption in retail analytics and healthcare assessment. Hardware remains essential because cameras, processors and infrared illumination still deliver superior accuracy, yet software is becoming the primary lever for differentiation as cloud analytics and low-friction SDKs lower entry barriers. Automotive regulations force global carmakers to embed driver monitoring systems, while the gaming industry is quickly normalizing gaze-based interaction. Venture financing continues to reward power-efficient sensors and neuromorphic designs, leading to rapid product cycles and industry consolidation.
Key Report Takeaways
- By solution, hardware held 67.40% of the eye tracking solutions market share in 2025, while software is projected to compound at 29.7% through 2031.
- By tracking type, the remote/desktop segment controlled 51.30% of the eye tracking solutions market size for tracking devices in 2025, whereas eye-attached electrooculography is advancing at 31.1% CAGR.
- By application, driver monitoring and automotive safety captured 27.40% revenue in 2025; AR/VR and gaming is forecast to expand at 32.5% CAGR to 2031.
- By end-user industry, healthcare and research labs represented 24.60% of the eye tracking solutions market size in 2025, while automotive and transportation is registering the highest 29.8% CAGR.
- By geography, North America led with 47.50% of the eye tracking solutions market in 2025; Asia-Pacific is on track for a 30.4% CAGR through 2031.
Note: Market size and forecast figures in this report are generated using Mordor Intelligence’s proprietary estimation framework, updated with the latest available data and insights as of 2026.
Global Eye Tracking Solutions Market Trends and Insights
Drivers Impact Analysis*
| Driver | (~) % Impact on CAGR Forecast | Geographic Relevance | Impact Timeline |
|---|---|---|---|
| Mandatory EU-GSR integration of driver-monitoring cameras | +8.5% | Europe, spillover to North America and Asia-Pacific | Medium term (2-4 years) |
| VR/AR headset OEM demand for foveated rendering efficiency | +7.2% | Global, concentrated in North America and Asia-Pacific | Short term (≤ 2 years) |
| Retail eye-tracking becoming de-facto standard for shelf testing | +4.8% | North America, expanding to Europe | Medium term (2-4 years) |
| In-cockpit DMS retrofits driven by Chinese safety regulations | +6.1% | Asia-Pacific core, spillover to global OEMs | Short term (≤ 2 years) |
| Low-friction SDKs accelerating app developer adoption | +5.3% | Global, led by North America and Europe | Long term (≥ 4 years) |
| Big Tech spending on neuroscience-based UX testing | +3.9% | North America, expanding to Europe and Asia | Medium term (2-4 years) |
| Source: Mordor Intelligence | |||
Mandatory EU-GSR Integration of Driver-Monitoring Cameras
The EU General Safety Regulation requires all new vehicles sold from July 2024 to include camera-based driver drowsiness and attention warning, followed by advanced distraction warning from July 2026 . Automakers therefore treat eye tracking as foundational, standardizing a single driver monitoring platform across regions to achieve scale benefits. Euro NCAP’s Vision 2030 roadmap turns compliance into a competitive metric, compelling additional investment beyond minimum thresholds.Hardware demand spikes for automotive-grade VCSEL arrays such as ams OSRAM’s TARA2000-AUT, driving volume production of eye-safe infrared emitters.[1]
VR/AR Headset OEM Demand for Foveated Rendering Efficiency
Headset makers deploy eye tracking to concentrate GPU resources on the foveal region, slashing pixel budgets without perceptible quality loss; academic work shows up to 25x acceleration in ray-traced scenes.[2] Apple’s Vision Pro mainstreamed gaze-based navigation, triggering competitive responses from Meta and HTC. Concurrently, OEMs must address biometric privacy constraints under GDPR and similar laws, leading to on-device preprocessing and encryption of gaze vectors. Patent filings covering terahertz sensing and heart-rate extraction from eye cameras foreshadow convergence between gaze interaction and broader physiological monitoring.
Retail Eye-Tracking Becoming De-Facto Standard for Shelf Testing
Large North American retailers treat gaze analytics as a baseline tool for planogram validation, replacing lengthy A/B store trials with rapid, high-resolution attention data. Multi-camera depth reconstruction enables anonymous skeleton mapping while still capturing precise dwell-time statistics . SaaS dashboards merge eye tracking with POS and loyalty databases, letting merchandisers correlate attention with conversion. The emergence of smartphone-based eye tracking—now approaching commercial infrared accuracy thanks to far-red spectrum filtering—removes the need for dedicated kiosks.
In-Cockpit DMS Retrofits Driven by Chinese Safety Regulations
China's implementation of GB/T 41797-2022 standards has created a substantial retrofit market for driver monitoring systems in existing vehicle fleets, particularly in commercial transportation and ride-sharing sectors. The standard mandates 95% detection accuracy for driver attention monitoring, eye closure detection, and abnormal head pose identification, establishing performance benchmarks that exceed many existing automotive eye-tracking implementations. China's New Car Assessment Program for 2024 introduces safety ratings specifically focused on driver monitoring and in-cabin systems, creating market incentives for advanced eye-tracking integration beyond regulatory minimums.
Restraints Impact Analysis*
| Restraint | (~) % Impact on CAGR Forecast | Geographic Relevance | Impact Timeline |
|---|---|---|---|
| Accuracy loss from dark-iris populations limiting Asia-Pacific roll-outs | - 4.2% | Asia-Pacific, especially East Asia | Medium term (2-4 years) |
| High BOM cost of active illumination in automotive-grade modules | - 3.8% | Global, most acute in cost-sensitive markets | Short term (≤ 2 years) |
| GDPR constraints on gaze-data retention | - 2.9% | Europe, influencing global frameworks | Long term (≥ 4 years) |
| Limited battery life for mobile eye-tracking glasses | - 2.1% | Global wearables segment | Medium term (2-4 years) |
| Source: Mordor Intelligence | |||
Accuracy Loss from Dark-Iris Populations Limiting APAC Roll-Outs
Controlled studies report lower precision for Asian participants because darker irises reduce contrast, while average pupil size variations complicate thresholding in infrared imagery. Smartphone-based pupillometry mitigates the contrast gap by shifting to far-red wavelengths, but full parity still demands ethnicity-adaptive models. Compliance with ISO/IEC 19795-10 forces vendors to publish performance by demographic cohort, elevating algorithm transparency.[3] Until algorithms and optics mature, large-scale deployments in East Asia may progress more slowly than regulatory momentum would otherwise imply.
High BOM Cost of Active Illumination in Automotive-Grade Modules
Automotive VCSEL arrays must survive −40 °C to +85 °C and conform to AEC-Q and ISO 26262, inflating unit prices compared with consumer parts. Apple’s supplier realignment intensified price volatility across the infrared stack, exemplified by Lumentum’s workforce reduction and Coherent’s UK fab sale. Although multi-junction VCSELs boost efficiency, they require expensive epitaxial processes, keeping material cost elevated. Integrated illumination-sensor modules promise longer-run savings but need high initial capital, slowing OEM adoption in cost-sensitive vehicle segments.
*Our forecasts treat driver/restraint impacts as directional, not additive. The impact forecasts reflect baseline growth, mix effects, and variable interactions.
Segment Analysis
By Solution: Hardware Dominance Faces Software Disruption
Hardware contributed USD 0.98 billion to the eye-tracking solutions market size in 2025 and retained a 67.40% share in 2025, well ahead of software. Cameras, optics, and dedicated inference ASICs remain indispensable when vehicle safety certifications or VR latency budgets leave no room for compromise. Illuminators are the fastest-growing hardware line as driver monitoring systems adopt dual-VCSEL arrays for redundancy, especially in premium vehicle trims. Suppliers emphasize long-term supply guarantees to de-risk OEM production cycles, deepening entry barriers for new entrants.
The software segment is scaling faster at 29.7% CAGR. SDK subscription models generate recurring revenue and let smaller developers extend gaze interaction to apps without building custom optics. Tobii’s Nexus framework typifies the shift from unit sales to platform economics, offering analytics dashboards and A/B testing modules within the same licence. As hardware components head toward commoditisation, refined algorithms, data pipelines, and cloud security controls become decisive levers in sustaining pricing power inside the eye-tracking solutions market.


By Tracking Type: Remote Systems Lead Despite Wearable Innovation
Remote or desktop configurations captured 51.30% of the eye tracking solutions market share in 2025, owing to entrenched use in academic labs and consumer research. These systems benefit from controlled lighting and fixed head positions, reducing algorithmic complexity and total cost of ownership for first-time adopters. Head-mounted trackers remain pivotal for VR immersion and in-cabin automotive functions, but ergonomic limits and battery constraints temper growth outside niche segments.
Eye-attached electrooculography is the emerging wildcard. Demonstrations such as ElectraSight’s 7.75 mW prototype underscore the viability of day-long operation on a smartwatch-class battery arxiv.org. When paired with neuromorphic event cameras, these sensors deliver microsecond latency, unlocking real-time mixed-reality overlays. ODMs foresee premium pricing for wellness metrics layered onto gaze data, suggesting that wearable EOG could challenge camera-centric architectures in future iterations of the eye tracking solutions market.
By Application: Automotive Safety Drives Current Demand
Driver monitoring and automotive safety generated the largest revenue slice at 27.40% in 2025 as regulators anchor eye tracking inside every new vehicle platform. Suppliers enjoy a predictable design-in cycle aligning with the five-to-seven-year automotive platform cadence, translating to annuity-like orders once design wins crystallize. Cost reduction remains a parallel imperative because Tier-1 suppliers must address mass-market vehicle trims to hit volume.
Conversely, AR/VR and gaming accelerate at a 32.5% CAGR, reinforcing the sector’s transition from early adopters to mainstream entertainment. Eye-based menu navigation and dynamic foveated rendering extend battery life and widen the addressable user base. Game studios explore gaze-driven adaptive difficulty and advertising revenue streams, creating incremental software attach opportunities. These vectors signal that the eye-tracking solutions market will rely increasingly on diversified revenue templates beyond automotive.

By End-User Industry: Healthcare Leads While Automotive Accelerates
Healthcare and research labs represented 24.60% of 2025 revenue, underlining the indispensable role of gaze metrics in cognitive assessment, concussion screening, and assistive communication. Clinical device makers integrate smartphone-grade cameras and cloud analytics to conduct large-scale neurological screening outside hospital settings, which democratizes access and lifts unit volumes.
Automotive and transportation exhibit the steepest slope at 29.8% CAGR. China’s GB/T 41797-2022 and Euro NCAP are synchronizing global demand curves, and commercial fleet operators deploy aftermarket kits to meet insurance and compliance mandates. The spillover into public transport creates a second growth vector as transport authorities trial attention monitoring for city bus drivers. The dual-track growth in clinical and automotive arenas stabilizes risk-return profiles for diversified suppliers within the eye-tracking solutions market.
Geography Analysis
North America maintained 47.50% revenue dominance in 2025, driven by Silicon Valley investment, an expansive VR gaming ecosystem, and a retail sector willing to fund advanced merchandising analytics. The United States remains pivotal as Tier-1 automotive suppliers co-locate R&D centers near Detroit and West Coast tech hubs. Canada leverages public research grants to commercialize clinical eye-tracking protocols, while Mexico’s OEM plants integrate driver monitoring modules destined for export markets.
Europe’s trajectory rests heavily on regulation. The impending 2026 deadline for advanced distraction warning cements volume for camera makers and software vendors. Germany’s carmakers absorb early component premiums to secure five-star safety ratings, while Nordic healthcare systems pilot gaze-driven rehabilitation programs. As GDPR restrictions sharpen, European providers pioneer on-edge data minimization architectures, influencing global privacy blueprints.
Asia-Pacific is the fastest riser at 30.4% CAGR. China’s 95% driver-attention accuracy mandate accelerates fleet retrofits and standardizes performance benchmarks . Japan’s automotive Tier-1s collaborate with AI start-ups to embed gaze analytics into Level-3 autonomous platforms, evidenced by BLUESKEYE AI’s simulator rollout. South Korea taps its smartphone and display manufacturing base to explore eye tracking in foldable devices, whereas India’s volume opportunity depends on low-cost optical stacks and cloud subsidies. These dynamics underscore divergent regional strategies yet collectively reinforce global revenue expansion for the eye tracking solutions market.
Mordor Intelligence provides coverage of the eye tracking solutions market across other key regional markets, including Europe and North America, each with their regulatory frameworks and demand patterns.

Regulatory Landscape
Regulation is a key demand driver for automotive eye tracking through mandated in-cabin monitoring. In Europe, the EU General Safety Regulation (GSR) requires camera-based driver drowsiness and attention warning for new vehicles from July 2024, followed by advanced distraction warning from July 2026. This timeline pushes OEMs and Tier-1s to standardize driver monitoring system (DMS) architectures and validate performance across vehicle programs. In China, GB/T 41797-2022 sets explicit performance benchmarks for driver attention monitoring, including eye-closure and head-pose related requirements, supporting a compliance-driven pull for automotive-grade eye tracking in both retrofits and new installations.
In healthcare, eye-tracking functionality used for clinical assessment or diagnosis must align with medical-device rules and documentation expectations. In the United States, FDA classification under 21 CFR 882.1455 (traumatic brain injury eye movement assessment aid) establishes Class II requirements such as software validation and light hazard assessment, while in Europe the EU Medical Device Regulation (EU 2017/745) enforces risk management, clinical evaluation, and post-market surveillance for medical-use devices. For AR/VR, retail analytics, and other non-medical uses, GDPR constraints on gaze data retention and processing shape deployment architectures toward data minimization and on-device processing. Optical radiation safety requirements also affect illuminator design and integration for eye-safe operation.
Value Chain Analysis
The eye-tracking solutions value chain begins with component supply for cameras and sensors, optics, processors and ASICs, and infrared illumination, then moves to module integration (mechanical and optical packaging, calibration, and automotive-grade qualification). Upstream suppliers of active illumination (IR LEDs and VCSELs) and image sensors act as major cost and availability drivers, especially for automotive-grade modules where qualification standards and temperature ranges raise BOM costs and extend sourcing cycles. Midstream integrators and technology vendors convert these parts into eye-tracking modules and perception stacks, then support Tier-1s and OEMs through in-cabin integration, validation, and homologation.
Downstream, differentiation has shifted toward software, including SDKs, embedded runtime, and cloud analytics that turn gaze vectors into driver state, user interaction, or attention insights for retail and research users. Vendors such as Tobii and Seeing Machines function as technology partners to Tier-1s and OEMs, often providing hardware-agnostic algorithms, reference designs, and licensing models that convert design wins into recurring royalties once vehicles or fleets enter production. Service layers, including installation, fleet enablement, dashboards, and ongoing compliance documentation in regulated use cases, also increase switching costs, particularly where customers require validated performance, demographic reporting, and privacy-by-design controls.
Competitive Landscape
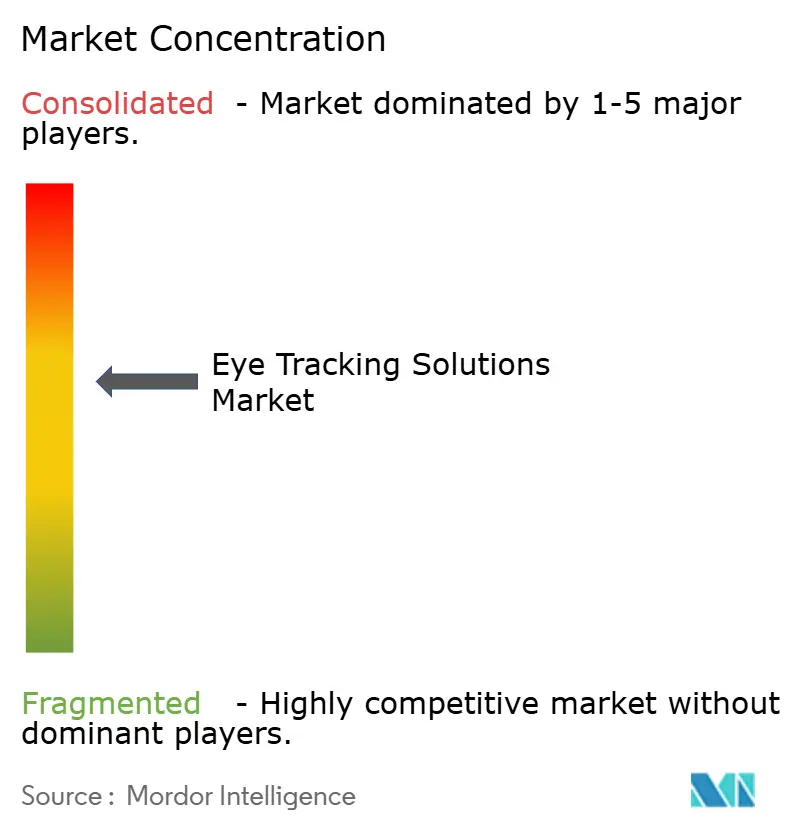
The competitive environment is moderately fragmented. Incumbents such as Tobii, Seeing Machines and Smart Eye defend share via vertical integration that bundles optical hardware, proprietary algorithms and cloud dashboards. Tobii’s Q3 2024 margin recovery to 80% indicates success in licensing and cost discipline despite a temporary 6% organic decline. Smart Eye, buoyed by 322 cumulative automotive design wins worth SEK 7.5 billion (USD 699 million), targets positive operating cash flow by mid-2025.
Industry consolidation gained pace when TDK acquired SoftEye for USD 100 million, signalling a pivot toward integrated smart-glasses platforms that merge optics, silicon and perception software . Component specialists respond by shrinking power budgets; Prophesee’s event camera integrates with Tobii’s gaze stack to deliver sub-2 mW solutions for always-on wearables. Patent activity indicates a shift to multi-modal biometrics: Meta’s filings combine terahertz eye tracking with heart-rate sensing, aiming to lock users into proprietary wellness ecosystems.
Eye Tracking Solutions Industry Leaders
-
Tobii AB
-
SR Research Ltd.
-
EyeTech Digital Systems Inc.
-
Seeing Machines Ltd.
-
Ergoneers GmbH
- *Disclaimer: Major Players sorted in no particular order
Market Opportunities and Future Outlook
Automotive DMS is the clearest commercial scaling lane because it is supported by regulation, fleet economics, and platform-level design cycles. As of May 2026, Seeing Machines reported its technology deployed in over 6 million vehicles, and the company also disclosed a 122% quarter-on-quarter increase in units produced in Q3 FY2026, indicating accelerating industrialization for in-cabin monitoring programs. Tobii added momentum through automotive commercialization actions, including a DMS design win with a European premium sports car OEM entering production in 2026 and a separate commercial vehicle platform program slated for a 2028 launch. Tobii also secured a DMS licensing agreement with a major automotive supplier, contributing to revenue timing across Q4 2025 and H1 2026.
A second opportunity area is the move from one-time device sales toward platform and licensing economics in enterprise and research workflows, where SDK subscriptions, analytics dashboards, and workflow integration are increasingly central to purchasing decisions compared with standalone trackers. This shift aligns with privacy and safety constraints (GDPR, optical radiation safety, and medical-device requirements), which favor validated and auditable solutions and create whitespace for vendors that can package compliant on-device processing, secure data pipelines, and human-factors validation tooling. Beyond automotive and clinical assessment, attention computing use cases are also expanding into robotics and AI-enabled systems where gaze and intent signals can support operator safety and human-machine interaction, creating additional software attach and integration services within the broader eye-tracking value chain.
Recent Industry Developments
- May 2026: Seeing Machines received a USD 3.8 million purchase order for its Guardian Backup-driver Monitoring System (BdMS) from a North American autonomous driving company. The order extends driver state monitoring beyond conventional fleets into autonomy development and validation environments. It also reinforces commercial traction for turnkey monitoring packages that combine in-cabin sensing, algorithms, and operational workflows.
- November 2025: Seeing Machines launched Guardian Generation 3 with an attention-sharing feature for commercial fleet customers. The capability adds a software-led differentiator by embedding safety workflows into day-to-day operations. It also supports deeper customer lock-in by tying analytics and alerts to fleet management processes.
- June 2025: SR Research released EyeLink 3, combining screen-based eye tracking with 6-degrees-of-freedom head tracking for research use cases. The product broadens experimental design options in neuroscience and human factors by enabling more naturalistic participant movement while maintaining controlled measurement. It also raises the performance bar for lab-grade systems, influencing upgrade cycles in academic and clinical research environments.
Research Methodology Framework and Report Scope
Market Definition and Coverage
This market covers revenues earned from eye tracking solutions that capture gaze and eye movement and convert them into usable outputs for applications such as research, assistive use, driver monitoring, and AR or VR interactions, across global end users.
Scope exclusions: It excludes general purpose cameras and displays that are not sold with eye tracking functionality, along with purely clinical ophthalmic treatment devices that do not perform gaze tracking.
Segmentation Overview
- By Solution
- Hardware
- Cameras and Optics
- Processors and ASICs
- Illuminators (IR LEDs/Laser)
- Software
- Software SDK and Analytics
- Hardware
- By Tracking Type
- Remote/Desktop
- Head-Mounted
- Eye-Attached (Electro-oculography)
- Mobile/Embedded
- By Application
- Assistive Communication and AAC
- Driver Monitoring and Automotive Safety
- AR/VR and Gaming
- Consumer and Neuromarketing Research
- Academic and Clinical Research
- By End-User Industry
- Automotive and Transportation
- Consumer Electronics
- Healthcare and Research Labs
- Retail and Advertisement
- Aerospace and Defense
- Media and Entertainment
- Others
- By Geography
- North America
- United States
- Canada
- Mexico
- South America
- Brazil
- Argentina
- Rest of South America
- Europe
- Germany
- United Kingdom
- France
- Italy
- Spain
- Rest of Europe
- Asia-Pacific
- China
- Japan
- India
- South Korea
- ASEAN
- Australia
- Rest of Asia-Pacific
- Middle East and Africa
- Middle East
- GCC
- Turkey
- Israel
- Rest of Middle East
- Africa
- South Africa
- Nigeria
- Egypt
- Rest of Africa
- Middle East
- North America
Data Sources, Market Sizing, and Validation
Desk Research
Desk research starts with mapping where eye tracking gets built and bought, and then matching that to public signals that can be checked year after year. We rely on sources such as the US National Highway Traffic Safety Administration for safety and driver monitoring context, Euro NCAP protocols for in-cabin monitoring signals, and UNECE regulation updates that influence adoption timing.
To ground end market activity, we also use sources such as the US Bureau of Labor Statistics price and wage series (for cost direction), US International Trade Commission data for hardware trade movement, and peer reviewed papers indexed in repositories like PubMed for application maturity in healthcare and human factors research. These are complemented with company filings, investor decks, association websites, and reputed press coverage. When needed, analyst subscriptions for company financials and intelligence, patent databases, and shipment level import-export datasets are used to cross-check product activity and supply footprints. The desk sources listed are illustrative only, and many other public references were used for collection, validation, and clarification.
Primary Interviews and Surveys
Primary work focuses on validating what is actually being purchased and deployed, not just what is being announced. We spoke with solution providers, system integrators, automotive and consumer device stakeholders, and research users, and then reconciled pricing and volume assumptions across major demand regions.
Interviews were also used to confirm typical attach rates, replacement cycles, and the shift between hardware-heavy bundles and software-led monetization, which then helped tighten the model ranges before final sign-off.
Distribution of primary research fieldwork respondents
| Company type | Respondent position | Region |
|---|---|---|
| Top tier: 25% | CXOs: 15% | APAC: 45% |
| Mid tier: 57% | Functional/Unit leaders: 29% | EMEA: 29% |
| Smaller Players: 18% | Managers: 56% | Americas: 26% |
Market-Sizing & Forecasting
Sizing is built using a top-down approach where adoption is reconstructed from demand pools by application, and then converted into value using realistic price bands. For example, the automotive portion is tied to the spread of driver monitoring requirements and platform rollout timing, and the research and retail portions are connected to lab and enterprise procurement behavior.
Once that view is set, selective bottom-up checks are run so totals do not drift away from reality. These checks use sampled average selling prices and volumes for remote and head-mounted units, typical software license ranges, and channel feedback on bundling. Key model inputs include AR or VR headset shipment trends, driver monitoring system penetration by new vehicle platforms, the share of studies using gaze metrics in human factors and clinical research, camera and infrared component pricing direction, and the pace of design wins moving into production.
Forecasting uses scenario analysis supported by expert views, because regulation timing and product cycles can shift growth between years even when the long run trend remains positive. Where gaps exist in smaller geographies or niche applications, proxy ratios from similar markets and validated price bands are used, followed by a sensitivity check so no single assumption dominates the outcome.
Data Validation & Update Cycle
Validation is done through repeated cross-checks across independent signals, and then reviewed through more than one analyst pass. Outputs are compared with adjacent indicators like safety regulation effective dates, device shipment direction, and observed pricing moves, and then anomalies are investigated until the reason is clear.
If primary feedback conflicts with the model, respondents are re-contacted and assumptions are adjusted with notes kept for traceability. The report is refreshed annually, with interim updates when material events occur, and a final pre-delivery review is completed so the latest developments are reflected in the published view.
Mordor Intelligence's Eye Tracking Solutions Market Sizing Compared With Other Published Estimates
Published market values for eye tracking often do not match because the product boundary is drawn differently and because the demand signals used to scale volumes are not the same across studies. Differences also come from the base year chosen, the way prices are averaged across hardware and software, and how quickly assumptions are refreshed when regulations or device cycles shift.
Shipment direction for AR or VR headsets, the timing of driver monitoring rollout signals, and price ranges heard from buyers are the checks that keep Mordor Intelligence tied to eye tracking solutions sold as hardware plus software, instead of broader eye tracking activity that can include adjacent sensing and analytics. When some publishers bundle wider in-cabin sensing or include services without clearly separating recurring software, the market total can move up quickly even if unit volumes do not.
Benchmark comparison
| Source | Market Size | Gaps in Research Methodology |
|---|---|---|
| Mordor Intelligence | USD 1.87 B (2026) | |
| Industry Bulletin A | USD 1.10 B (2024) | Uses a broader label of eye tracking without clearly separating solution revenue from related sensing categories, and it does not explain how hardware versus software pricing was averaged across use cases. |
| Press Release B | USD 0.80 B (2022) | Starts from an earlier base year and appears to emphasize research and healthcare demand, which can undercount the faster ramp from automotive driver monitoring and newer consumer device embeds. |
The spread in the table is mainly explained by scope boundaries and base year choices, followed by different ways of blending hardware and software pricing. By keeping the demand pools explicit by application and then checking totals against practical adoption signals, the final number stays transparent and repeatable for planning.
Key Questions Answered in the Report
What is the current value of the eye tracking solutions market?
The market reached USD 1.87 billion in 2026.
How fast will the market grow through 2031?
It is projected to expand at a 29.2% CAGR, hitting USD 6.75 billion by 2031.
Which segment leads the market today?
Hardware solutions dominate with 67.40% share because dedicated cameras and illuminators remain essential.
Which region is growing the quickest?
Asia-Pacific is expected to post a 30.4% CAGR, spurred by China’s mandatory driver monitoring rules.