
Expression Vectors Market Size and Share
Market Overview
| Study Period | 2020 - 2031 |
|---|---|
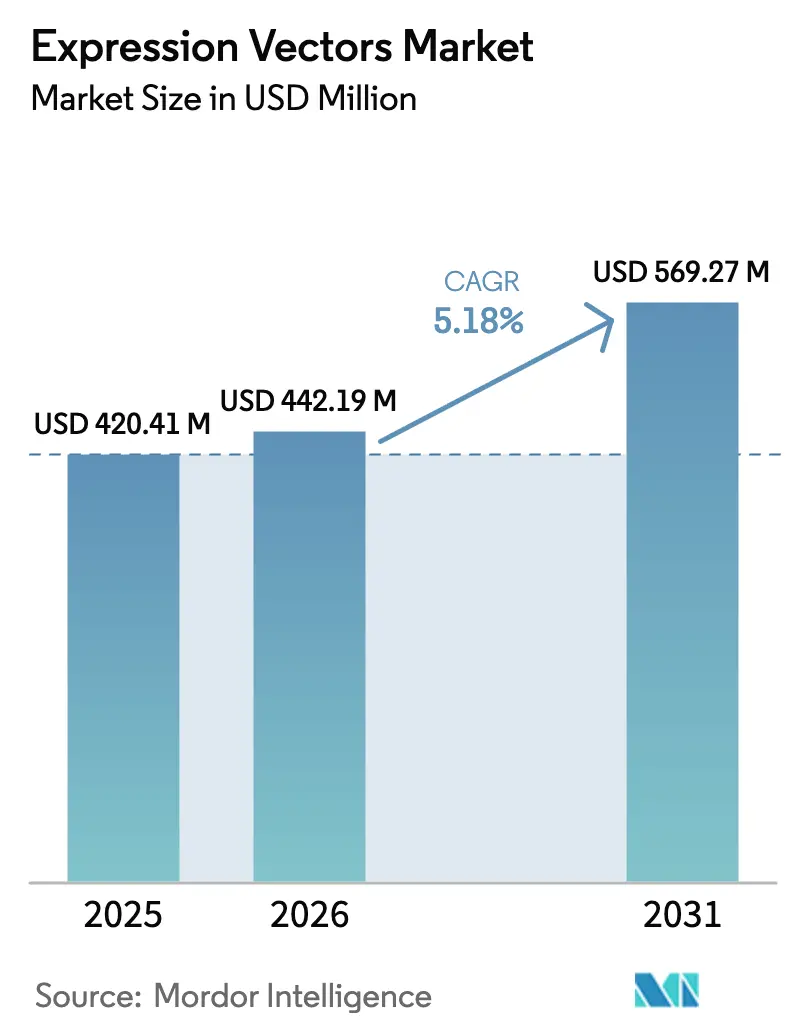
| Market Size (2026) | USD 442.19 Million |
| Market Size (2031) | USD 569.27 Million |
| Growth Rate (2026 - 2031) | 5.18 % |
| Fastest Growing Market | Asia-Pacific |
| Largest Market | North America |
| Market Concentration | Medium |
Major Players *Disclaimer: Major Players sorted in no particular order Image © Mordor Intelligence. Reuse requires attribution under CC BY 4.0. | |
Expression Vectors Market Analysis by Mordor Intelligence
Expression vectors market size in 2026 is estimated at USD 442.19 million, growing from 2025 value of USD 420.41 million with 2031 projections showing USD 569.27 million, growing at 5.18% CAGR over 2026-2031. Rapid adoption of vectors in clinical-grade biologics, rising investments in artificial-intelligence-enabled vector optimization, and expanding contract manufacturing capacity are accelerating demand. Bacterial systems remain cost-efficient for simple proteins, while insect and mammalian hosts gain traction for complex therapeutics that require native-like folding [1]U.S. Food and Drug Administration, “Approved Cellular and Gene Therapy Products,” fda.gov . Contract development and manufacturing organizations (CDMOs) use scale and specialization to lower per-unit costs, yet escalating raw-material prices and tighter viral-safety standards lift compliance overheads. Competitive intensity rises as suppliers integrate AI-driven design with good-manufacturing-practice (GMP) production to secure long-term supply agreements.
Key Report Takeaways
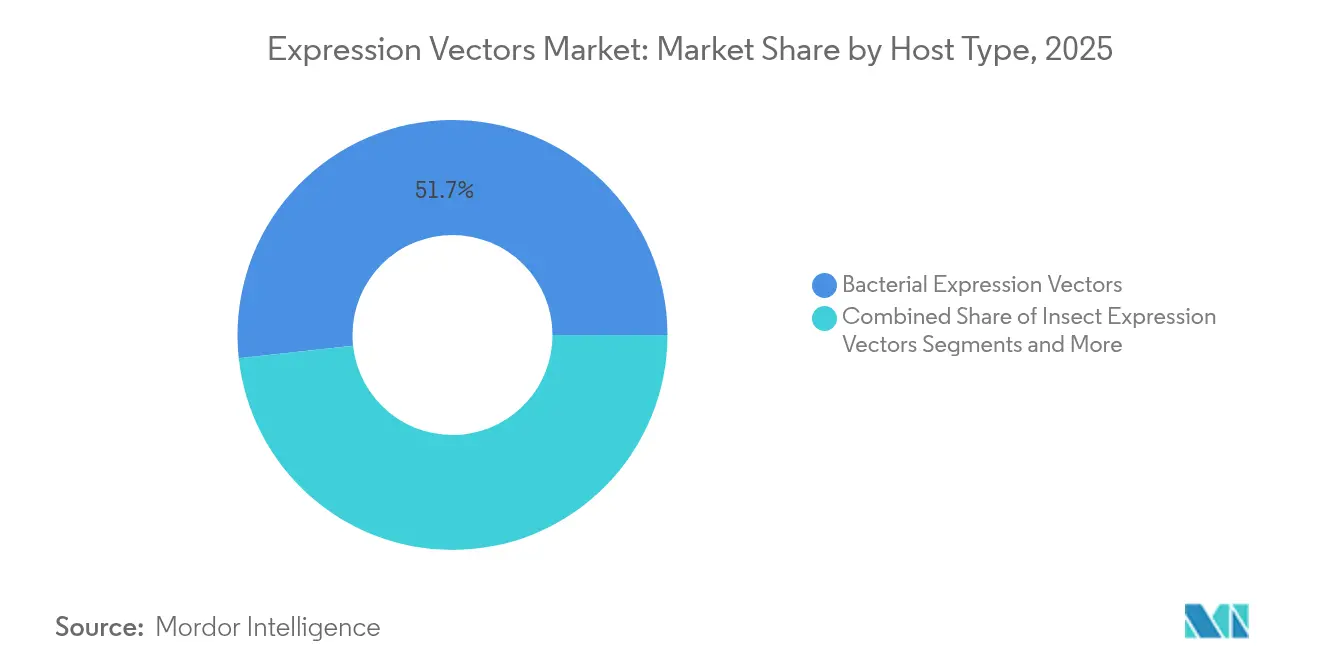
- Bacterial expression vectors held 51.72% of the Expression vectors market share in 2025. Insect expression vectors are projected to grow at a 5.97% CAGR through 2031.
- Therapeutic applications commanded 49.35% of the Expression vectors market size in 2025, while research applications are advancing at a 6.01% CAGR to 2031.
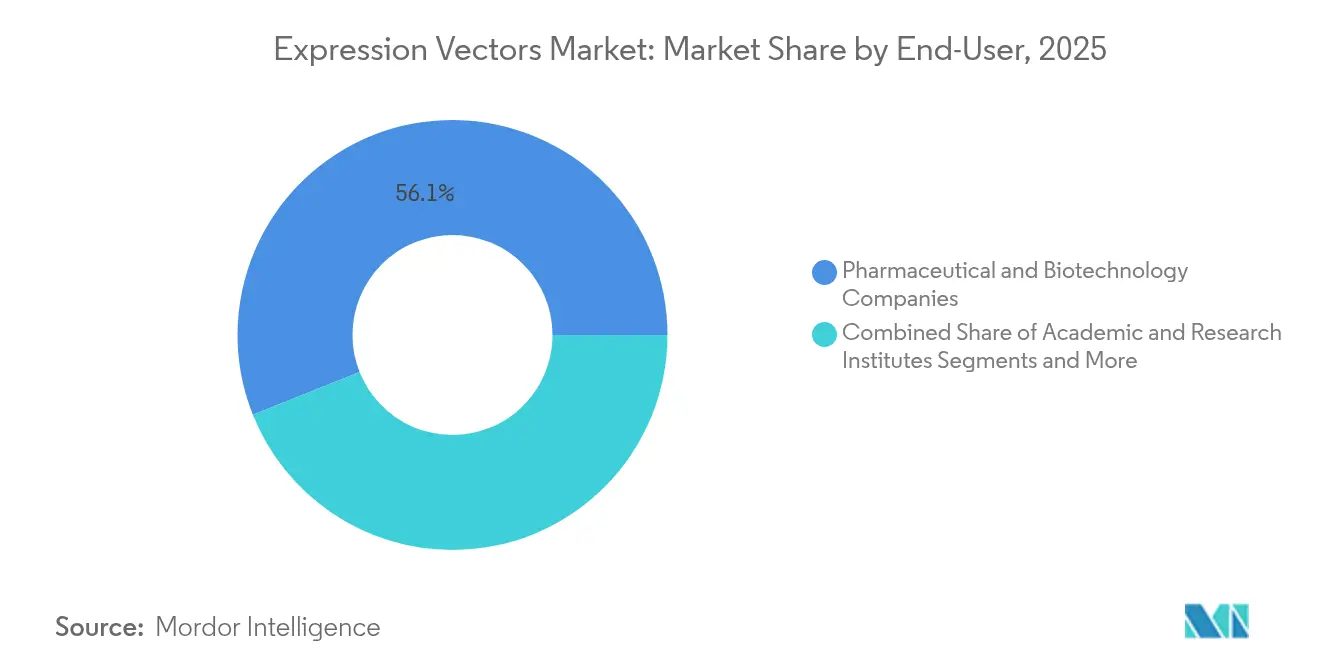
- Pharmaceutical and biotechnology companies captured 56.05% revenue share in 2025; academic and research institutes post the fastest growth at a 6.08% CAGR through 2031.
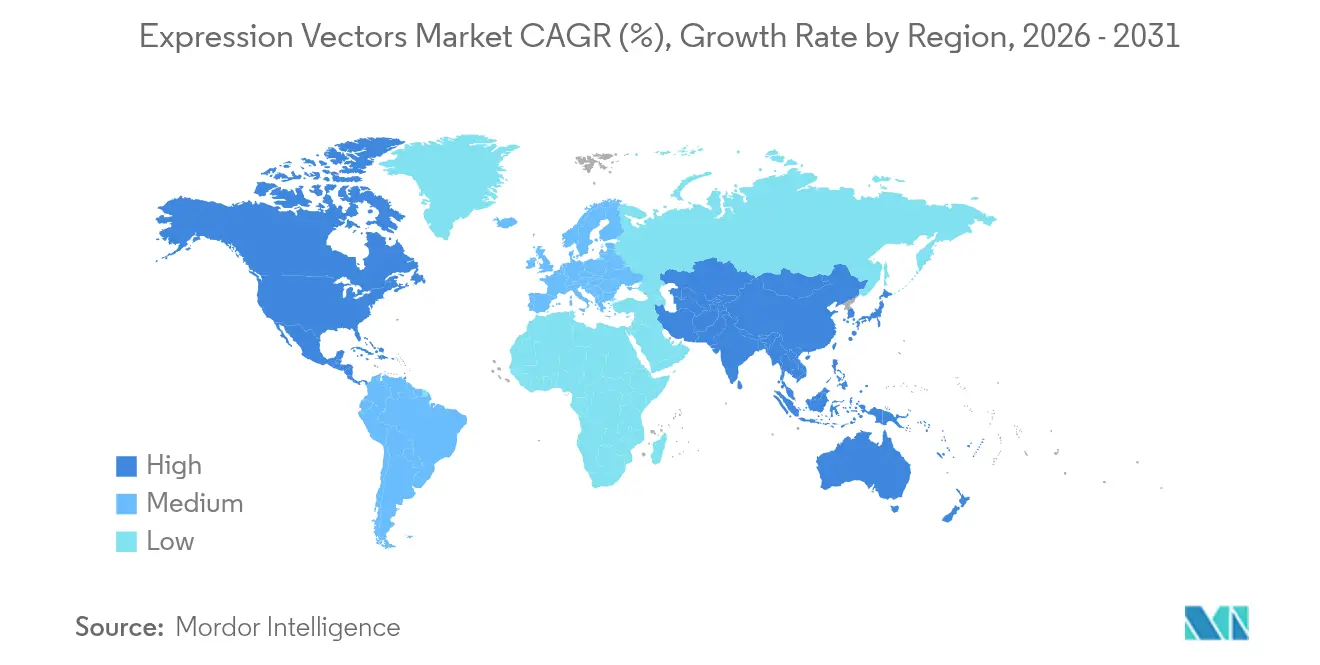
- North America accounted for 42.05% of 2025 revenue, whereas Asia-Pacific is forecast to expand at a 6.15% CAGR between 2026-2031.
Note: Market size and forecast figures in this report are generated using Mordor Intelligence’s proprietary estimation framework, updated with the latest available data and insights as of 2026.
Market Trends and Insights
Drivers Impact Analysis of Expression Vectors Market*
| Driver | (~) % Impact on CAGR Forecast | Geographic Relevance | Impact Timeline |
|---|---|---|---|
| Surge in demand for advanced biologics & cell-/gene-therapies | +1.2% | Global, with North America & EU leading | Medium term (2-4 years) |
| Growing adoption of mammalian & insect hosts for complex proteins | +0.9% | Global, concentrated in APAC manufacturing hubs | Long term (≥ 4 years) |
| Expansion of contract vector manufacturing capacity | +0.8% | North America & EU core, spill-over to APAC | Short term (≤ 2 years) |
| AI-driven codon optimisation & de-novo vector design | +0.7% | Global, early adoption in US & Germany | Medium term (2-4 years) |
| Open-source vector repositories accelerating translation | +0.6% | Global, concentrated in academic research centers | Medium term (2-4 years) |
| mRNA-vaccine spill-over boosting plasmid-vector demand | +0.5% | North America & EU primarily | Short term (≤ 2 years) |
| Source: Mordor Intelligence | |||
Surge in Demand for Advanced Biologics & Cell-/Gene-Therapies
Gene-therapy approvals climbed from 8 in 2023 to 15 in 2024, each requiring customized, high-purity vectors. Clinical programs now specify vector designs compatible with perfusion bioreactors and single-use systems, tightening supplier selection. Autologous CAR-T pipelines intensify batch-specific vector demand, prompting companies such as Bluebird Bio and Oxford BioMedica to restructure in-house production schedules. CDMOs with redundant suites absorb overflow, but their capacity utilization peaks during regulatory surges. Developers perceive secure vector supply as a strategic differentiator and often lock multi-year contracts, reinforcing long-term revenue visibility across the Expression vectors market.
Growing Adoption of Mammalian & Insect Hosts for Complex Proteins
Biopharma firms pivot toward baculovirus expression vector systems (BEVS) for membrane proteins and glycoproteins that need authentic post-translational modifications [2]Nature Biotechnology, “Advances in Baculovirus Expression Vector Systems for Complex Protein Production,” nature.com . Regulatory guidance now evaluates glycosylation consistency alongside sequence identity, favoring eukaryotic hosts. Although mammalian cell production costs remain higher, demand for distinctive safety and efficacy profiles justifies premiums, particularly for first-in-class therapies. Suppliers respond by widening transfection-media portfolios and offering ready-to-transfect kits optimized for Chinese hamster ovary and Spodoptera frugiperda cells. The trend reallocates R&D spending from bacterial optimization toward scalable eukaryotic platforms, broadening revenue channels across the Expression vectors market.
Expansion of Contract Vector Manufacturing Capacity
AGC Biologics, Polyplus, and other CDMOs invested more than USD 400 million in specialized vector plants during 2024. Expanded GMP suites lower per-gram costs by up to 35%, enticing small biotech firms that lack internal infrastructure. Outsourcing streamlines timelines, yet it also centralizes production in fewer hubs, raising systemic risk from capacity disruptions. CDMOs try to mitigate concentration risk through multi-site networks across the United States, Denmark, and Singapore. This outsourcing boom democratizes access to therapeutic-grade vectors, accelerating pipeline progression and fueling incremental demand within the Expression vectors market.
AI-Driven Codon Optimization & De-Novo Vector Design
The CodonTransformer algorithm improves average protein yield by 15-20% versus classical approaches, trimming development cycles from months to weeks [3]Nature Machine Intelligence, “CodonTransformer: AI-Driven Codon Optimization,” nature.com . Machine-learning pipelines now match promoters, enhancers, and codon biases to host-specific translational kinetics, raising predictability. Early adopters integrate AI into quality-by-design frameworks, translating improved expression into smaller bioreactor footprints and lower cost-of-goods. Open-source AI toolkits broaden experimentation in academic settings, intensifying competitive pressures but also accelerating innovation across the Expression vectors market.
Restraints Impact Analysis of Expression Vectors Market*
| Restraint | (~) % Impact on CAGR Forecast | Geographic Relevance | Impact Timeline |
|---|---|---|---|
| High cost & complexity of GMP-grade vector production | -0.8% | Global, acute in emerging markets | Long term (≥ 4 years) |
| Stringent viral-vector safety regulations | -0.6% | North America & EU primarily | Medium term (2-4 years) |
| Patent thickets around promoters/regulatory elements | -0.4% | Global, concentrated in developed markets | Long term (≥ 4 years) |
| Supply-chain fragility for critical raw materials | -0.3% | Global, acute in APAC manufacturing | Short term (≤ 2 years) |
| Source: Mordor Intelligence | |||
High Cost & Complexity of GMP-Grade Vector Production
Clinical-grade plasmid DNA costs range between USD 50-200 per gram, four to ten times research-grade pricing. Capital expenses for ISO-classified cleanrooms, quality-management systems, and sterility testing inflate operating budgets. Small biotech firms often delay trials due to procurement bottlenecks, while academic centers rarely absorb full compliance costs. Although CDMOs mitigate scale constraints, tighter capacity during peak demand inflates spot prices and lengthens lead times. These dynamics dampen adoption rates in emerging markets and moderate overall expansion of the Expression vectors market.
Stringent Viral-Vector Safety Regulations
The FDA’s Q5A(R2) revision mandates broader adventitious-agent testing, extending development timelines by up to 12 months and adding USD 0.5-2 million per program. Similar European Medicines Agency guidance layers regional specificity onto global compliance frameworks, creating documentation redundancies. Small developers may struggle to finance incremental assays, limiting the pace of novel vector launches. Although the regulations raise safety standards and improve patient outcomes, they constrain near-term growth across the Expression vectors market.
*Our forecasts treat driver/restraint impacts as directional, not additive. The impact forecasts reflect baseline growth, mix effects, and variable interactions.
Expression Vectors Market Segment Analysis
By Host Type:
Bacterial Dominance Faces Insect System ChallengeBacterial systems captured 51.72% of the Expression vectors market share in 2025, supported by cost-efficient fermentation and well-understood genetic toolkits. In contrast, Insect vectors record a robust 5.97% CAGR to 2031 as BEVS technology resolves folding and glycosylation constraints.
The Expression vectors market continues to migrate toward eukaryotic hosts, with mammalian platforms commanding premium pricing due to regulatory emphasis on protein quality. Yeast systems maintain relevance for certain enzymes, while plant and algal vectors explore non-pharma niches. As therapeutic pipelines tilt toward multi-subunit biologics, host-selection frameworks prioritize fidelity over cost, accelerating demand for sophisticated insect and mammalian solutions.


By Application:
Research Applications Accelerate Beyond TherapeuticsTherapeutic programs accounted for 49.35% of the Expression vectors market size in 2025, yet research uses are growing faster at a 6.01% CAGR through 2031. Open repositories lower entry barriers, and NIH funding for vector-based discovery climbed 18% in 2024.
Academic labs exploit rapid prototyping to interrogate gene functions, fuel synthetic-biology constructs, and validate drug targets, creating consistent baseline demand. Improved translation frameworks shorten the bench-to-clinic timeline, enabling discoveries to progress into regulated pipelines within five years. These dynamics extend revenue opportunities throughout the Expression vectors market life cycle.
By End-User:
Academic Institutes Drive Innovation PipelinePharmaceutical and biotech firms represented 56.05% of 2025 revenue, relying on long-term supply agreements to de-risk clinical milestones. Academic and research institutes, however, exhibit the fastest 6.08% CAGR to 2031 as universities scale vector core facilities and bolster translational funding.
Shared infrastructure reduces per-experiment costs and promotes standardized quality. Cross-sector collaborations pair academic discovery with industrial scale-up, enhancing commercialization prospects. CDMOs serve both cohorts, positioning themselves as connective tissue across the Expression vectors market.
Geography Analysis
North America Expression Vectors Market
North America’s 42.05% share reflects entrenched venture investment, streamlined FDA pathways, and integrated supply chains connecting discovery through commercialization. Canada’s CAD 2.2 billion Advanced Biomanufacturing initiative furthers domestic vector capacity, and Mexico’s near-shoring trend adds process-development demand.
APAC Expression Vectors Market
Asia-Pacific is the fast-growing region at 6.15% CAGR. China authorised its first home-grown CAR-T therapy in 2024, spurring domestic CDMOs to boost vector output. Singapore’s tax-incentive clusters attract global majors, and South Korea’s K-Bio Belt builds dedicated biomanufacturing corridors. Japan reduces review timelines by 30%, enhancing deployment speeds for regenerative products.
Europe Expression Vectors Market
Europe maintains a consolidated but innovative market, with Germany’s EUR 500 million BioRegion program enhancing infrastructure. The United Kingdom speeds approvals post-Brexit, while France’s Genopole adds vector suites. Southern European nations grow gradually, yet shared EMA guidelines permit seamless product movement, reinforcing pan-regional demand within the Expression vectors market.

Regulatory Landscape
Expression vectors used in therapeutic development are primarily governed through biologics, advanced therapy, and GMP frameworks that raise requirements for identity, safety, and process controls, especially when vectors support viral-vector, plasmid DNA, or cell line development workflows. In the United States, FDA expectations around viral safety and adventitious agent control, including expanded testing aligned with Q5A(R2) updates cited in the report context, extend qualification and comparability packages for clinical-grade vectors and related raw materials. This shifts the compliance burden toward qualified suppliers and CDMOs, which smaller developers often struggle to match.
In Europe, the European Commission reinforced its biotechnology and biomanufacturing agenda through COM(2025) 1022 and follow-on 2026 actions around a Union-level framework (often referenced as a European Biotech Act) focused on regulatory simplification across health-focused rulesets such as the Clinical Trials Regulation and ATMP-related pathways. The same direction also points to supervised regulatory sandboxes intended to shorten iteration cycles for new bioprocess technologies, which aligns with the need for consistent critical quality attributes in AI-enabled vector design and in newer eukaryotic expression systems, including glycosylation consistency for complex proteins.
Competitive Landscape
The Expression vectors market shows moderate fragmentation as no single vendor exceeds one-third revenue, yielding space for niche innovators. Thermo Fisher Scientific and Merck KGaA anchor portfolios spanning cloning kits, transfection reagents, and GMP production. GenScript and New England Biolabs gain share through tailored services and rapid turnaround.
AI-enabled sequence design, proprietary promoters, and integrated regulatory consulting emerge as differentiators. Patent filings on vector technologies rose 34% in 2024, highlighting intensifying innovation. CDMOs like AGC Biologics and Lonza leverage scale to negotiate bulk raw-material prices, creating price pressure on smaller labs. Yet, high compliance barriers limit new entrants, preserving margins for established actors.
Industry participants increasingly adopt platform approaches. Agreements such as the Lonza–Oxford BioMedica partnership integrate lentiviral expertise with global manufacturing footprints. Suppliers bundle AI-guided design, plasmid topology selection, and cGMP output, giving customers single-source convenience. These strategies fuel healthy competition while sustaining innovation velocity across the Expression vectors market.
Expression Vectors Industry Leaders
Thermo Fisher Scientific, Inc.
Promega Corporation
Merck KGaA
Agilent Technologies
Bio-Rad Laboratories
- *Disclaimer: Major Players sorted in no particular order

Expression Vectors Market Companies Covered in this Report
- Thermo Fisher Scientific
- Merck
- Takara Bio
- Promega
- Agilent Technologies
- Bio-Rad Laboratories
- QIAGEN
- New England Biolabs
- Genscript
- OriGene Technologies
- System Biosciences
- Lonza Group
- Aldevron
- Cobra Biologics
- Sirion-Biotech
- Bluebird bio
- Catalent
- Addgene
- Oxford BioMedica

Market Opportunities and Future Outlook
A clear opportunity sits at the interface of vector design and manufacturability. Suppliers that pair host-optimized backbones, bacterial for cost efficiency and mammalian or insect platforms where protein quality attributes dominate, with quality-by-design documentation and validated analytical packages address a recurring bottleneck in clinical translation. Tightening viral safety expectations in the report context also increases demand for standardized, compliance-ready vector systems, traceable raw materials, and bundled support from established vendors and CDMOs.
A second whitespace area is platformization across the upstream workflow, where vector technologies are embedded into broader toolchains for faster cell line development, transfection, and scale-up. The report context cites 2026 discussion from Thermo Fisher Scientific of a large pipeline of announced US biopharma manufacturing investments (USD 500 billion), which points to expanding installed capacity and ongoing demand for plasmids, promoters, selectable markers, and transfection systems. In parallel, the European Commission biotechnology and biomanufacturing program (COM(2025) 1022 and subsequent 2026 framework work) provides a policy backdrop that supports increased process development and manufacturing activity, creating openings for suppliers that can localize GMP-grade vector supply and shorten lead times for European programs.
Recent Industry Developments in Expression Vectors Market
- June 2026: VectorBuilder partnered with MaxCyte to co-develop a gene delivery solution combining VectorBuilder’s MiniVec plasmid system with MaxCyte’s electroporation platform. The collaboration expands end-to-end vector delivery capability and could shift competitive dynamics in clinical-grade vector production.
- April 2026: Thermo Fisher Scientific launched the CHOvantage GS cell line development kit, integrating a transposon-based vector system with optimized media and feeds. The initiative accelerates biologics development timelines and expands Thermo Fisher’s integrated vector-enabled platforms.
- October 2025: Merck KGaA reached a definitive agreement to acquire Mirus Bio, a specialist in transfection reagents used for viral vector production. The deal expands upstream viral-vector capabilities, and vertical integration may affect supplier dynamics and pricing in the vector supply chain.


Expression Vectors Market Report Scope and Research Methodology
Market Definition and Coverage
For this study, the market covers revenues generated from expression vectors that are used to deliver or maintain genetic sequences in host cells so proteins can be expressed for research, bioprocessing, and related lab and manufacturing use.
Scope exclusions: We exclude downstream protein expression services, CRO study fees, cell line development services, and general lab consumables that are not sold as expression vectors.
Segments Covered in This Report
- By Host Type
- Bacterial Expression Vectors
- Mammalian Expression Vectors
- Insect Expression Vectors
- Yeast Expression Vectors
- Others
- By Application
- Therapeutic Applications
- Research Applications
- Enzyme Manufacturing
- By End-User
- Pharmaceutical and Biotechnology Companies
- CDMOs / CROs / CMOs
- Academic & Research Institutes
- Others
- By Geography
- North America
- United States
- Canada
- Mexico
- Europe
- Germany
- United Kingdom
- France
- Italy
- Spain
- Rest of Europe
- Asia-Pacific
- China
- Japan
- India
- Australia
- South Korea
- Rest of Asia-Pacific
- Middle East and Africa
- GCC
- South Africa
- Rest of Middle East and Africa
- South America
- Brazil
- Argentina
- Rest of South America
- North America
Data Sources, Market Sizing, and Validation
Desk Research
Desk work started with building a clean view of demand drivers and the regulated environment that influences how vectors are designed and used. Public sources were used to anchor reality checks, including FDA product databases for advanced therapies, NIH and NCBI resources for gene expression tools, USP or similar pharmacopeial references for quality expectations, and publications indexed on PubMed that describe host systems and vector performance.
We also reviewed industry signals that translate scientific activity into spend, such as government R&D statistics (for example, NSF), trade and customs summaries where relevant, and company filings and investor presentations that discuss revenue mix for life science tools. Paid subscriptions for company financials and intelligence, news and financials, and patent databases were used selectively to confirm product positioning, launch timing, and ownership of key vector designs. The sources named here are illustrative, and many other public and paid references were checked to compile data, validate assumptions, and clarify gaps.
Primary Interviews and Surveys
Primary work was used to pressure test what gets counted as an expression vector sale, and then to align average selling prices with the most common purchase units across research and biomanufacturing users. We spoke with a mix of suppliers, distributors, and end users across key geographies, and the discussions helped confirm adoption levels by host system, typical reorder cycles, and how quickly newer vector formats are being substituted into workflows.
Distribution of primary research fieldwork respondents
| Company type | Respondent position | Region |
|---|---|---|
| Top tier: 36% | CXOs: 13% | APAC: 50% |
| Mid tier: 45% | Functional/Unit leaders: 32% | EMEA: 30% |
| Smaller Players: 19% | Managers: 55% | Americas: 20% |
Market-Sizing & Forecasting
Sizing was built using top-down and bottom-up logic together, starting from the total addressable life science tools spend that can be tied to gene expression workflows, and then narrowing it using penetration rates by host system and use case. Where public data is thinner, we relied on practical proxies, such as R&D intensity, biologics and gene therapy development activity, and the share of labs and manufacturers using recombinant protein production methods.
The model is driven by a small set of repeatable inputs that were validated in interviews, including the mix of bacterial, mammalian, insect, and yeast host systems, the split between research and manufacturing-grade demand, average selling price ranges for commonly purchased vector types, and the pace of upgrades linked to higher-expression and tighter quality needs. Forecasting used scenario analysis supported by expert consensus on funding cycles, capacity expansion for biologics, and the rate at which complex proteins push users toward advanced host systems. Bottom-up checks were then applied using sampled supplier revenues, channel checks on purchase frequency, and ASP x volume approximations. Gaps were handled by applying conservative regional adoption factors that were re-tested with follow-up calls.
Data Validation & Update Cycle
Outputs were validated through triangulation across at least three angles, namely supplier-side sales signals, end-user purchasing behavior, and independent activity markers like regulated product pipelines and R&D funding direction. If a country or host-system value looked out of line, the assumptions were re-opened, the math was rechecked, and follow-up primary conversations were triggered to resolve the variance before sign-off.
An internal review flow is applied in steps so that major inputs, calculations, and final totals are checked by more than one analyst, and any unusual jumps are explained in plain terms. Reports are refreshed annually, and material events like major regulatory shifts or sudden capacity changes are added through interim updates. Right before delivery, a final pass is performed so clients receive the most current view based on the latest available signals.
Mordor Intelligence's Expression Vectors Market Size Compared With Other Published Estimates
Published market sizes for expression vectors can differ a lot because authors do not always count the same product set, and they also choose different base years and price assumptions. Differences also come from how strongly the model ties demand to real workflow usage, which is why our checks lean on adoption by host systems and repeat purchase patterns.
Some published figures appear to bundle adjacent areas like broader gene delivery toolkits or downstream services into the same total, which lifts the number even when vector unit demand is unchanged. In Mordor Intelligence, the value is counted only when it is directly attributable to expression vector products used for gene expression in host cells, and it is kept separate from CRO fees and downstream protein expression services, which are then modeled in their own markets.
Benchmark comparison
| Source | Market Size | Gaps in Research Methodology |
|---|---|---|
| Mordor Intelligence | USD 442.19 M (2026) | |
| Industry Publisher A | USD 406.40 M (2024) | Uses a different base year and appears to apply a wider product-type bundle that can mix gene delivery formats with expression-focused constructs, and pricing is not clearly reconciled to purchase-unit norms. |
| Regional Consultancy B | USD 398.30 M (2024) | Long-dated forecast window and limited visibility on host-system adoption inputs can shift the implied starting value, and currency timing plus price uplift assumptions are not transparently validated through channel checks. |
The spread in the table is largely explained by year selection and what gets included around the core vector product revenues, followed by differences in how ASP progression is applied. By keeping the model tied to host-system usage, purchase frequency, and realistic pricing bands that were rechecked in primary calls, the final number stays traceable to inputs that can be repeated and updated without guesswork.


Key Questions Answered in the Report
What is the current value of the Expression vectors market?
The Expression vectors market size is USD 442.19 million in 2026.
How fast is demand expected to grow over the next five years?
Revenue is projected to reach USD 569.27 million by 2031, reflecting a 5.18% CAGR.
Which host system is gaining the most market traction?
Insect expression vectors show the fastest growth, advancing at a 5.97% CAGR through 2031.
What region offers the highest growth opportunity?
Asia-Pacific leads with a projected 6.15% CAGR due to large-scale investments in gene-therapy manufacturing.
Who are the leading suppliers in this space?
Thermo Fisher Scientific, Merck KGaA, GenScript, and New England Biolabs command significant share with comprehensive vector portfolios and GMP capacity.
Page last updated on:


 Your data is secure and never sold or shared.


