
Explosive Trace Detection Market Size and Share
Market Overview
| Study Period | 2020 - 2031 |
|---|---|
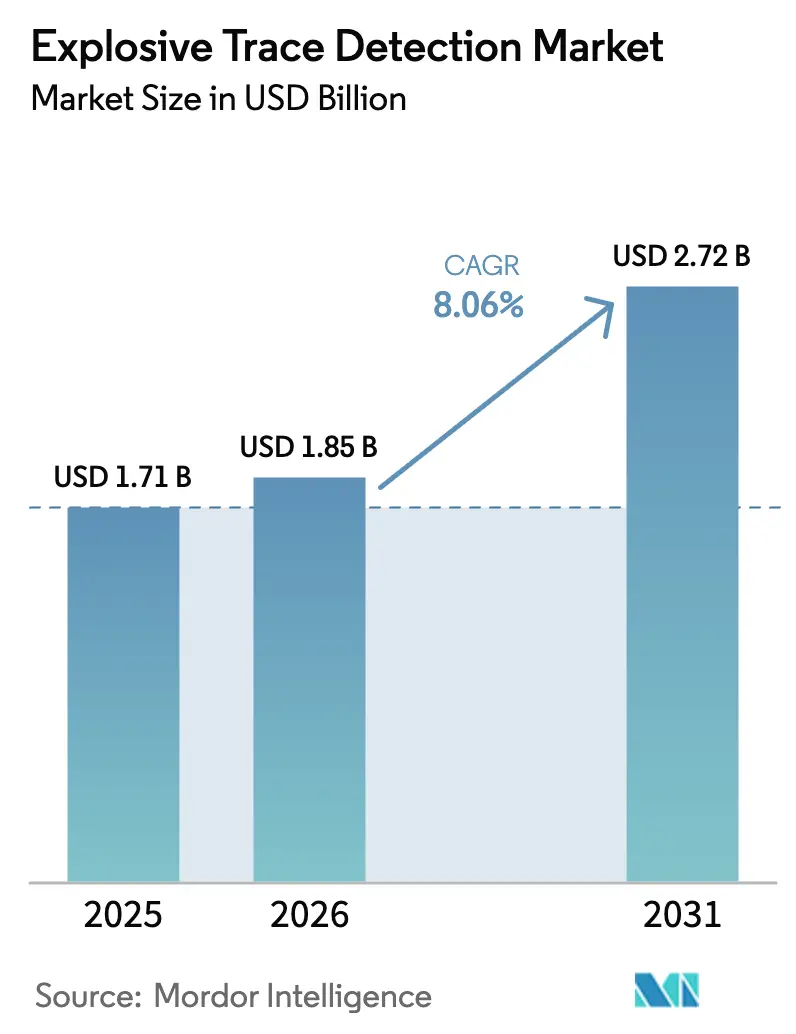
| Market Size (2026) | USD 1.85 Billion |
| Market Size (2031) | USD 2.72 Billion |
| Growth Rate (2026 - 2031) | 8.06% CAGR |
| Fastest Growing Market | Middle East and Africa |
| Largest Market | North America |
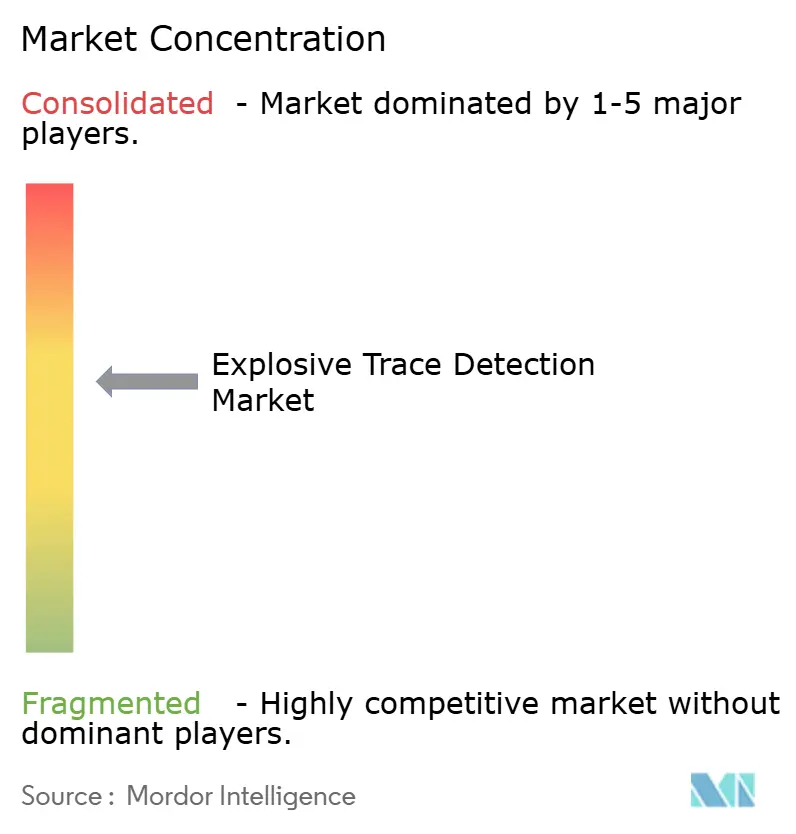
| Market Concentration | Medium |
Major Players *Disclaimer: Major Players sorted in no particular order Image © Mordor Intelligence. Reuse requires attribution under CC BY 4.0. | |
Explosive Trace Detection Market Analysis by Mordor Intelligence
The explosive trace detection market size was valued at USD 1.71 billion in 2025 and estimated to grow from USD 1.85 billion in 2026 to reach USD 2.72 billion by 2031, at a CAGR of 8.06% during the forecast period (2026-2031). Intensifying global security threats, stricter aviation and cargo regulations, and rapid airport infrastructure investments form the backbone of current demand. Uptake accelerates further because artificial-intelligence-driven false-alarm reduction trims checkpoint delays, while dual-mode vapor–particle sensors extend coverage to drones and automated kiosks. The European Union’s mandate for 100% cargo explosive trace detection (ETD) by 2026, the US Transportation Security Administration (TSA) five-year ETD funding program, and the Middle East’s airport megaprojects reinforce a cycle of procurement upgrades that benefits both incumbent suppliers and emerging innovators.
Key Report Takeaways
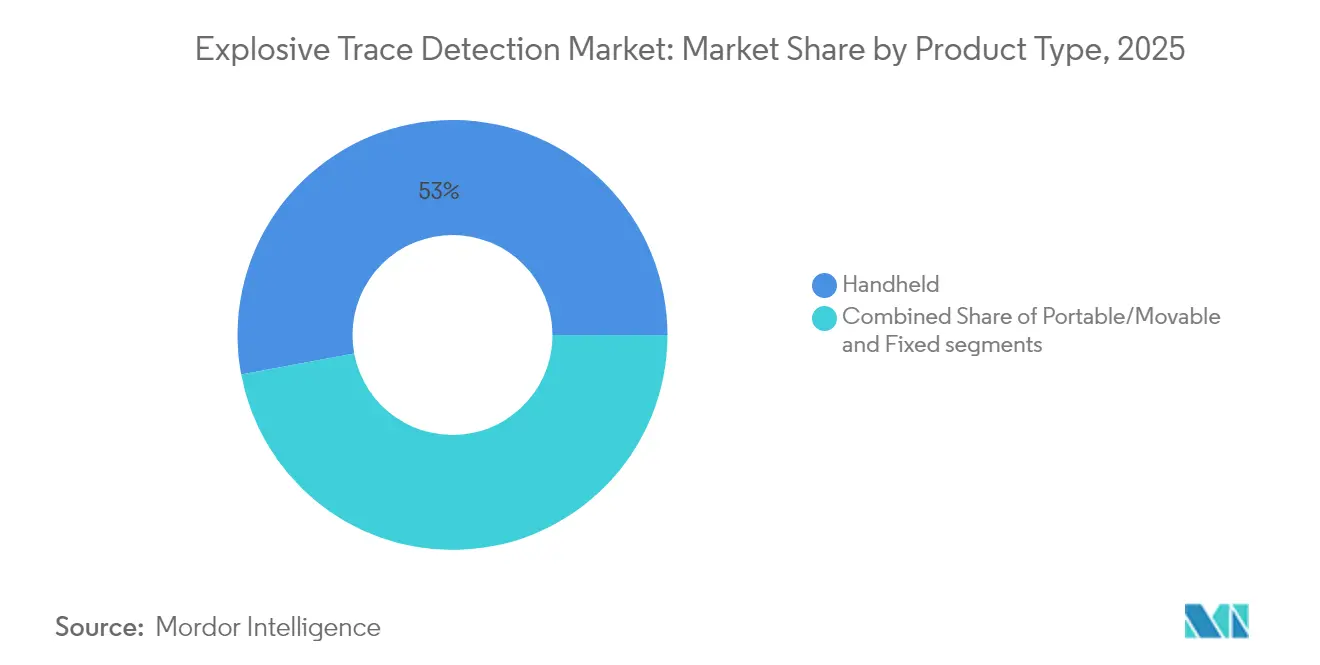
- By product type, handheld systems led with 52.95% revenue in 2025, whereas portable/movable units are projected to grow at a 10.28% CAGR through 2031.
- By detection technology, ion mobility spectrometry captured 57.30% of the explosive trace detection market share in 2025, while Raman and FTIR spectroscopy are set to expand at a 10.37% CAGR during 2026-2031.
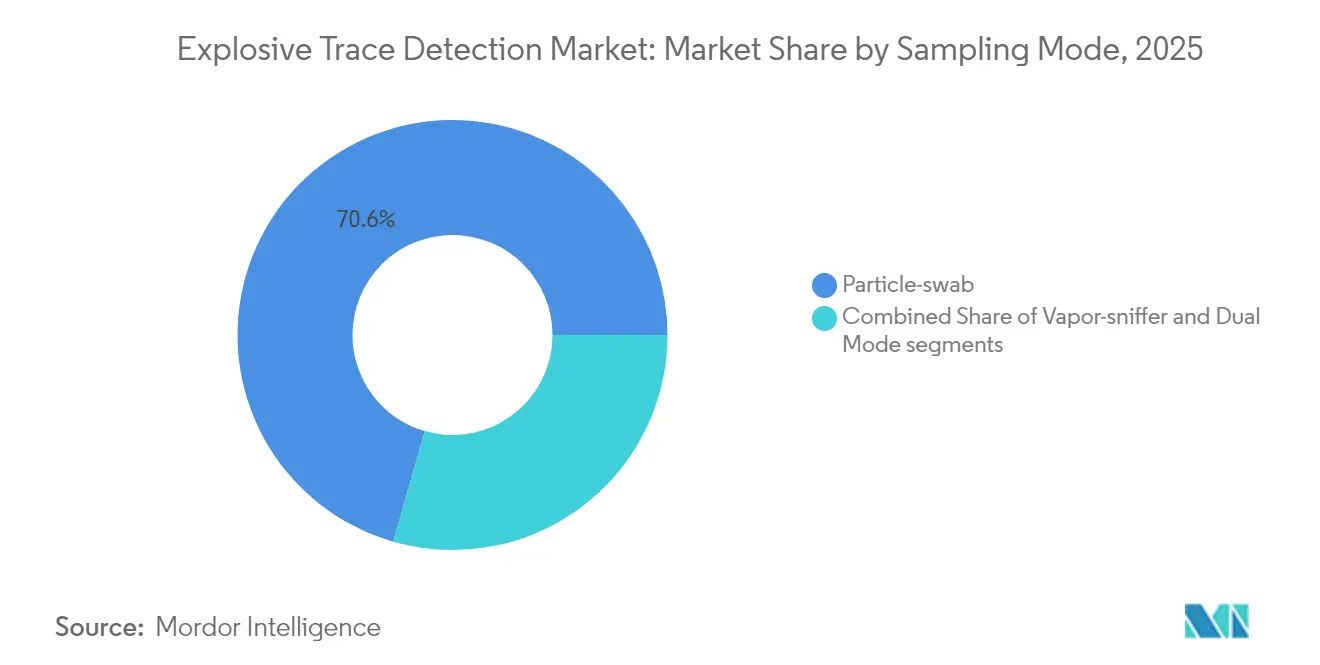
- By sampling mode, particle-swab methods had a 70.55% share of the explosive trace detection market in 2025; dual-mode systems are advancing at a 11.86% CAGR to 2031.
- By end-use sector, commercial applications held 43.05% of 2025 revenue, but cargo and logistics are forecasted to record the fastest 9.79% CAGR up to 2031.
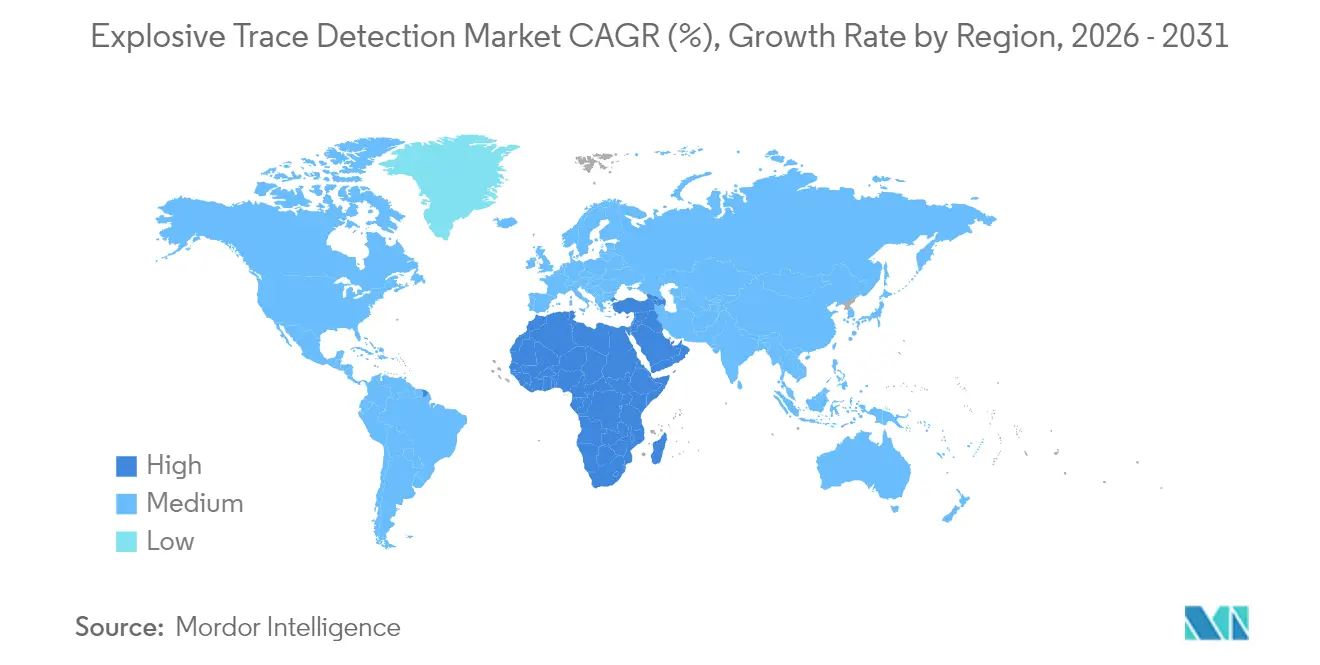
- By geography, North America remained the largest regional market with 42.10% share in 2025, whereas the Middle East and Africa region is poised for a 10.18% CAGR through 2031.
Note: Market size and forecast figures in this report are generated using Mordor Intelligence’s proprietary estimation framework, updated with the latest available data and insights as of 2026.
Global Explosive Trace Detection Market Trends and Insights
Drivers Impact Analysis*
| Driver | (~) % Impact on CAGR Forecast | Geographic Relevance | Impact Timeline |
|---|---|---|---|
| AI-enabled false-alarm reduction in IMS analyzers | +1.8% | Global, early uptake in North America and EU | Medium term (2–4 years) |
| Mandated 100% cargo ETD screening in EU-27 (2026) | +1.2% | Europe, spillover to global trade routes | Short term (≤ 2 years) |
| Miniaturized dual-mode vapor/particle sensors for drones | +0.9% | Global, defense-heavy regions | Long term (≥ 4 years) |
| Rising airport infrastructure upgrades in Asia | +1.1% | APAC core, expanding to MEA | Medium term (2–4 years) |
| Defense modernization programs | +1.3% | North America, Europe, APAC corridors | Long term (≥ 4 years) |
| Growing demand for contact-less ETD kiosks post-COVID | +0.8% | Global, high-traffic airports | Short term (≤ 2 years) |
| Source: Mordor Intelligence | |||
AI-enabled false-alarm reduction in IMS analyzers
Machine-learning engines embedded in IMS units lower nuisance alarms by up to 40% while retaining detection sensitivity.[1]Source: U.S. Department of Homeland Security, “Emergency Management of Tomorrow: AI Landscape Assessment,” dhs.gov Security agencies value the throughput gains because every false alert historically halts lanes and stresses staff. DHS allocated USD 418 million in FY 2025 for AI-enhanced screening, accelerating retrofits across TSA checkpoints. System integrators now bundle neural-network software updates with service contracts, creating new recurring revenue streams for suppliers while improving passenger experience.
Mandated 100% cargo ETD screening in EU-27 (2026)
The European Commission’s directive forces all air, sea, and land cargo operators to implement ETD screening, driving a procurement wave for thousands of portable and fixed units.[2]Source: European Commission, “Aviation Security Policy,” ec.europa.eu Logistics firms originally concerned about compliance costs are forging leasing deals with OEMs that package equipment, consumables, and remote diagnostics. Non-EU shippers serving European trade lanes adopt identical protocols, effectively globalising the rule set.
Miniaturized dual-mode vapor/particle sensors for drones
Sensor miniaturization enables rotary-wing drones to sniff for traces within denied areas at standoff range. Hybrid bio-electronic designs using silkworm-moth antennae deliver higher sensitivity than conventional MEMS arrays. The US Army SBIR program funds quantum-magnetometer payloads that detect person-borne IEDs, signaling military confidence in aerial ETD’s strategic value.
Rising airport infrastructure upgrades in Asia
Asia-Pacific’s USD 1 trillion pipeline of new terminals and runways requires mass deployment of next-generation ETD lanes. Projects in India, Hong Kong, and Gulf states specify CT X-ray baggage systems paired with high-throughput trace detectors capable of screening 10,000 passengers per hour. OEMs are forming localisation joint ventures to meet offset clauses demanding local manufacturing content.
Restraints Impact Analysis*
| Restraint | (~) % Impact on CAGR Forecast | Geographic Relevance | Impact Timeline |
|---|---|---|---|
| Short replacement cycle of consumable swabs | -0.7% | Global, high-volume sites | Short term (≤ 2 years) |
| Lack of global standard for nanogram detection limits | -0.5% | Global, fragmented regulations | Medium term (2–4 years) |
| Supply-chain bottlenecks in semiconductor gases | -0.9% | Global, Asia-Pacific fabs | Short term (≤ 2 years) |
| High total cost of ownership for multi-modal units | -0.6% | Global, budget-constrained users | Long term (≥ 4 years) |
| Source: Mordor Intelligence | |||
Short replacement cycle of consumable swabs
Single-use swabs priced between USD 2 and USD 15 accumulate significant recurrent expenditures at checkpoints that screen thousands. TSA-approved consumables are proprietary, locking agencies into specific vendors and reducing price competition. MIT’s chemically modified swabs boost sensitivity but raise per-unit costs, intensifying budget pressure.
High total cost of ownership for multi-modal units
Multi-modal detectors that combine IMS, Raman, and mass spectrometry cost up to USD 100,000 each and require annual service contracts exceeding 15% of the capital price. Smaller airports often defer upgrades or choose single-technology units, slowing overall adoption despite superior threat coverage.
*Our forecasts treat driver/restraint impacts as directional, not additive. The impact forecasts reflect baseline growth, mix effects, and variable interactions.
Segment Analysis
By Product Type: Portability Drives Market Evolution
Handheld detectors generated the largest revenue in 2025, accounting for 52.95% of the explosive trace detection market. They appeal to security teams that require mobility within terminals, border checkpoints, and special-event venues. Nevertheless, portable/movable systems are forecast to grow at 10.28% CAGR as longer-life batteries, AI-enhanced analytics, and ruggedised casings make cart-mounted platforms attractive for rapid-deployment scenarios. Bruker RoadRunner and Smiths Detection Sabre 5000 illustrate the trend toward shrinking size without sacrificing sensitivity. Fixed units retain demand in high-volume cargo lines and critical infrastructure, where 24/7 automation justifies the investment.
Operational priorities are shifting. Buyers now evaluate battery swap times, user-interface simplicity, and remote-software update capability alongside baseline detection limits. The explosive trace detection market size for portable units is projected to expand from an estimated USD 460 million in 2025 to almost USD 829 million by 2031, underscoring how portability and throughput align with evolving security doctrines. Handheld devices will remain dominant but will face incremental feature upgrades such as embedded 5G modules for cloud analytics and biometric operator log-in.


By Detection Technology: Spectroscopy Innovation Accelerates
Ion mobility spectrometry maintained 57.30% market presence in 2025, benefiting from decades of regulatory acceptance and sub-minute analysis speed. The explosive trace detection market size tied to IMS platforms will continue to rise, yet Raman and FTIR spectrometers represent the fastest growing niche with a 10.37% CAGR. Their ability to deliver molecular fingerprints reduces false positives linked to common household chemicals, saving secondary-screening labor. Rigaku's TSA-funded R&D demonstrates government trust in Raman to identify new homemade explosive compositions.
Market adoption patterns suggest convergence rather than replacement. OEMs champion hybrid IMS-Raman models that automatically cross-verify alarms, delivering speed and specificity. Mass spectrometry, led by 908 Devices' handheld mass-spec unit, begins to carve out space in forensic and military operations where mission success justifies higher price points. Spectroscopy-only units' explosive trace detection market share could reach double digits by 2031 as algorithmic refinements slash analysis time.
By Sampling Mode: Dual-Mode Systems Gain Momentum
Particle-swab sampling dominated with a 70.55% share in 2025, reflecting ICAO and TSA procedural norms. Even so, vapor-sniffer technology is appealing for stand-off interrogating suspicious vehicles or baggage. Dual-mode architectures that fuse both approaches scale at 11.86% CAGR because they curb operational blind spots. For example, operators can screen external packages by vapor first, then collect swab samples only if elevated risk indicators are triggered.
The model simplifies workflow and boosts lane throughput by reducing unnecessary swab consumption, thereby mitigating the restraint of recurring consumable costs. Field data show dual-mode detectors cut rescreen rates by 20%, improving passenger experience and elevating security perception. The explosive trace detection market size allocated to dual-mode configurations is forecast to triple between 2025 and 2031, assisted by software that dynamically selects the optimal mode based on perceived threat probability.
By End-Use Sector: Cargo Logistics Drives Growth
Commercial aviation remained the top purchaser with 43.05% revenue in 2025, spurred by airport modernisation across Asia and North America. Yet the cargo and logistics sector records the highest 9.79% CAGR because mandatory 100% screening regulations take effect in Europe and are mirrored by trade partners worldwide. Large freight forwarders and express couriers invest in high-throughput conveyor-integrated ETD lanes that can clear 500 consignments per hour.
Defence agencies continue to procure ruggedized handheld units as part of force-protection kits. The explosive trace detection industry sees growth in critical-infrastructure protection, such as power plants and stadiums that integrate fixed ETD portals into access-control systems. Law-enforcement bomb squads embrace pocket-sized detectors able to provide presumptive identification on-scene, shortening evacuation timelines.
Geography Analysis
North America commanded 42.10% revenue in 2025, anchored by TSA’s USD 229.2 million budget and Leidos’ USD 2.6 billion equipment sustainment contract. The region remains a reliable replacement market, with airlines emphasising total cost of ownership and regulatory compliance over disruptive innovation. Europe follows, propelled by the cargo-screening mandate that imposes tight 2026 deadlines on operators.
Asia-Pacific contributes outsized unit volumes as mega-airports open runways and satellite terminals. India’s plan for 220 new airports by 2035 and Hong Kong’s USD 800 million security upgrade highlight the runway expansion wave. The Middle East and Africa register the most rapid expansion at 10.18% CAGR, supported by the USD 35 billion Al Maktoum and USD 50 billion Riyadh hub projects that specify next-generation screening lanes. Latin America witnesses steady yet slower procurement due to budget constraints, often relying on surplus or refurbished equipment. Regional technology preferences differ. North American buyers favor AI-enabled false-alarm suppression, European agencies prioritise ECAC certification harmonisation, Asian airports seek integrated contactless kiosks, and Middle Eastern operators demand high-capacity, dual-energy mobile systems for cargo.

Regulatory Landscape
Explosive trace detection (ETD) requirements are set by aviation security regulators and qualification schemes that largely determine which systems can be procured and deployed at airports and cargo facilities. In Europe, ETD equipment acceptance is closely tied to the ECAC Common Evaluation Process (CEP), with ECAC maintaining a public equipment list (updated in May 2026) that reflects compliant ETD configurations used for aviation security operations. EU implementation timelines also affect upgrade cycles, as Implementing Regulation (EU) 2026/449 adjusted timelines for certain ETD-related chemical detection algorithm upgrades by extending the original compliance date by at least 12 months.
In the United States, the Transportation Security Administration (TSA) sets technology eligibility through the Air Cargo Screening Technology List (ACSTL) and a Qualified Products List (QPL) pathway that links qualification to federal procurement and security requirements. The UK Department for Transport also maintains an approved ETD systems list (updated through June 2026), reinforcing a parallel, list-based approach to technology acceptance that influences OEM certification priorities, software configuration management, and installed-base lifecycle updates.
Value Chain Analysis
The ETD value chain starts with sensor and subsystem inputs (ion mobility cells, lasers and spectrometers for Raman/FTIR variants, pumps, filters, and embedded computing), then moves to OEM design, assembly, and certification work led by suppliers such as Smiths Detection, Rapiscan Systems, Bruker, and 1st Detect. Certification and listing steps, including ECAC CEP in Europe and TSA ACSTL/QPL pathways in the United States, sit between manufacturing and end-user adoption. They shape product configuration control, software baselines, and documentation requirements before equipment can be sold into regulated aviation and cargo settings.
Downstream, distribution relies on direct sales and tender-driven procurements to airports, cargo operators, border agencies, and critical infrastructure, with integrators often supporting lane integration and IT connectivity. Recurring revenue comes from consumables, notably single-use swabs, as well as multi-year maintenance and calibration services. These are commonly bundled into framework agreements that cover uptime commitments and compliance support. Federal procurement and security protocols, including requirements relevant to Sensitive Security Information handling in the United States, add another compliance layer that affects supplier qualification, service staffing, and contract structure.
Competitive Landscape
The explosive trace detection market is moderately concentrated. Smiths Detection, Leidos, OSI Systems, Bruker, and 908 Devices comprise the top tier. Smiths Detection reported double-digit organic growth in Q3 2025 on next-generation CTX installations and aims for 6–8% full-year growth. Leidos reinforced its service dominance by winning an eight-year TSA contract worth up to USD 2.6 billion that covers 12,000 ETD units nationwide.
Competition hinges on AI analytics, operator-friendly design, and total cost of ownership. Startups push mass-spectrometry and bio-sensor breakthroughs that pledge higher specificity at lower running costs. Incumbents counter by integrating those sensors into modular platforms, protecting installed footprints with retrofittable upgrades. After-sales service networks and global certification portfolios remain decisive because airport authorities seldom accept unproven vendors.
Mergers and intellectual-property licensing are bridging gaps. Smiths Detection licenses Raman algorithms from Rigaku to expand its portable line, while OSI Systems bundles cloud-based analytics with Eagle mobile units, offering predictive-maintenance dashboards that cut downtime. Patent depth around ion-mobility cell design and drop-resistant vapor inlets form sustained entry barriers for latecomers.
Explosive Trace Detection Industry Leaders
Smiths Detection Group Ltd.
Rapiscan Systems, Inc.
Teledyne Technologies Incorporated
Bruker Corporation
Leidos Holdings, Inc.
- *Disclaimer: Major Players sorted in no particular order

Market Opportunities and Future Outlook
Qualification pathways and harmonization efforts create space for OEMs that can meet evolving certification and test requirements with upgradeable hardware and auditable software baselines. The TSA has maintained an open QPL process for ETD, with agency-backed qualification testing support for the first set of submitted products, which reduces the practical barrier for new or refreshed platforms in US procurements when they meet required test and security conditions. In Europe, ECAC work on harmonized routine testing methodologies for explosive detection equipment, alongside frequent updates to CEP-related equipment lists, supports configuration-managed upgrades and service models that keep deployed fleets aligned with approved states.
R&D programs also point to near-term product opportunities around lower-contact sampling, improved vapor detection, and embedded analytics. DHS S&T has highlighted next-generation ETD development themes such as non-contact sampling approaches and machine-learning-based detection algorithms that can be incorporated into deployed systems, supporting retrofit and software-led upgrade offerings rather than only full platform replacement. At the same time, compliance-driven modernization in cargo screening continues to act as a catalyst for scalable deployments, where OEMs package equipment, consumables, and remote diagnostics into multi-year agreements that match operator throughput and audit requirements.
Recent Industry Developments
- July 2026: Smiths Detection has officially completed its transition from Smiths Group to CVC Capital Partners. The ownership shift may drive investment in R&D and a stronger product portfolio emphasis in explosive trace detection and security screening.
- August 2025: Bruker Corporation announces multi-year contracts and framework agreements for explosives and chemical trace detection solutions, including deployments at major airports. The capacity expansion strengthens Bruker’s installed base and recurring revenue in ETD, expanding presence in European and Middle Eastern airports.
- May 2025: Rapiscan Systems Ltd. is awarded UK Department for Transport contract extension for maintenance and consumables for ETD machines through July 2025. The extension secures service revenue and continuity of ETD deployments in the UK market.


Research Methodology Framework and Report Scope
Market Definition and Coverage
This market is defined as the revenues generated from explosive trace detection systems used to find trace-level explosive residues or vapors in security screening, inspection, and defense settings, including related hardware and standard in-scope software that enables detection and alarm decisions.
Scope exclusions: Services-only contracts, general CCTV access control, and non-trace bulk X-ray or CT screening systems are excluded unless sold as an ETD unit within the defined product scope.
Segmentation Overview
- By Product Type
- Handheld
- Portable/Movable
- Fixed
- By Detection Technology
- Ion Mobility Spectrometry (IMS)
- Mass Spectrometry (MS)
- Raman and FTIR Spectroscopy
- Differential Ion Trap Mobility
- Colorimetric and Chemiluminescence
- By Sampling Mode
- Particle-swab
- Vapor-sniffer
- Dual Mode
- By End Use Sector
- Commercial
- Defense
- Critical Infrastructure and Law Enforcement
- Cargo and Logistics
- By Geography
- North America
- United States
- Canada
- Mexico
- Europe
- Germany
- United Kingdom
- France
- Russia
- Rest of Europe
- Asia-Pacific
- China
- Japan
- India
- South Korea
- Rest of Asia-Pacific
- South America
- Brazil
- Rest of South America
- Middle East and Africa
- Middle East
- United Arab Emirates
- Saudi Arabia
- Rest of Middle East
- Africa
- South Africa
- Rest of Africa
- Middle East
- North America
Data Sources, Market Sizing, and Validation
Desk Research
Desk research starts with public procurement, regulation, and traffic indicators that shape ETD demand, because checkpoints and cargo screening deployments are usually driven by compliance requirements and throughput targets. We refer to government and aviation security sources such as the US TSA, the European Commission and EASA publications, ICAO guidance, and FAA and DOT datasets where relevant, which help anchor checkpoint and cargo screening expectations.
To keep the model grounded, we also review trade and production signals and technical adoption cues, such as UN Comtrade for related equipment flows, NIST references for detection and testing language, and peer-reviewed journals that cover ion mobility spectrometry and sampling performance. Company filings, annual reports, investor presentations, and reputable press are used to cross-check product positioning and regional exposure, and selective paid subscriptions for company financials, contracts and tenders, and patent databases are used to validate the timing of large programs and the direction of innovation. These desk research sources are illustrative only, and many other public and paid references were also used for data collection, validation, and clarification.
Primary Interviews and Surveys
Primary work is used to convert policy and traffic signals into realistic adoption and replacement rates, since installed-base refresh cycles and swab consumables behavior vary by site type. We speak with a mix of security equipment manufacturers, channel partners, airport and cargo screening stakeholders, and defense procurement and program contacts across major regions, which helps close gaps on average selling prices, calibration of false-alarm expectations, and typical deployment density per lane or checkpoint.
Responses are also used to sanity-check where demand is accelerating, such as cargo mandates, airport expansion programs, and border modernization, and then to adjust assumptions before final sizing.
Distribution of primary research fieldwork respondents
| Company type | Respondent position | Region |
|---|---|---|
| Top tier: 32% | CXOs: 12% | APAC: 40% |
| Mid tier: 48% | Functional/Unit leaders: 33% | EMEA: 36% |
| Smaller Players: 20% | Managers: 55% | Americas: 24% |
Market-Sizing & Forecasting
Sizing begins with a top-down reconstruction of the addressable screening footprint, where passenger and cargo throughput indicators are translated into lanes, checkpoints, and inspection points that typically require ETD coverage. After that, totals are corroborated with selective bottom-up approximations, including sampled device ASPs multiplied by expected annual unit demand, plus channel checks on replacement cycles, which are then used to adjust the final market value.
Key inputs used in the model include airport passenger traffic growth, air cargo screening and compliance timelines, replacement cycles for handheld and fixed units, the share of sites shifting from particle to dual-mode sampling, and observed ASP dispersion by product form factor and detection technology. When coverage data is incomplete for smaller facilities, gaps are handled through penetration-rate assumptions tied to facility class and regulatory pressure, and then reviewed again through expert feedback.
Forecasting is built using scenario analysis supported by variable-level expectations from interviews, because procurement can shift with security events and budget cycles. A base case is produced by tracking the timing of regulatory milestones, airport expansion schedules, and typical procurement lead times, and then applying price and mix effects in a way that stays easy to trace and reproduce.
Data Validation & Update Cycle
Validation is done through multiple checks so that the final value is not driven by one data series. We compare model outputs against independent signals such as aviation throughput trends, public budget or program announcements, and shipment and tender visibility, and then investigate any large variances before sign-off.
Anomalies are flagged when implied unit volumes or ASPs drift outside the interview-confirmed range, and follow-up calls are triggered when a major program, mandate, or procurement timeline looks inconsistent across sources. Reports are refreshed annually, with interim updates when material events occur, and a final pre-delivery review is completed so clients receive the most current view available at release time.
Mordor Intelligence's Explosive Trace Detection Market Size Measured Against Other Published Estimates
Published market sizes for explosive trace detection often do not line up because each publisher makes different choices on what counts as ETD, which end uses are included, and how long replacement cycles are assumed to be. Differences also come from whether estimates treat large procurement years as one-time spikes or smooth them across a multi-year budget window, and how currency timing is handled.
The main gap comes from whether adjacent bulk screening systems and broader "trace screening" bundles are counted together, where Mordor Intelligence restricts the scope to ETD equipment revenue across handheld, portable, and fixed systems and keeps the mix and ASP movement tied to technology and sampling mode shifts that were rechecked through primary validation.
Benchmark comparison
| Source | Market Size | Gaps in Research Methodology |
|---|---|---|
| Mordor Intelligence | USD 1.85 B (2026) | |
| Trade Data Publisher A | USD 1.80 B (2024) | Uses a 2024 base with a shipment-oriented framing and a type split that can pull in vehicle-mounted and broader inspection deployments differently, which can shift the revenue-year alignment versus procurement timing. |
| Market Tracking Site B | USD 1.83 B (2025) | Extends the horizon to 2033 and presents a general ETD total without clear separation of product form factors and sampling-mode mix, which can change how ASP progression and replacement intensity are applied. |
Overall, the spread is mainly explained by scope edges and timing choices rather than a disagreement that demand exists. By keeping assumptions traceable to throughput, compliance triggers, and realistic replacement and pricing ranges, the final number stays easier to reproduce and update when procurement or regulations shift.


Key Questions Answered in the Report
What is the current size of the explosive trace detection market?
The explosive trace detection market stands at USD 1.85 billion in 2026 and is projected to rise to USD 2.72 billion by 2031.
Which product category leads the explosive trace detection market?
Handheld detectors hold the lead, capturing 52.95% revenue in 2025 thanks to their operational flexibility.
Why is the cargo and logistics sector growing fastest?
A European Union mandate requiring 100% cargo ETD by 2026 pushes global logistics firms to invest, resulting in a 9.79% forecast CAGR for this segment.
Which region will experience the quickest growth in explosive trace detection spending?
The Middle East and Africa region is expected to expand at a 10.18% CAGR through 2031, driven by multi-billion-dollar airport megaprojects.
How are artificial-intelligence tools improving explosive trace detection systems?
AI-enabled algorithms cut false-alarm rates by up to 40%, accelerating passenger throughput while maintaining sensitivity.
What is the biggest operational cost restraint for explosive trace detection operators?
The recurring purchase of single-use consumable swabs, priced between USD 2 and USD 15 each, significantly inflates total cost of ownership for high-volume checkpoints.
Page last updated on:






