
Expandable Graphite Market Size and Share
Market Overview
| Study Period | 2021 - 2031 |
|---|---|
| Market Volume (2026) | 89.12 kilotons |
| Market Volume (2031) | 129.20 kilotons |
| Growth Rate (2026 - 2031) | 7.71 % |
| Fastest Growing Market | Asia Pacific |
| Largest Market | Asia Pacific |
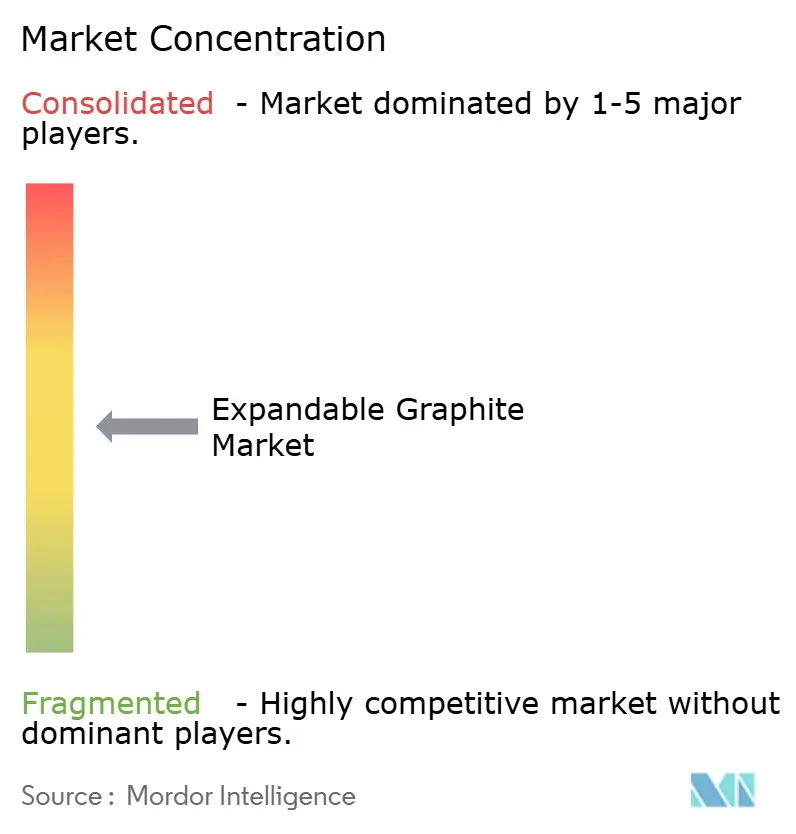
| Market Concentration | Medium |
Major Players *Disclaimer: Major Players sorted in no particular order Image © Mordor Intelligence. Reuse requires attribution under CC BY 4.0. | |
Expandable Graphite Market Analysis by Mordor Intelligence
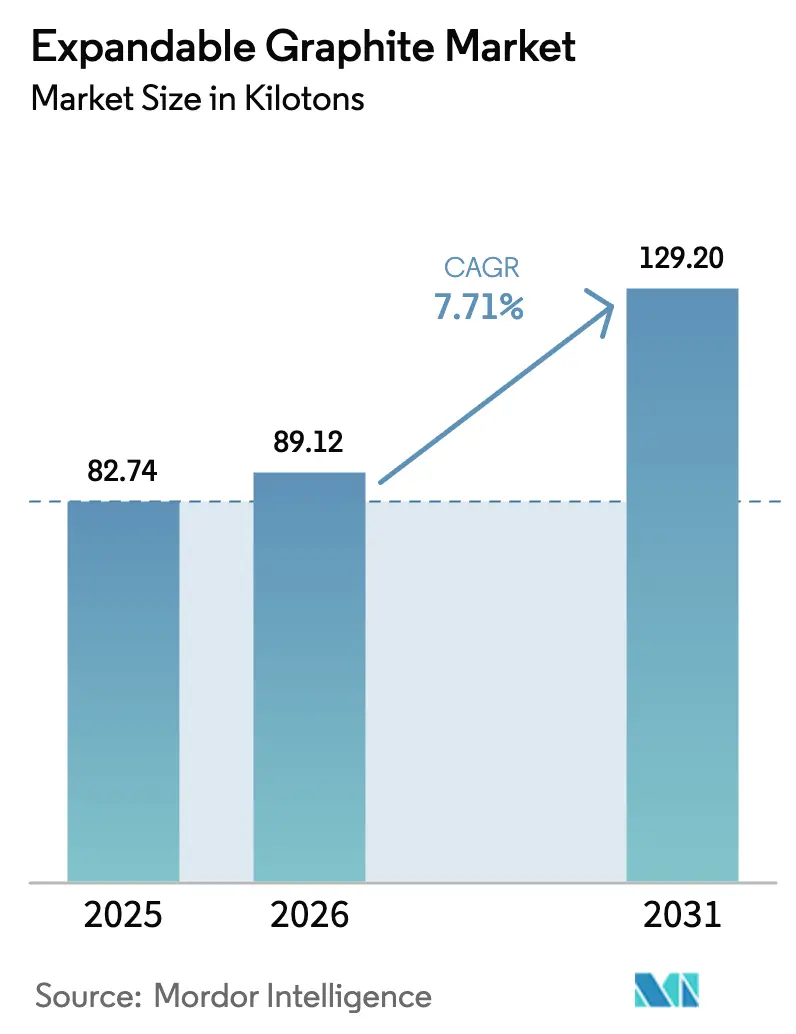
The Expandable Graphite Market size is expected to grow from 82.74 kilotons in 2025 to 89.12 kilotons in 2026 and is forecast to reach 129.20 kilotons by 2031 at a 7.71% CAGR over 2026-2031. Robust demand for halogen-free flame-retardant systems in electronics housings and high-rise construction, coupled with surging electric-vehicle (EV) battery thermal-management requirements, underpins this growth trajectory. Regulatory actions such as the European Chemicals Agency’s 2024 restriction on hexabromocyclododecane accelerate substitution toward expandable graphite char formers. Meanwhile, the International Energy Agency highlighted a 40% jump in battery-grade graphite demand in 2023, confirming the structural pivot from refractory uses to energy-storage and electronics applications. China’s December 2023 export controls on natural graphite further tightened global feedstock availability, prompting automakers and battery manufacturers to finance ex-China purification hubs that comply with the Inflation Reduction Act sourcing rules. Together, these shifts reinforce the positive outlook for the expandable graphite market.
Key Report Takeaways
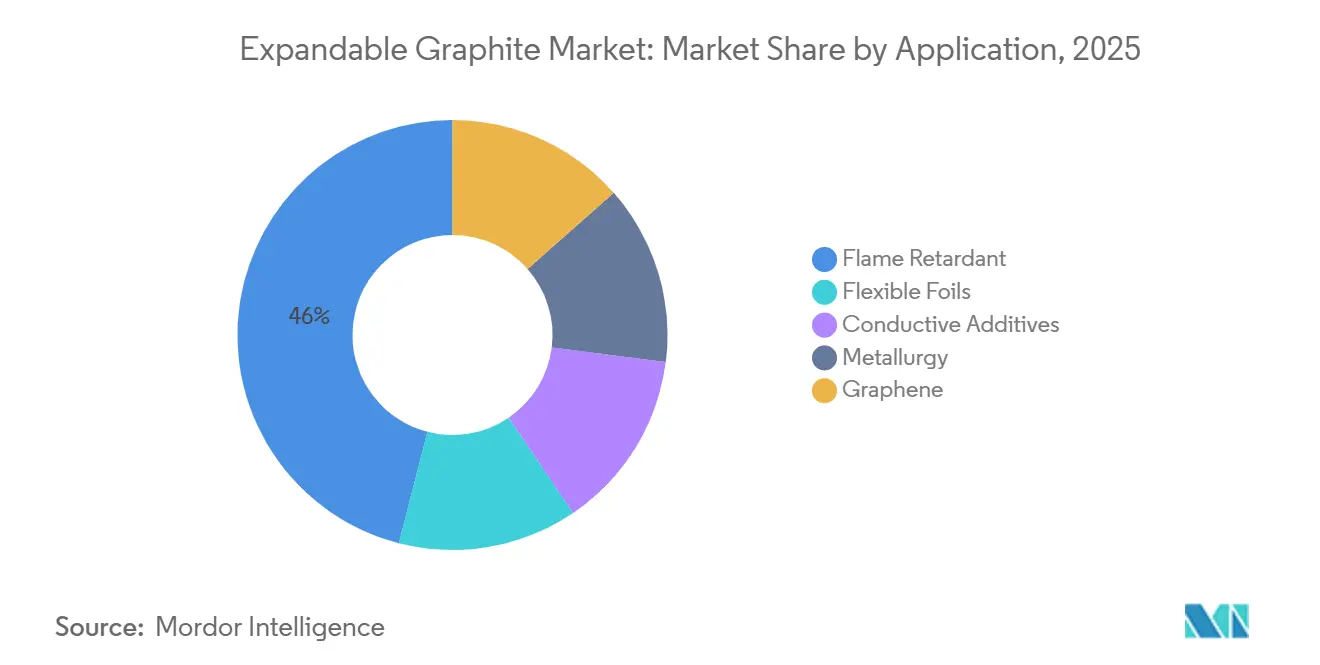
- By application, flame retardants led the expandable graphite market with 45.97% of the market share in 2025, and this segment is expected to advance at an 8.05% CAGR through 2031.
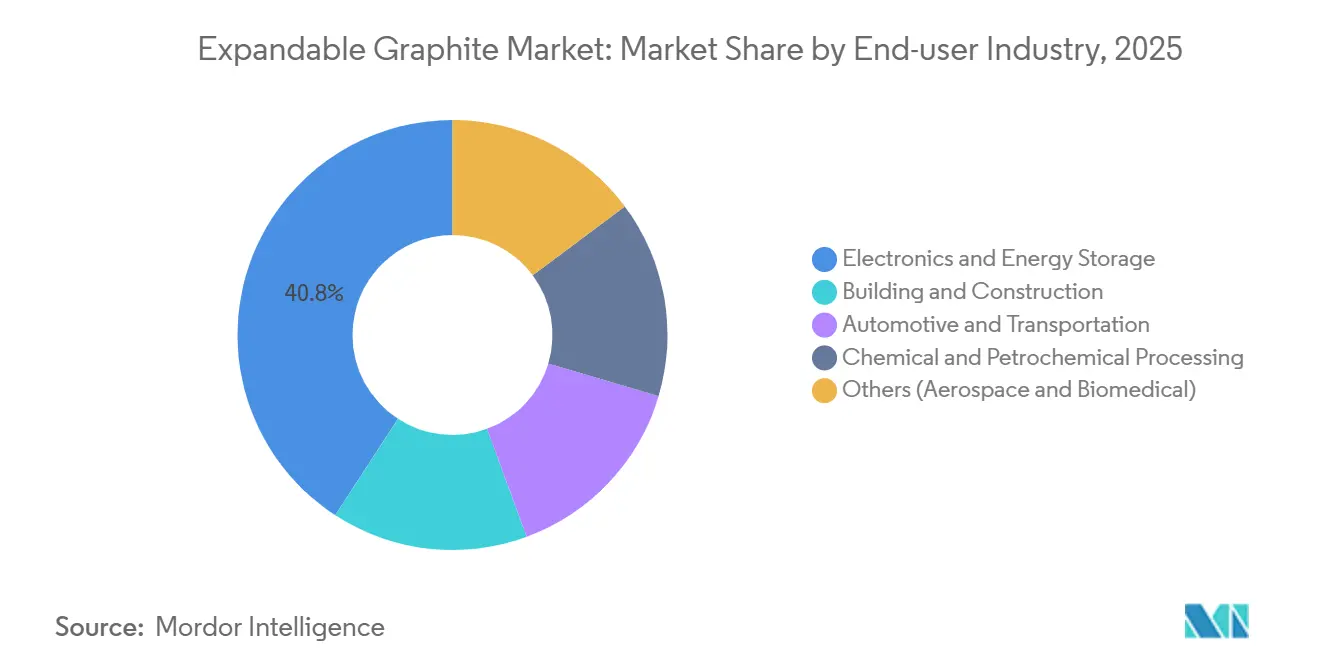
- By end-use industry, electronics and energy storage commanded a 40.82% share of the expandable graphite market size in 2025 and are expected to expand at an 8.46% CAGR through 2031.
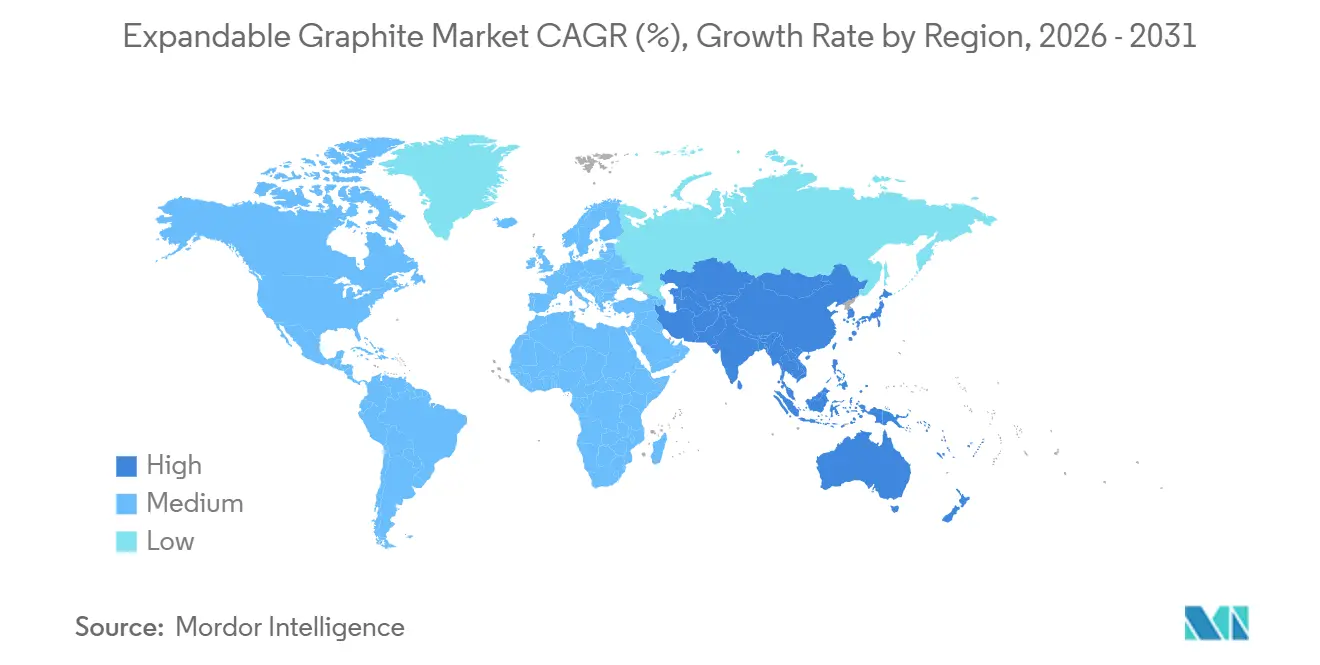
- By region, the Asia-Pacific captured 57.51% of the volume in 2025 and is expected to register the fastest regional CAGR of 8.19% from 2026 to 2031.
Note: Market size and forecast figures in this report are generated using Mordor Intelligence’s proprietary estimation framework, updated with the latest available data and insights as of January 2026.
Market Trends and Insights
Drivers Impact Analysis of Expandable Graphite Market*
| Driver | (~) % Impact on CAGR Forecast | Geographic Relevance | Impact Timeline |
|---|---|---|---|
| Halogen-free flame-retardant adoption surge | +1.8% | Global, led by EU and North America | Medium term (2–4 years) |
| EV battery and thermal-management boom | +2.3% | Asia-Pacific core, spill-over to North America and EU | Long term (≥ 4 years) |
| Tightening global fire-safety codes | +1.2% | Global, strongest in EU and select Asia-Pacific markets | Short term (≤ 2 years) |
| Demand for high-conductivity foils in electronics | +1.5% | China, Japan, South Korea, United States | Medium term (2–4 years) |
| Next-generation intumescent products for 3D-printed parts | +0.9% | United States, Germany, France | Long term (≥ 4 years) |
| Source: Mordor Intelligence | |||
Halogen-free Flame-retardant Adoption Surge
Regulators on both sides of the Atlantic are phasing out brominated and chlorinated additives. The European Chemicals Agency finalized REACH Annex XVII restrictions on HBCDD in 2024, compelling formulators to pivot toward intumescent systems in polystyrene foams and polyurethane coatings[1]. Similar momentum in California’s Proposition 65 list and ongoing US EPA reviews drives North American electronics OEMs toward expandable graphite grades that deliver expansion ratios above 250 mL/g. Because most REACH provisions entered force in mid-2024, demand for synergistic blends of expandable graphite and ammonium polyphosphate is now ramping quickly, particularly in wire-and-cable insulation and printed-circuit-board laminates. Germany and the Netherlands have already banned halogenated flame retardants in public infrastructure, yet cost-sensitive Southern European markets still favor legacy additives, suggesting a multi-year conversion window.
EV Battery and Thermal-management Boom
EV battery packs produce localized heat fluxes that aluminum or copper spreaders cannot dissipate without unacceptable mass penalties. Compressing expandable graphite into flexible foils achieves thermal conductivities above 300 W/m·K at densities below 1.9 g/cm³, supporting thinner interfaces between cylindrical or prismatic cells[2]. The International Energy Agency projects that battery-grade graphite demand will quadruple by 2040 under net-zero scenarios, with thermal-management applications capturing an increasing slice. Automakers are qualifying expandable-graphite foils for cell-to-pack architectures in 800-volt systems, while Western OEMs finance domestic purification capacity, Graphite One’s Ohio facility is a prime example, to align with US sourcing incentives. This convergence of battery and thermal-management supply chains positions the expandable graphite market for durable expansion.
Tightening Global Fire-safety Codes
The International Code Council’s 2024 update to the International Building Code tightened flame-spread and smoke-development requirements for structures exceeding 75 ft, mandating intumescent coatings on steel columns and doors. Coatings loading 15%–20% expandable graphite can double fire-resistance ratings from 60 min to 120 min, meeting the revised thresholds without increasing dry-film thickness. Enforcement is rigorous in Singapore and Hong Kong, but less consistent in emerging Southeast Asian cities, resulting in uneven near-term uptake. The European Union’s Construction Products Regulation likewise requires CE marking and harmonized test reports, favoring suppliers that already possess ISO 9001 and EN 13501 data.
Demand for High-conductivity Foils in Electronics
Proliferation of 5G base stations, edge servers, and foldable phones intensifies thermal challenges in compact footprints. Flexible graphite foils manufactured through intercalation, high-temperature expansion, and calendaring offer in-plane conductivity above 400 W/m·K and can be die-cut to fit complex geometries. Japan’s graphite-sheet market grew from USD 200 million in 2022 to an estimated USD 400 million by 2030, reflecting strong domestic handset and semiconductor output. Semiconductor packaging already specifies graphite foils between chiplets and integrated heat spreaders, while synthetic foils command premium pricing because of lower thermal-expansion mismatch with silicon.
Restraints Impact Analysis of Expandable Graphite Market*
| Restraint | (~) % Impact on CAGR Forecast | Geographic Relevance | Impact Timeline |
|---|---|---|---|
| Supply constraints in jumbo-flake graphite | -1.1% | Global, acute in battery-grade processing | Short term (≤ 2 years) |
| Price volatility of flake and reagents | -0.8% | Asia-Pacific, North America | Medium term (2–4 years) |
| Stricter wastewater and acid-emission rules | -0.6% | North America, EU, China | Long term (≥ 4 years) |
| Source: Mordor Intelligence | |||
Supply Constraints in Jumbo-flake Graphite
Expandable graphite relies on +80 mesh jumbo flake, which represents less than 15% of natural-graphite output and commands premiums of 30%–50% over finer grades. China dominates reserves in Heilongjiang and Inner Mongolia, yet environmental inspections and output quotas capped production growth below 5% after 2024. The United States remains fully import-reliant, sourcing 43% of its supply from China in 2024. New capacity in Mozambique’s Balama and Tanzania’s Epanko projects offers alternatives, but logistics challenges, port congestion, and irregular rail services inflate costs by up to 15%, constraining supply for flame-retardant and foil producers.
Price Volatility of Flake and Intercalation Reagents
A steep 2023 price drop for flake graphite, followed by stabilization near USD 1,100 per tonne in 2024, sowed procurement uncertainty. Intercalation uses sulfuric or nitric acid, commodities whose prices correlate with refinery capacity; Asian sulfuric-acid prices spiked 20% in mid-2024 after outages in South Korea. Large integrated players that secure captive acid or synthetic-graphite routes mitigate exposure, but most mid-tier firms absorb volatility through inventory adjustments. Absent a liquid futures market, expandable-graphite buyers rely on fixed-price contracts that merely redistribute, rather than remove, price risk.
*Our forecasts treat driver/restraint impacts as directional, not additive. The impact forecasts reflect baseline growth, mix effects, and variable interactions.
Expandable Graphite Market Segment Analysis
By Application:
Flame Retardants Drive Volume, Foils Capture PremiumFlame-retardant compounds accounted for 45.97% of the 2025 volume and are projected to expand at 8.05% to 2031. This dominant position stems from regulatory bans on brominated additives and the ability of expandable graphite to deliver intumescence at 15%–25% loading levels, easily achieving UL 94 V-0 ratings. Flexible foil applications, while representing a smaller slice of the expandable graphite market size, command 3–5 times higher pricing because of demanding purity and calendaring specifications. Foil growth lags at roughly 6.5% but benefits from rising EV thermal-management and semiconductor packaging deployments.
Conductive additives for lithium-ion electrodes and polymer composites are the fastest-growing niche, driven by energy-storage expansion and a need for lightweight conductive fillers in electric-vehicle components. Metallurgy applications, once the primary outlet for natural graphite, now contribute a modest share as steelmakers shift to synthetic carbons with tighter particle-size distributions. Experimental graphene production from expandable graphite remains commercially immature because yields are below 10% and solvent costs are high.

By End-use Industry:
Electronics and Energy Storage Outpace ConstructionElectronics and energy storage absorbed 40.82% of 2025 demand and will advance at an 8.46% CAGR through 2031, a trend rooted in 5G rollouts, battery proliferation, and device miniaturization that mandates advanced thermal-interface materials. Building and construction records a slower CAGR, reflecting cyclical residential activity and uneven adoption of halogen-free coatings outside Northern Europe.
Automotive and transportation applications are expanding as Euro 7 emission norms and EV platform shifts prioritize lightweight, high-temperature gasket solutions that include flexible graphite. Chemical processing remains a stable but low-growth end-market characterized by long replacement cycles in refineries and petrochemical plants. Aerospace and biomedical opportunities are still embryonic, yet could accelerate once additive-manufactured parts and implantable devices clear regulatory hurdles.
Geography Analysis
APAC Expandable Graphite Market
Asia-Pacific commanded 57.51% of 2025 volume and is forecast to grow at 8.19% to 2031, cementing its leadership in the expandable graphite market. Qingdao’s cluster of Heilong, Jinhui, Yanxin, and Mingheda leverages proximity to jumbo-flake mines and mature sulfuric-acid supply chains, producing as much as 70% of global expandable-graphite output. China’s December 2023 export license regime incentivized local offtake, tightened external supply, and nudged Western buyers to diversify. Japan and South Korea focus on high-purity foils; Japan’s graphite-sheet market will double to USD 400 million by 2030 as smartphone and semiconductor output climbs. India’s Production-Linked Incentive scheme spurs Tirupati Graphite’s Sagar project, aimed at 10,000 tonnes per year by late 2026.
North America Expandable Graphite Market
North America's market share should grow substantially as OEMs align with the Inflation Reduction Act sourcing rules. Graphite One’s USD 435 million Ohio processing plant, set for late 2026 completion, targets 25,000 tonnes of synthetic anode and expandable graphite, leveraging an 85-acre site with multimodal logistics. Although Canada investigates Quebec and Ontario deposits, commercial extraction remains years away, preserving near-term import reliance. Mexico’s automotive wire-harness market illustrates demand growth for halogen-free flame retardants in the regional supply chain.
Europe Expandable Graphite Market
Europe’s market share volume is led by Germany, France, and the United Kingdom. The EU Construction Products Regulation mandates EN 13501-certified intumescent coatings, elevating barriers for entrants lacking accredited test data. Scandinavian retrofit subsidies for energy-efficient buildings drive halogen-free insulation uptake, whereas Southern Europe remains price sensitive. Eastern European demand rises in renewable-energy cable installations financed by EU cohesion funds.
Regulatory Landscape
Expandable graphite demand is increasingly shaped by fire-safety and chemical-substitution rules that favor halogen-free intumescent systems. In Europe, the European Chemicals Agency (ECHA) finalized REACH Annex XVII restrictions on hexabromocyclododecane (HBCDD) in 2024, accelerating the replacement of brominated flame retardants in insulation and building-material applications where expandable graphite functions as a char former.
Trade and compliance requirements also affect upstream availability and downstream qualification. China tightened controls on natural graphite exports through a license-based regime effective December 1, 2024, which increases lead time and documentation needs for cross-border flake supply supporting expandable graphite production. On the performance side, product adoption in construction and industrial coatings is anchored to test standards such as ASTM E-84 for surface burning characteristics, alongside structural fire-protection protocols referenced in the market (including ASTM E119 and UL 263 for steel protection systems).
Value Chain Analysis
The value chain starts with sourcing jumbo-flake natural graphite (or synthetic alternatives for select grades), followed by purification, intercalation (commonly using strong acids), controlled high-temperature expansion, milling/classification, and compounding or conversion into downstream forms such as intumescent additives and flexible graphite foils. Supply risk concentrates in feedstock procurement, where producers manage quality and continuity through diversified sourcing and, in some cases, vertically integrated mining-to-processing operations; for example, Nacional de Grafite runs integrated mining and processing in Minas Gerais, Brazil, supported by ISO 9001/9002-certified quality systems.
Midstream and downstream value creation increasingly depends on application-specific processing and qualification. Producers such as SGL Carbon carry out expanded graphite production in Europe and the United States and emphasize diversified natural-graphite supply chains across regions (including the Americas and Africa) to reduce single-country exposure. Qualification cycles and specification lock-in at the end-user level (electronics, energy storage, coatings, and construction materials) raise the importance of technical service, test data packages, and long-term contracting, illustrated by SGL Carbon signing a 10-year framework agreement with X-energy in January 2026 (initial production planned for the second half of 2026), which can influence capacity planning and raw-material procurement across the chain.
Competitive Landscape
The Expandable Graphite market is moderately concentrated. SGL Carbon and NeoGraf use in-house synthetic-graphite routes to sidestep jumbo-flake shortages, sustaining gross margins 5–8 percentage points above competitors reliant on merchant feedstock. Chinese firms compete on cost; however, new wastewater rules and export licensing narrow their traditional advantage. Government-backed entrants add competitive pressure. The US Department of Defense funded feasibility studies for domestic intercalation under the Defense Production Act, and Graphite One’s Ohio complex illustrates this policy-driven capacity build-out.
Expandable Graphite Industry Leaders
-
SGL Carbon
-
NeoGraf Solutions LLC
-
Nacional de Grafite
-
Yichang Xincheng Graphite Co., Ltd.
-
Qingdao Jinhui Graphite Co., Ltd.
- *Disclaimer: Major Players sorted in no particular order
Expandable Graphite Market Companies Covered in this Report
- BariteWorld
- KAIYU INDUSTRIAL (HK) LIMITED (Nanjing GRF Carbon Material Co. Ltd)
- Metachem Manufacturing Company Pvt. Ltd
- Nacional de Grafite
- NeoGraf
- Qingdao Heilong Graphite Group Co., Ltd.
- Qingdao Jinhui Graphite Co. Ltd
- QINGDAO MINGHEDA GRAPHITE NEW MATERIAL CO. LTD
- QINGDAO YANXIN GRAPHITE PRODUCTS CO. LTD
- SGL Carbon
- Shijiazhuang ADT Carbonic Material Factory
- TIRUPATI GRAPHITE PLC
- Yichang Xincheng Graphite Co. Ltd
Market Opportunities and Future Outlook
A white-space area is higher-value, standards-driven fire protection in buildings and infrastructure, where expandable graphite-centered intumescent systems are formulated to meet demanding fire-test regimes for steel and substrates (including ASTM E119, UL 263, and UL 1709, alongside ASTM E-84 in surface-burning contexts). NeoGraf Solutions has continued to develop GrafGuard expandable graphite-centered coating approaches for structural steel, reinforcing productization and formulation work that supports broader penetration into protective coatings beyond traditional polymer compounding.
Another opportunity cluster is thermal-management components for electrified mobility and advanced electronics, where flexible graphite heat spreaders and barriers compete on conductivity, thickness, and manufacturability. NeoGraf Solutions positions SpreaderShield flexible graphite heat spreaders for battery thermal management to address thermal propagation and cell performance, indicating a route for expandable-graphite-derived foils and engineered components to move deeper into battery pack and module designs. On the supply side, localization of processing outside China is an active theme: International Graphite and Alkeemia agreed to develop a graphite processing hub at Porto Marghera, Italy, targeting 10,000 tonnes per annum of products including expandable graphite, which directly addresses European buyers seeking shorter, more transparent supply chains amid tighter Chinese export licensing.
Recent Industry Developments in Expandable Graphite Market
- June 2026: International Graphite signs binding joint venture with Alkeemia to develop a graphite processing hub at Porto Marghera, Italy, targeting initial production of 10,000 tonnes per annum. The hub localizes the supply chain and diversifies Europe-based processing capacity, reducing reliance on non-Western feedstock.
- April 2026: NeoGraf Solutions publishes GrafGuard expandable graphite centered coatings development for structural steel to improve intumescent fire protection. The GrafGuard coatings expand downstream applications and branding for expandable graphite materials, broadening the addressable coatings market.
- January 2026: SGL Carbon signs 10-year framework and initial 3-year contract with X-energy to supply medium-grain graphite for Xe-100 small modular reactors. This entrenches graphite supply into the nuclear energy segment and expands growth into energy generation applications.
Expandable Graphite Market Report Scope and Research Methodology
Market Definition and Coverage
We size the expandable graphite market as demand for chemically intercalated natural flake graphite that expands when heated, counted at the point it is sold as expandable graphite for industrial use across regions.
Scope exclusions: We exclude synthetic graphite products and graphite materials sold only as standard flake, amorphous, or other non-expandable forms.
Segments Covered in This Report
- By Application
- Flame Retardant
- Flexible Foils
- Conductive Additives
- Metallurgy
- Graphene
- By End-use Industry
- Building and Construction
- Electronics and Energy Storage
- Automotive and Transportation
- Chemical and Petrochemical Processing
- Others (Aerospace, Biomedical)
- By Geography
- Asia-Pacific
- China
- Japan
- South Korea
- India
- Rest of Asia-Pacific
- North America
- United States
- Canada
- Mexico
- Europe
- Germany
- United Kingdom
- France
- Italy
- Rest of Europe
- South America
- Brazil
- Argentina
- Rest of South America
- Middle East and Africa
- Saudi Arabia
- South Africa
- Rest of Middle East and Africa
- Asia-Pacific
Data Sources, Market Sizing, and Validation
Desk Research
Desk research is used to set the market boundaries and anchor the model to real-world signals that can be checked independently. We typically pull trade and production context from sources such as the US Geological Survey (USGS), UN Comtrade, and national mining or geological agencies that publish minerals statistics.
To connect demand, we also review non-paywalled references such as fire safety and building-code publications where halogen-free flame retardants are discussed, plus energy and battery outlooks from agencies such as the International Energy Agency. We also use peer-reviewed papers on intercalation chemistry and graphite expansion behavior. Company filings, sustainability reports, and investor decks help map capacity additions, product positioning, and end-use exposure, and then patent databases plus a news and financials subscription are used to confirm timing of new grades and plant announcements. These examples are not exhaustive, and many other public documents were reviewed to collect, cross-check, and clarify inputs.
Primary Interviews and Surveys
Primary interviews and surveys are used to stress-test the desk assumptions, especially where public data is not specific to expandable grades. We speak with a mix of producers, processors, distributors, compounders, and downstream users to validate demand shares, typical pricing behavior, and practical substitution limits. We also make sure the coverage spans APAC, EMEA, and the Americas so regional price spreads and supply tightness can be captured consistently.
Distribution of primary research fieldwork respondents
| Company type | Respondent position | Region |
|---|---|---|
| Top tier: 31% | CXOs: 18% | APAC: 43% |
| Mid tier: 51% | Functional/Unit leaders: 36% | EMEA: 30% |
| Smaller Players: 18% | Managers: 46% | Americas: 27% |
Market-Sizing & Forecasting
Our main build uses a top-down approach where graphite supply, trade flows, and downstream consumption signals are used to reconstruct the expandable-graphite demand pool by region, and then the totals are split using application-level adoption checks. To keep the result realistic, the outputs are corroborated with selective bottom-up approximations such as sampled supplier volumes, channel checks, and an ASP-times-volume sanity check for major use cases.
Key inputs that shape the model include natural flake graphite availability by country, the share of flake suitable for intercalation, conversion yields from intercalation and drying, and the pace of halogen-free flame-retardant penetration in construction and electronics. We also track expansion ratio preferences by end use, typical contract versus spot pricing behavior, and freight and energy cost direction because these move delivered ASPs. Forecasts are built using scenario analysis, where demand growth is linked to a small set of drivers that industry participants can validate, then adjusted for capacity additions and expected plant utilization. Where bottom-up coverage is incomplete for smaller suppliers, we bridge the gap using regional average yields and price bands that are rechecked during primary calls.
Data Validation & Update Cycle
We validate the model through triangulation across independent signals, and then run variance checks so the outputs do not conflict with known production, trade, or end-use activity trends. Outliers are reviewed in multiple steps, including a second-analyst review of the assumptions, and re-contacts are triggered when a price, capacity, or regulation shift creates a visible break from the prior view.
Reports are refreshed annually, and interim updates are made when material events occur, such as major capacity commissioning, trade restrictions, or a sharp shift in graphite pricing. Before delivery, a final pass is completed so clients receive the latest market view aligned to the current data cut.
Mordor Intelligence's Expandable Graphite Market Sizing Compared With Other Published Estimates
Published estimates for expandable graphite often differ because they are not always built on the same counting unit, timing, and conversion logic, and that makes like-for-like comparisons harder than it looks. Differences usually show up when one estimate is stated in revenue and another is stated in tons, or when a study blends expandable grades with adjacent graphite products.
The largest gaps typically come from how ASPs are set and updated, how currency conversion is timed, and whether volume-to-value conversions are validated against trade and capacity signals. When these mechanics are not refreshed around major price changes, the total can drift even if the underlying demand picture is similar. For Mordor Intelligence, the annual refresh and spot-check cycle used in the expandable graphite model helps keep these drivers aligned during updates.
Benchmark comparison
| Source | Market Size | Gaps in Research Methodology |
|---|---|---|
| Mordor Intelligence | USD 0.25 B (2026) | |
| Global Consultancy A | USD 0.29 B (2025) | Uses revenue only with a single ASP curve and limited timing detail on FX conversion, which can overstate totals during periods of fast graphite price movement. |
| Trade Journal B | USD 0.35 B (2024) | Appears to combine expandable graphite with expanded graphite materials and applies broad regional averages, which makes the scope and volume-to-value conversion less precise. |
The comparison shows that the spread is mostly explained by scope boundaries and the way pricing is carried forward across years. By keeping the unit economics tied to repeatable checks like regional price bands and capacity and trade signals, the market value conversion stays traceable to clear assumptions that can be revisited during updates.
Key Questions Answered in the Report
What is the current size of the expandable graphite market?
What is the current size of the expandable graphite market?
Which application segment leads demand for expandable graphite?
Which application segment leads demand for expandable graphite?
Why is Asia-Pacific dominant in expandable graphite supply?
Why is Asia-Pacific dominant in expandable graphite supply?
How are EV trends influencing expandable graphite use?
How are EV trends influencing expandable graphite use?
What regulatory actions are driving halogen-free adoption?
What regulatory actions are driving halogen-free adoption?