
Event Management Software Market Size and Share
Market Overview
| Study Period | 2020 - 2031 |
|---|---|
| Market Size (2026) | USD 15.20 Billion |
| Market Size (2031) | USD 24.17 Billion |
| Growth Rate (2026 - 2031) | 9.73 % |
| Fastest Growing Market | Asia Pacific |
| Largest Market | North America |
| Market Concentration | Medium |
Major Players *Disclaimer: Major Players sorted in no particular order Image © Mordor Intelligence. Reuse requires attribution under CC BY 4.0. | |
Event Management Software Market Analysis by Mordor Intelligence
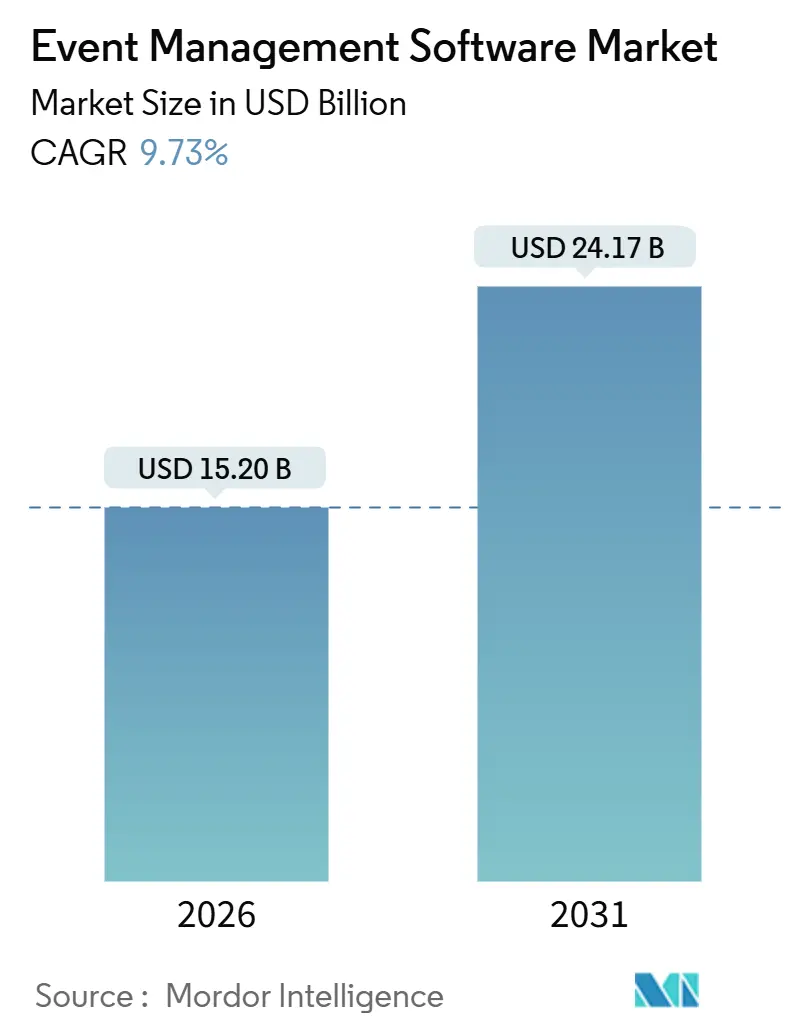
The event management software market size stands at USD 15.2 billion in 2026 and is projected to reach USD 24.17 billion by 2031, reflecting a 9.73% CAGR. Growth is sustained by AI-driven personalization that improves attendee engagement, mandatory sustainability reporting that elevates demand for carbon-analytics modules, and the global roll-out of 5G infrastructure that supports real-time hybrid experiences. Vendors are shifting emphasis from execution tools to revenue attribution, which is boosting investment in analytics and reporting software. Cloud deployment continues to dominate as enterprises consolidate SaaS stacks and seek instant scalability, while self-service ticketing platforms unlock new demand from small and mid-sized venues. Across regions, the event management software market benefits from government-backed MICE infrastructure in the Gulf and accelerating AI adoption in Asia Pacific, although subscription fatigue and data-residency rules temper the overall growth outlook.
Key Report Takeaways
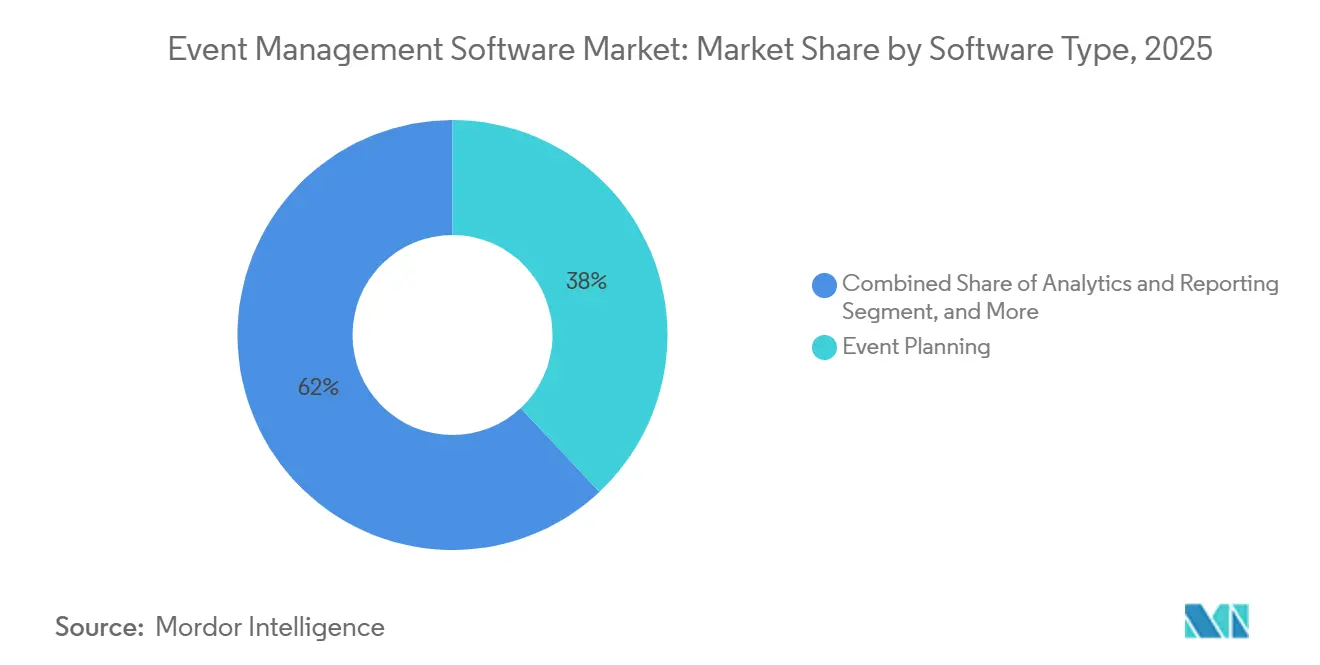
- By software type, Event Planning led with 38.03% revenue share in 2025; Analytics and Reporting is forecast to expand at a 10.22% CAGR through 2031.
- By deployment, Cloud platforms held 71.29% share of the event management software market size in 2025 and are advancing at a 10.91% CAGR through 2031.
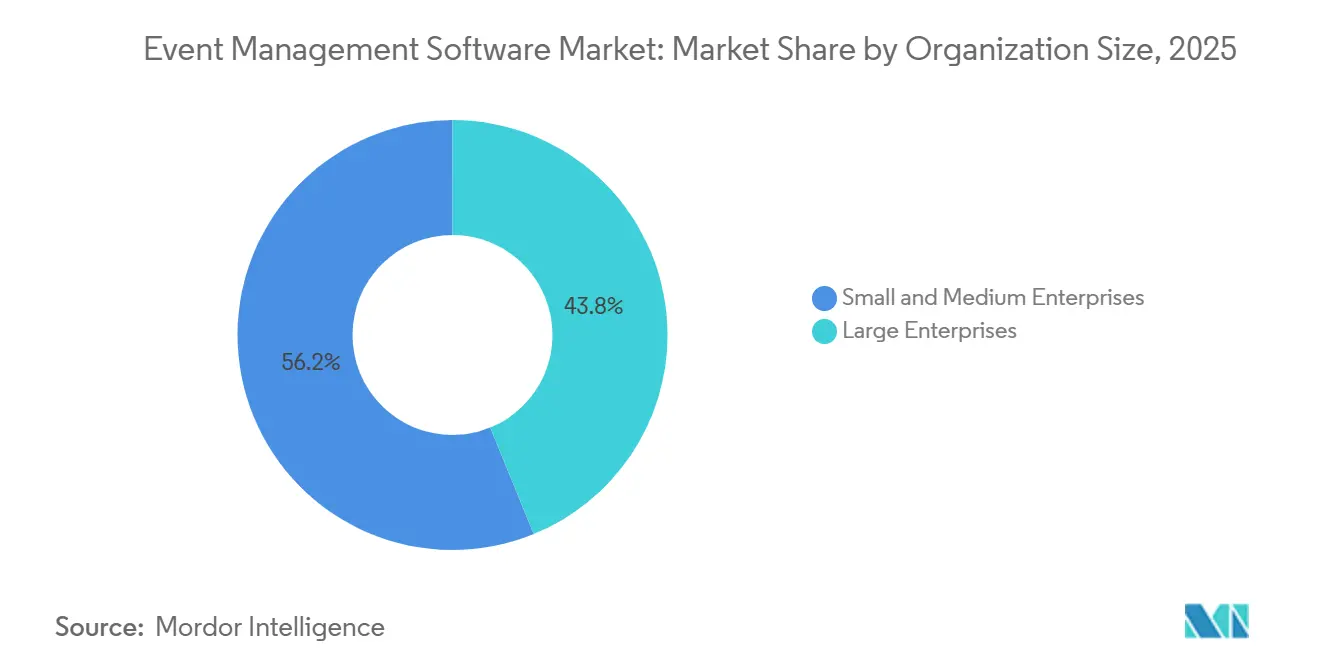
- By organization size, Small and Medium Enterprises accounted for 56.17% of the event management software market share in 2025, growing at a 10.37% CAGR through 2031.
- By end-user vertical, corporate events held 43.25% share in 2025, while Education is projected to post a 10.82% CAGR to 2031.
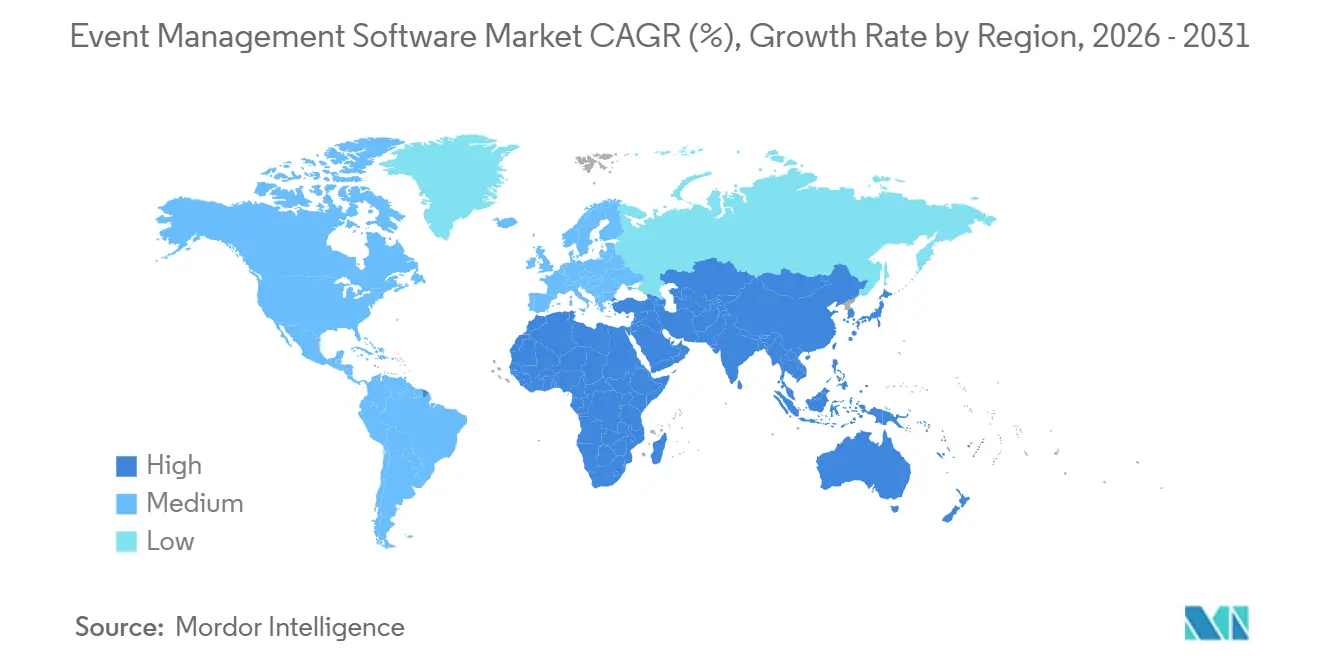
- By geography, North America captured 41.32% share in 2025; Asia Pacific is set to register an 11.01% CAGR through 2031.
Note: Market size and forecast figures in this report are generated using Mordor Intelligence’s proprietary estimation framework, updated with the latest available data and insights as of January 2026.
Market Trends and Insights
Drivers Impact Analysis of Event Management Software Market*
| Driver | (~) % Impact on CAGR Forecast | Geographic Relevance | Impact Timeline |
|---|---|---|---|
| Proliferation of AI-Driven Personalisation Across Virtual, Hybrid and On-site Events | +1.80% | Global, with early adoption in North America and Asia Pacific | Short term (≤ 2 years) |
| Rapid Adoption of Self-Service Ticketing Systems by Small and Mid-Sized Venues | +1.20% | Global, concentrated in North America, Europe, and Latin America | Medium term (2-4 years) |
| Large-Scale Roll-out of 5G and FTTX Enabling Real-Time Interactive Live-Streams | +1.50% | North America, Europe, Asia Pacific core markets; spillover to Middle East | Medium term (2-4 years) |
| Mandatory Sustainability Reporting Boosting Demand for Carbon-Analytics Modules | +0.90% | Europe (leading), North America, Asia Pacific (emerging) | Long term (≥ 4 years) |
| Expansion of Government-Backed MICE Infrastructure in GCC Economies | +1.10% | Middle East (GCC focus: UAE, Saudi Arabia), spillover to Asia Pacific and Africa | Medium term (2-4 years) |
| Growing Uptake of Campus-Wide Event Suites in Higher-Education Consortia | +0.70% | North America, Europe, Asia Pacific (Australia, India) | Long term (≥ 4 years) |
| Source: Mordor Intelligence | |||
AI-Driven Personalization Engines
Event software is evolving from transactional registration tools into predictive engagement hubs that serve tailored agendas, networking recommendations and content in real time. In June 2025 Cvent released CventIQ, a generative-AI module that automates RFP drafting, venue comparison and attendee segmentation, cutting planner workload by 30%.[1] Bizzabo’s Event OS Copilot, introduced in November 2024, applies large-language models to create session summaries and propose fresh breakout topics on the fly.[2] Asia Pacific leads adoption, with 87% of planners already deploying AI features in 2025 compared with 54% in Europe, signalling a two-speed landscape that pressures late adopters. Platforms that fail to embed AI-driven workflows risk commoditization as buyers prioritize engagement intelligence over basic execution.
Self-Service Ticketing for SMEs
No-code ticketing portals let venues with fewer than 500 seats bypass lengthy sales cycles and launch events within hours.[3] Ticket Tailor’s July 2024 upgrade delivered multi-tier pricing and reserved seating that organizers configure without vendor support, shrinking time-to-market from weeks to hours. Customer behaviour data show 81% of buyers attempt self-service resolution before contacting support; venues using automated referral marketing report 15-25% sales uplift. Latin America and Africa are emerging hotspots where fragmented venue landscapes favour transparent pay-per-ticket pricing. As a result, the event management software market now captures a larger volume of low-budget events that incumbents once overlooked.
5G and Fiber Roll-out Empowering Live-Streams
Latency constraints that plagued hybrid events are receding as operators deploy 5G standalone networks and fiber-to-the-x backbones. Vodafone’s February 2025 slice-based trial guaranteed dedicated bandwidth for live concerts, ensuring sub-100-millisecond response times for polling and Q&A. Verizon followed with 4K multi-camera streaming across major U.S. venues in 2025, which turned hybrid sessions into primary revenue generators rather than fallback options. Sponsors now pay premiums for digital engagement metrics only available via interactive streams, prompting vendors to integrate adaptive bitrate encoding, real-time analytics and CDN partnerships that raise technical barriers to entry.
Mandatory Sustainability Reporting
The European Union’s Corporate Sustainability Reporting Directive compels large companies to disclose Scope 3 emissions, including business travel and events. Organizers therefore need carbon calculators that track attendee travel, catering waste and venue energy. ADNEC highlighted such features in 2025 bids to attract multinational conferences, demonstrating that sustainability has become a procurement criterion. Modules aligned with ISO 14064 and the GHG Protocol are drifting from premium add-ons to standard requirements, and vendors without integrated dashboards risk exclusion from corporate RFPs by 2027.
Restraints Impact Analysis of Event Management Software Market*
| Restraint | (~) % Impact on CAGR Forecast | Geographic Relevance | Impact Timeline |
|---|---|---|---|
| Legacy PMS Integration Friction in Developing Regions | -0.80% | Asia Pacific (excluding China, Japan), Africa, Latin America | Medium term (2-4 years) |
| Rising SaaS Subscription Fatigue Among Enterprise Clients | -1.20% | Global, concentrated in North America and Europe | Short term (≤ 2 years) |
| Event Oversaturation and Budget Scrutiny by Corporates | -0.90% | Global, acute in North America and Europe | Short term (≤ 2 years) |
| Data-Residency and Privacy Compliance Complexities | -0.70% | Europe (GDPR), Asia Pacific (China, India), Middle East | Long term (≥ 4 years) |
| Source: Mordor Intelligence | |||
SaaS Subscription Fatigue
Enterprises are reassessing software spend after supplier price hikes averaged double digits in 2025. Because event platforms are used episodically rather than daily, procurement teams target annual licenses for cuts before other applications. Buyers now favour usage-based contracts with escape clauses, prompting vendors to bundle registration, video and analytics in a single contract to minimize churn risk. Platforms unable to articulate clear ROI face elongating sales cycles and discount pressure.
Data-Residency and Privacy Compliance
GDPR, China’s PIPL and emerging sovereign-cloud mandates require region-specific hosting that elevates infrastructure costs while exposing non-compliant vendors to procurement bans. Microsoft’s guidance stresses impact assessments and right-to-erasure workflows even for firms without a European presence. Only a handful of platforms offer multi-region data centers; the rest must partner with local providers or risk being excluded from government and healthcare tenders. Compliance has thus become a competitive moat in the event management software market.
*Our forecasts treat driver/restraint impacts as directional, not additive. The impact forecasts reflect baseline growth, mix effects, and variable interactions.
Event Management Software Market Segment Analysis
By Software Type:
Analytics Modules Capture Post-Event Revenue AttributionAnalytics and reporting tools are the fastest expanding category, clocking a 10.22% CAGR through 2031 as organizers demand proof of ROI. The event management software market size allocated to these modules is projected to widen notably as Cvent integrates Goldcast’s AI-video analytics into its stack, allowing marketers to track viewer drop-offs, content replays and pipeline contribution. Event Planning applications still commanded 38.03% of 2025 revenue, anchoring registration and agenda workflows. However, standalone ticketing platforms risk commoditization unless they embed dynamic pricing and fraud detection that drive measurable yield. Other niche solutions - mobile apps, matchmaking suites and virtual studios - continue to fragment because specialist vendors can out-innovate on feature depth for verticals such as academic conferences or music festivals.
In parallel, enterprise buyers increasingly expect a seamless path from pre-event promotion to post-event attribution. This expectation accelerates consolidation as generalists buy niche analytics leaders to fill capability gaps. The event management software market is therefore transitioning toward unified engagement clouds that treat events as one part of an always-on content engine, rather than isolated occurrences.

By Deployment:
Cloud Platforms Dominate Through Multi-Tenancy EconomicsCloud deployments accounted for 71.29% of 2025 revenue and are growing at 10.91% annually as vendors capitalize on elastic infrastructure and automatic updates. Ticketmaster’s March 2025 TM1 refresh showed the model’s efficiency by handling 5,000 transactions per minute during on-sales before scaling down within hours. The event management software market size attached to on-premises installations remains stable in defense and government circles, where air-gapped networks are mandatory. Digitevent mitigates connectivity gaps in rural markets by offering offline QR scanning that later synchronizes attendee data.
Hybrid architectures combining cloud dashboards with on-site edge devices are emerging as the default compromise, enabling vendors to serve regulated agencies without maintaining separate codebases. Over the forecast period, cloud penetration will continue to expand, but on-premises resilience will persist where sovereignty or connectivity concerns dominate.
By Organization Size:
SMEs Drive Volume Through No-Code PortalsSmall and Medium Enterprises represented 56.17% of 2025 spend, expanding at a 10.37% CAGR as self-service portals shrink setup times and eliminate sales friction. Eventzilla’s Spanish-language interface, updated in October 2024, demonstrates how localization widens reach among Latin American SMEs that lack IT resources. Large Enterprises, by contrast, demand integration depth with Salesforce, SAP and Workday, pushing platforms to build robust APIs and obtain SOC 2 Type II certification. Cvent’s USD 400 million acquisition of ON24 in December 2025 illustrates how vendors unify webinar data with in-person attendance to satisfy enterprise requirements.
Two divergent value propositions therefore coexist within the event management software market: low-touch self-service that trades on price transparency, and high-touch enterprise suites that trade on integration and compliance. Vendors capable of serving both ends, such as Eventbrite’s combination of freemium ticketing and enterprise APIs, stand to capture outsized share.
By End-User Vertical:
Education Outpaces Corporate Through Campus ConsolidationCorporate events retained a 43.25% share in 2025, but Education is the fastest riser at a 10.82% CAGR as universities migrate from departmental point tools to campus-wide suites. Momentus Technologies supported 175 higher-education customers in 2025, enabling institutions to consolidate budgets and drive 30-40% software savings. Modern Campus surged into this space with Conference Manager, which links continuing-education enrolment to alumni engagement, raising attendance by up to 30%.
Government events prioritize security and accessibility, driving demand for FedRAMP authorization and VPAT documentation. Media and Entertainment, including festivals and concerts, emphasize fraud mitigation: Ticket Fairy claims a 99.9% reduction in counterfeit tickets thanks to rotating QR codes. Other verticals healthcare, trade associations gravitate toward vendors that embed specialty features such as CME credit tracking or exhibitor lead retrieval, reinforcing the sector’s segmentation.
Geography Analysis
North America Event Management Software Market
North America held 41.32% of 2025 revenue, underpinned by mature MICE infrastructure and a dense base of Fortune 500 headquarters. Yet cost pressures triggered by travel inflation led 52% of planners to cut international attendance in Q4 2025. Canada and Mexico benefit from near-shoring as U.S. companies pick venues closer to home, but cross-border data-transfer rules under USMCA oblige providers to document residency safeguards. As budgets tighten, the event management software market sees enterprises consolidating vendor lists to a few deeply integrated platforms.
APAC and GCC Event Management Software Market
Asia Pacific is the growth engine, expected to post an 11.01% CAGR through 2031. Cvent’s 2025 Asia Planner survey found 74% of respondents upping event budgets and 88% setting sustainability targets. Gulf Cooperation Council nations add momentum via multi-billion-dollar convention centers and streamlined visa programs. Saudi Arabia recorded 44% MICE growth in 2024, backed by USD 156 million in incentives. India leans on cloud SaaS that integrates UPI payments, whereas China enforces sovereign-cloud deployment, obliging foreign vendors to partner for local hosting.
Europe, the Americas and Africa Event Management Software Market
Europe’s landscape is shaped by GDPR obligations and rising sustainability mandates. Cvent’s April 2025 Europe Planner report noted that 67% of planners raised budgets despite 20% cost inflation. Germany, the United Kingdom and France dominate spend, yet planners increasingly source Eastern European venues for cost relief. South America and Africa remain nascent but promising: local platforms such as Even3 in Brazil and Boletia in Mexico thrive through Pix and Oxxo payment integrations, while South African providers stress offline-first check-in to accommodate patchy connectivity.
Regulatory Landscape
Event management software vendors increasingly operate under overlapping privacy, AI, and accessibility regimes that shape how hybrid events handle attendee data, stream content, and use AI-enabled workflows. In the European Union, GDPR continues to shape consent, retention, and right-to-erasure processes for registration, matchmaking, and marketing modules, while the EU Artificial Intelligence Act (Regulation (EU) 2024/1689) introduces transparency obligations that start applying broadly from August 2, 2026, including for generative-AI features used for agenda creation, session summarization, and attendee communications.
Accessibility and captioning rules are tightening in multiple large markets that influence event video distribution and virtual and hybrid delivery. The UK is implementing Media Act 2024 requirements for the largest VoD services to follow Ofcom accessibility codes (including subtitle and audio-description targets) from 2026, Canada issued CRTC Broadcasting Regulatory Policy 2026-98 with closed-captioning obligations for online streaming services on a defined timeline, and the US FCC set August 17, 2026 as the final compliance deadline for closed-captioning display settings requirements. India also released finalized accessibility guidelines for online curated content (OTT) platforms in February 2026, reinforcing the need for accessible player controls and inclusive content delivery features that event platforms increasingly embed or integrate.
Value Chain Analysis
The event management software value chain starts with core platform R&D (registration, ticketing, agenda, attendee apps, and analytics), cloud infrastructure and identity or security services, and extends into integrations with CRM and marketing automation, payments, streaming and CDNs, and on-site hardware layers such as badge printing and QR scanning. Vendors package these capabilities into SaaS offerings sold via self-serve portals for SMEs and enterprise sales for large organizations, with delivery supported by implementation partners, systems integrators, and app marketplaces that provide connectors to systems like Salesforce and broader martech stacks.
Downstream, organizers, venues, promoters, and agencies rely on the software to coordinate a broader live-events supply chain (talent, production, logistics, catering, and broadcast distribution). Disruptions in physical supply and staffing can therefore increase the pull for more integrated workflows and contingency-ready operations. For example, the October 2024 US dockworkers strike across 36 ports disrupted shipments of event materials and technical gear, increasing costs and delays, while platform consolidation efforts target operational fragmentation highlighted by industry surveys that cite widespread use of multiple separate applications for event execution. Newer all-in-one platforms, such as Backstage Suite (launched June 2, 2025), reflect a move toward consolidating advancing, hospitality, budgeting, and collaboration into a unified system to reduce handoffs between tools.
Competitive Landscape
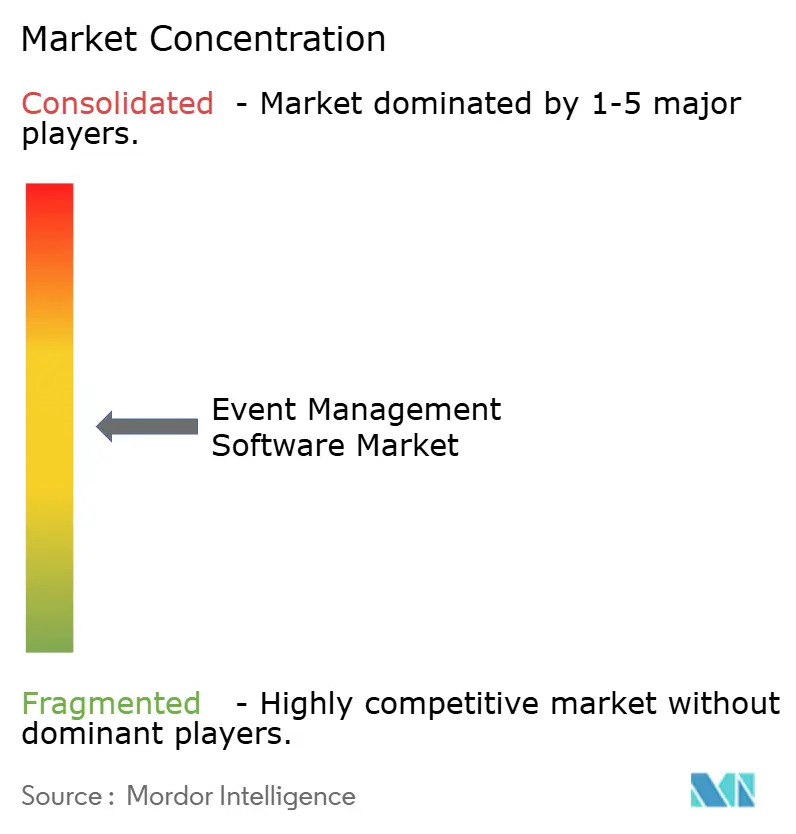
The event management software market is moderately fragmented: Cvent, Eventbrite, Stova, Bizzabo and Hopin collectively command roughly 35-40% of revenue. Private-equity capital is accelerating consolidation. Blackstone paid USD 4.6 billion to acquire Cvent in August 2024, financing bolt-on buys such as Splash and Goldcast that layer creative websites and AI video analytics into the core platform. Vista Equity integrated Tripleseat with its hospitality stack, signalling further roll-ups around venue sourcing and catering management.
Technology differentiation centers on AI and compliance. Bizzabo earned Gartner Leader status in June 2025 for embedding generative AI into matchmaking and content summarization. Ticketmaster upgraded SafeTix in January 2026 to tighten fraud prevention at stadium gates. Smaller challengers such as Ticket Fairy and Opendate target independent promoters with transparent fees and daily payouts, undermining incumbents criticized for opaque pricing.
White-space opportunities revolve around carbon accounting dashboards and hybrid monetization tools that marry sponsor needs with attendee data. Vendors holding SOC 2 Type II, ISO 27001 and region-specific certifications are positioned to win regulated tenders, while non-compliant rivals risk disqualification. Strategic clarity either horizontal breadth or vertical depth will determine winners as the event management software market matures.
Event Management Software Industry Leaders
-
Cvent Inc.
-
Eventbrite Inc.
-
Stova, Inc.
-
Hopin Ltd.
-
ACTIVE Network, LLC
- *Disclaimer: Major Players sorted in no particular order
Event Management Software Market Companies Covered in this Report
- Cvent, Inc.
- Stova, Inc.
- Eventbrite, Inc.
- Tripleseat, Inc.
- ACTIVE Network, LLC
- Momentus Technologies, Inc.
- Certain, Inc.
- SignUpGenius, Inc.
- EMS Software, LLC
- Hopin Ltd.
- Bizzabo Ltd.
- Whova, Inc.
- vFairs LLC
- Splash That, Inc.
- Eventzilla LLC
- Brown Paper Tickets, LLC
- idloom S.A.S.
- TryBooking Pty Ltd
- Hubb, Inc.
- MeetApp, Inc.
Market Opportunities and Future Outlook
AI-assisted operations and measurement-driven event programs are creating whitespace for platforms that connect planning and execution data to revenue attribution, sourcing efficiency, and audience engagement. The market’s shift toward AI-enabled workflows shows up in vendor roadmaps and buyer behavior, including Cvent’s July 2026 announcement of 70+ product innovations supported by a multi-year USD 1 billion technology investment and expanded CventIQ capabilities. This supports demand for analytics and reporting modules that unify in-person and digital engagement signals into enterprise data stacks, aligning with the broader push to rationalize fragmented toolsets.
Hybrid and media-grade event experiences also create opportunities for providers that can integrate reliable streaming, accessibility, and compliance features into event delivery. Regulatory moves in 2026 around accessibility and captioning, including in the UK, Canada, and India and the FCC’s deadline timeline in the United States, raise the value of platforms that offer standardized accessibility controls, captioning support, and governance workflows across regions. At the same time, large-scale event production is adopting more software-defined workflows, including decentralized, software-based production approaches highlighted around the 2026 FIFA World Cup broadcast ecosystem, which reinforces demand for event platforms that can ingest richer real-time engagement data and coordinate multi-format distribution while meeting data-residency and privacy requirements.
Recent Industry Developments in Event Management Software Market
- July 2026: Cvent announced over 70 product innovations at Cvent CONNECT 2026 and outlined a multi-year USD 1 billion technology investment to accelerate platform development. The release emphasized broader AI-powered capabilities inside CventIQ, reinforcing the shift from basic execution features toward automation and measurable outcomes across the event lifecycle.
- July 2025: Stova launched its Event Intelligence Suite to provide real-time, cross-event visibility and reporting for event teams. The product expanded the analytics layer for planners and marketers, aligning with buyer demand for post-event ROI measurement and consolidated dashboards across multiple programs.
- July 2024: Eventbrite partnered with TikTok to simplify event discovery by enabling Eventbrite links to be integrated into TikTok videos. The integration reduced friction from social discovery to ticket purchase, strengthening creator-led distribution and performance marketing for ticketed events.
Event Management Software Market Report Scope and Research Methodology
Market Definition and Coverage
For this study, the event management software market covers paid software platforms used to plan, promote, sell or register, manage attendees, and measure outcomes for in-person, virtual, and hybrid events. Revenues include license or subscription fees tied to these platforms across business, public, and nonprofit use cases.
Scope exclusions: We exclude general CRM or marketing suites that do not have a dedicated event module, along with basic listing portals that only advertise events without operational workflow tools.
Segments Covered in This Report
- By Software Type
- Event Planning
- Event Marketing
- Venue and Ticket Management
- Analytics and Reporting
- Other Software Types
- By Deployment
- Cloud
- On-Premise
- By Organization Size
- Small and Medium Enterprises
- Large Enterprises
- By End-User Vertical
- Corporate
- Government
- Education
- Media and Entertainment
- Other End-User Verticals
- By Geography
- North America
- United States
- Canada
- Mexico
- South America
- Brazil
- Argentina
- Rest of South America
- Europe
- Germany
- United Kingdom
- France
- Italy
- Spain
- Rest of Europe
- Asia Pacific
- China
- Japan
- South Korea
- India
- Australia
- New Zealand
- Rest of Asia Pacific
- Middle East
- United Arab Emirates
- Saudi Arabia
- Turkey
- Rest of Middle East
- Africa
- South Africa
- Nigeria
- Kenya
- Rest of Africa
- North America
Data Sources, Market Sizing, and Validation
Desk Research
Desk work starts with mapping what the product is and how buyers pay for it, then matching that to public signals that show event activity and software adoption. We relied on sources such as the US Bureau of Labor Statistics, US Census Bureau, Eurostat, the International Telecommunication Union, and the World Bank to ground macro indicators that influence event volumes and digital spend.
To connect those broader signals to the software market, we reviewed company annual reports and investor decks, product documentation on vendor websites, and reputable press coverage that discusses pricing, packaging, and feature shifts like virtual and hybrid workflows. Where needed, we also used paid subscription data for company financials and news to confirm revenue-mix hints and corporate actions that can change the addressable scope. The sources listed here are illustrative, and we checked additional public and paid references for data capture, validation, and clarification.
Primary Interviews and Surveys
Primary work focused on interviews and structured surveys with software providers, implementation partners, and event owners who actively purchase and renew these tools. We covered demand patterns across enterprise and mid-market customers and validated regional differences across APAC, EMEA, and the Americas. This then helped refine pricing expectations, attach rates for add-ons, and the split between virtual and in-person driven use.
Distribution of primary research fieldwork respondents
| Company type | Respondent position | Region |
|---|---|---|
| Top tier: 35% | CXOs: 14% | APAC: 43% |
| Mid tier: 47% | Functional/Unit leaders: 42% | EMEA: 35% |
| Smaller Players: 18% | Managers: 44% | Americas: 22% |
Market-Sizing & Forecasting
Sizing is built using a top-down demand pool approach where event activity levels and digital adoption are translated into software spending per event organizer, which is then rolled up by region. The model is then checked with selective bottom-up approximations, such as sampled price points by plan, typical seat counts for organizer teams, and channel feedback on average deal sizes, so totals can be adjusted when assumptions drift.
Key inputs for event management software include the mix of in-person versus virtual or hybrid events, organizer counts by industry, subscription pricing ranges and discounting behavior, implementation and support attach rates, and renewal and expansion patterns after the first year. Forecasting is run using scenario analysis supported by expert inputs, where conservative and aggressive paths mainly shift the pace of hybrid adoption and the rate of price uplift. Where company-reported revenues are not clearly split to this product category, gaps are handled through share-of-revenue assumptions that are stress-tested in interviews and only accepted when they align with observed packaging and buyer behavior.
Data Validation & Update Cycle
Validation is done by cross-checking model outputs against independent signals like software spend trends, event industry activity measures, and publicly visible pricing and packaging changes. Any large variance is reviewed, assumptions are re-tested, and respondents are re-contacted when a specific input, such as renewal rates or services attach, is driving most of the swing.
Before sign-off, the work goes through a multi-step internal review where calculations are re-run and outliers are traced back to their source logic. Reports refresh annually, and interim updates are made when material events occur, such as major pricing resets or sharp changes in event formats. Right before delivery, we do a final pass to ensure the numbers reflect the latest available public information and the most recent interview feedback.
Mordor Intelligence's Event Management Software Market Size Compared With Other Published Estimates
Published numbers for event management software often look far apart because the market boundary is not consistent across studies, and pricing treatment varies across vendor lists. Differences also show up when one estimate focuses on software-only revenue while another mixes in services, or when the base year and currency conversion timing are not aligned.
In this market, the biggest gaps usually come from whether professional services are counted, how virtual and hybrid tooling is treated (as core platform revenue versus adjacent streaming tools), and whether general-purpose business suites with light event features are included. By keeping the count to licensed or subscription event platforms and validating average pricing using current packaging and buyer renewal behavior, the spread in results becomes easier to explain, a choice applied by Mordor Intelligence.
Benchmark comparison
| Source | Market Size | Gaps in Research Methodology |
|---|---|---|
| Mordor Intelligence | USD 15.20 B (2026) | |
| Global Consultancy A | USD 8.40 B (2024) | Uses an earlier base year and appears to size a narrower demand pool, which can undercount newer hybrid-focused platform revenue and later-period price resets. |
| Industry Publisher B | USD 11.31 B (2026) | Includes a faster growth path and likely different component treatment (software versus services), which shifts the 2026 level even when the headline market name is similar. |
Overall, the table shows that year selection and what gets counted as core platform revenue drive most of the differences. Our approach stays traceable to clear event activity signals and to real-world subscription pricing logic, which makes the final market value easier to reproduce and update.
Key Questions Answered in the Report
What is the current value of the event management software market?
The market is valued at USD 15.2 billion in 2026 and is projected to reach USD 24.17 billion by 2031.
How fast is the event management software market expected to grow?
The market is forecast to expand at a 9.73% CAGR between 2026 and 2031.
Which region shows the fastest growth for event technology platforms?
Asia Pacific is projected to post an 11.01% CAGR through 2031, the fastest among all regions.
Why are analytics modules gaining traction among event organizers?
Buyers increasingly need to link attendee engagement to revenue, making analytics and reporting tools the fastest-growing software type at a 10.22% CAGR.
How does cloud deployment benefit event software users?
Cloud platforms provide instant scalability, automatic updates and cost efficiency, which helped them secure 71.29% of 2025 revenue.
What factor is driving university demand for event platforms?
Universities are consolidating departmental tools into campus-wide suites that improve budget control and interoperability, resulting in a 10.82% CAGR for the education segment.