
Market Overview
| Study Period | 2020 - 2031 |
|---|---|
| Forecast Data Period | 2026 - 2031 |
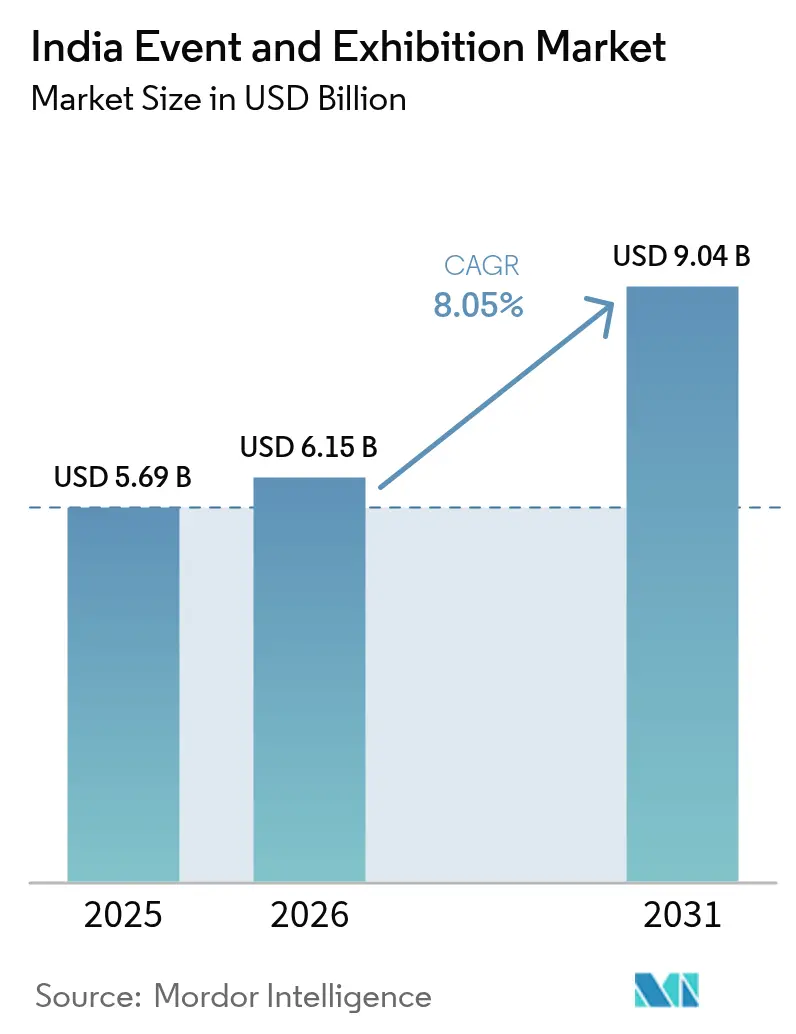
| Base Year Market Size (2025) | USD 5.69 Billion |
| Market Size (2026) | USD 6.15 Billion |
| Market Size (2031) | USD 9.04 Billion |
| Growth Rate (2026 - 2031) | 8.05% CAGR |
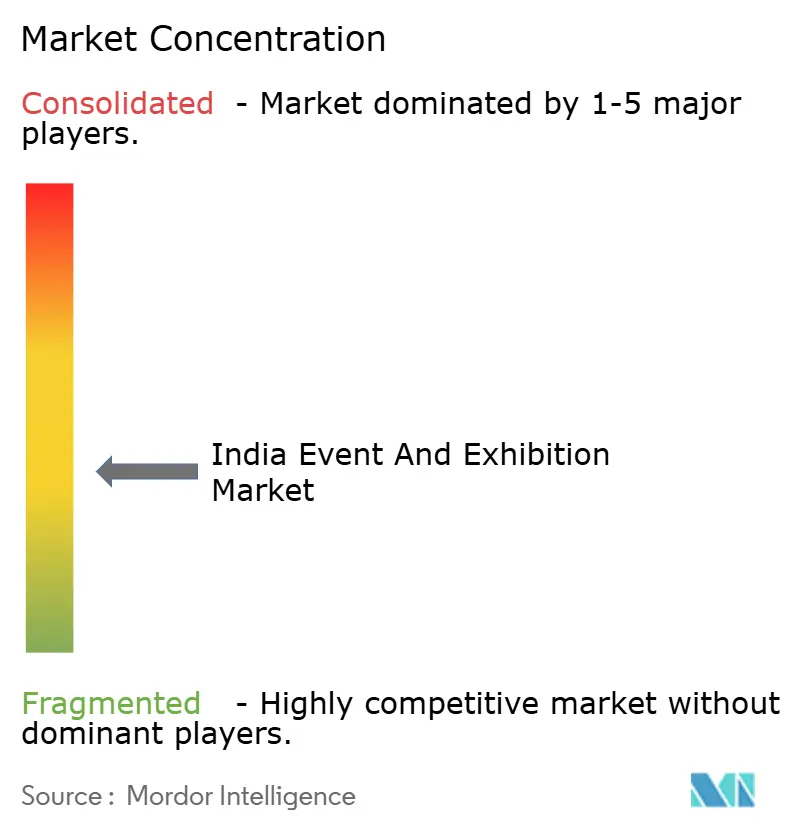
| Market Concentration | Medium |
Major Players *Disclaimer: Major Players sorted in no particular order Image © Mordor Intelligence. Reuse requires attribution under CC BY 4.0. | |
India Event And Exhibition Market Analysis by Mordor Intelligence
The India event and exhibition market size was valued at USD 5.69 billion in 2025 and estimated to grow from USD 6.15 billion in 2026 to reach USD 9.04 billion by 2031, at a CAGR of 8.05% during the forecast period (2026-2031). Capacity additions at venues such as Bharat Mandapam and Jio World Convention Centre, government incentives under the “Meet in India” program, and a corporate pivot toward experiential marketing reinforce the market’s growth runway. International organizers view India as a cost-competitive gateway to South Asia, while domestic operators benefit from rising discretionary spending and an expanding base of small and medium exhibitors. Hybrid formats are broadening audience reach, although physical shows remain the revenue backbone because they support tactile product demonstrations and face-to-face deal-making. Demand for net-zero venues is accelerating, aligning with multinational ESG mandates and further differentiating newly built facilities.
Key Report Takeaways
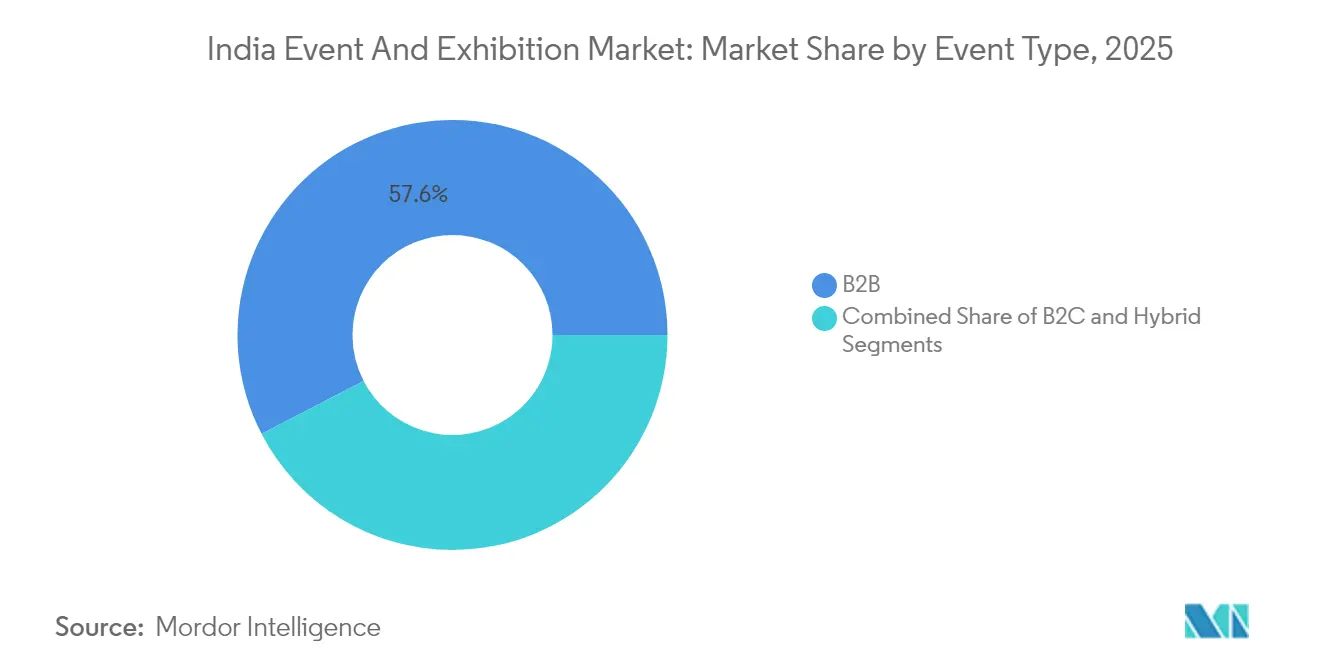
- By event type, B2B exhibitions led with 57.60% of the India event and exhibition market share in 2025, while B2C formats are forecast to grow at a 9.12% CAGR to 2031.
- By mode, physical shows accounted for a 71.85% share of the India event and exhibition market size in 2025, whereas hybrid events are advancing at a 9.28% CAGR through 2031.
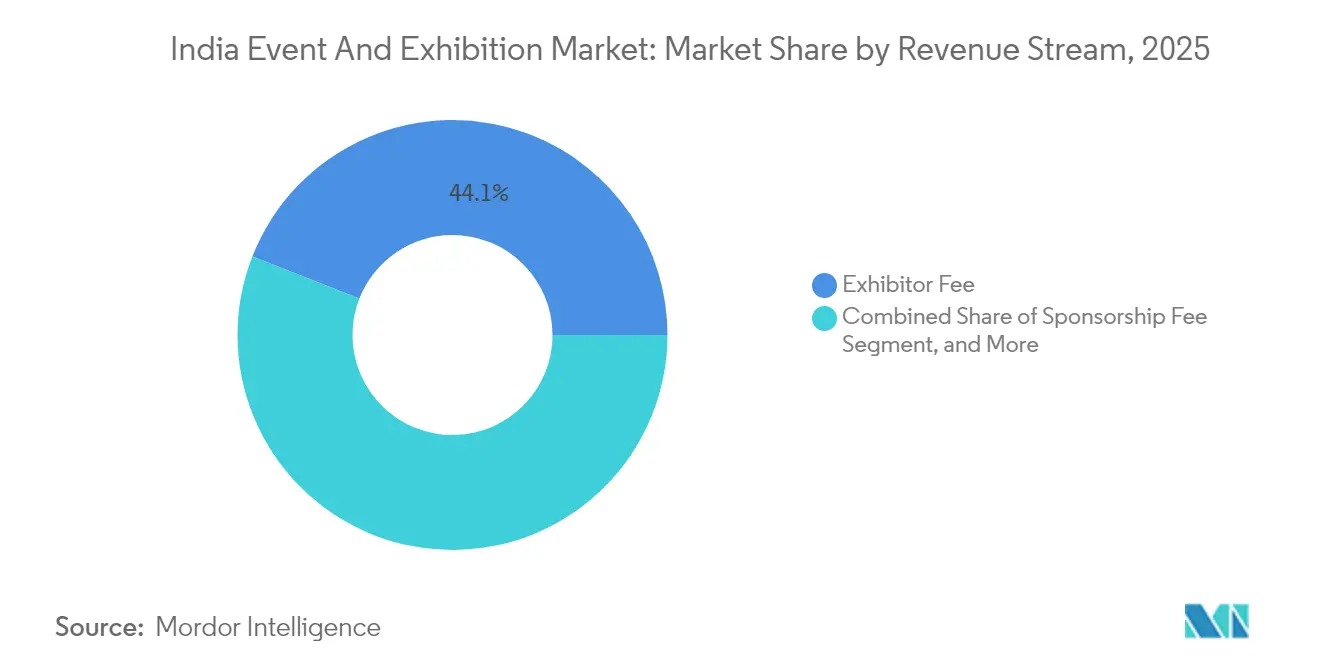
- By revenue stream, exhibitor fees contributed 44.05% of total receipts in 2025, yet sponsorship income is expanding the fastest at 9.52% CAGR to 2031 in the India event and exhibition market.
- By end-user industry, industrial manufacturing and engineering commanded 28.25% of the India event and exhibition market size in 2025, while entertainment and media is rising at a 9.41% CAGR through 2031.
- By region, West India held 35.62% of 2025 revenue in the India event and exhibition market, and South India is projected to post the highest 9.36% CAGR through 2031.
Note: Market size and forecast figures in this report are generated using Mordor Intelligence’s proprietary estimation framework, updated with the latest available data and insights as of 2026.
India Event And Exhibition Market Trends and Insights
Drivers Impact Analysis*
| Driver | (~) % Impact on CAGR Forecast | Geographic Relevance | Impact Timeline |
|---|---|---|---|
| Accelerating government-led MICE infrastructure build-out | +2.1% | National, with early gains in Delhi, Mumbai, Bengaluru | Medium term (2-4 years) |
| Rapid brand spending shift from ATL to experiential marketing | +1.8% | West India and South India primarily | Short term (≤ 2 years) |
| Post-pandemic revenge-travel fuelling B2C fairs and festivals | +1.5% | National, strongest in tier-1 cities | Short term (≤ 2 years) |
| Corporate decarbonisation targets raising demand for net-zero venues | +0.9% | West India and South India | Long term (≥ 4 years) |
| Tier-2 city convention-centre boom widening organiser footprint | +1.2% | North India and West India | Medium term (2-4 years) |
| Web-3 based digital-twin exhibitions unlocking incremental revenue | +0.7% | National, tech-forward cities | Long term (≥ 4 years) |
| Source: Mordor Intelligence | |||
Accelerating Government-Led MICE Infrastructure Build-Out
Central and state authorities are investing in landmark convention facilities such as Bharat Mandapam, whose 13,500-seat capacity and 5G-ready backbone set a new regional benchmark. Coupled with the creation of city-level MICE Promotion Bureaus, this pipeline eases historical space constraints, attracts larger global shows, and catalyzes hotel and airline traffic. Delhi–Mumbai expressway improvements shorten freight lead times for mobile exhibits, and dedicated freight corridors reduce handling costs for heavy engineering shows. Over the medium term, those assets are expected to lift venue utilization rates and underpin price discipline for floor-space rentals. As publicly funded venues embed fiber connectivity and modular halls, organizers gain flexibility to stage concurrent events and monetize ancillary services. These developments collectively add roughly 2.1 percentage points to the forecast CAGR.
Rapid Brand Spending Shift from ATL to Experiential Marketing
Indian advertisers allocated USD 19 billion to paid media in 2024, with digital formats already absorbing 57% of budgets. [1]WPP, “Media in India: The Future Is Now,” WPP.com Marketers now prioritize measurable in-person engagements to complement online funnels, favoring exhibitions that integrate data capture and mobile commerce. Case studies such as AB InBev India’s owned festivals illustrate how brands can extend dwell time and command higher ticket prices than traditional sponsorships. Organizers respond by bundling lead-gen analytics and on-site content creation studios, allowing exhibitors to justify bigger stand designs. The spending realignment is most visible in Mumbai and Bengaluru, where technology and consumer-packaged-goods firms seek omnichannel touchpoints. These dynamics add an estimated 1.8% lift to CAGR over the next two years.
Post-Pandemic Revenge Travel Fueling B2C Fairs and Festivals
Domestic leisure trips rebounded strongly after mobility restrictions eased, prompting organizers to revive consumer shows ranging from comic conventions to food festivals. The Maha Kumbh 2025 drew 660 million visits, underscoring the country’s capability to host mega gatherings. Brands leveraged drone displays and pop-up branches to reach audiences at scale, validating exhibitions as cost-effective engagement channels. Urban venues adopted crowd-flow analytics to manage peak loads, while tier-1 cities upgraded metro links to ease attendee access. The experiential pull stimulates ticket sales and ancillary retail, supporting 1.5% incremental CAGR in the short term.
Corporate Decarbonization Targets Raising Demand for Net-Zero Venues
Mahindra Group and Johnson Controls launched a Net Zero Buildings Initiative that supplies toolkits for convention centers to cut operational emissions. [2]Johnson Controls, “Mahindra Group and Johnson Controls Launch Net Zero Buildings Initiative,” JohnsonControls.com RX is committed to net-zero carbon events by 2040 and now screens venues on energy mix and waste practices. Facilities securing IGBC Platinum certification gain preferred-vendor status with multinationals, enabling premium pricing. Venue retrofits encompass solar rooftops, LED lighting, and AI-driven HVAC, lowering lifetime operating costs and freeing budget for digital infrastructure. Although the adoption curve is long, ESG alignment contributes 0.9% to long-term CAGR.
Restraints Impact Analysis*
| Restraint | (~) % Impact on CAGR Forecast | Geographic Relevance | Impact Timeline |
|---|---|---|---|
| Rising virtual-only alternatives cannibalising physical footfall | -1.4% | National, stronger impact in tech-forward cities | Short term (≤ 2 years) |
| Persistently elevated logistics and booth-build costs | -1.1% | National, acute in tier-1 cities | Medium term (2-4 years) |
| Complex multi-state GST compliance for travelling exhibitions | -0.8% | National, interstate exhibition routes | Short term (≤ 2 years) |
| Hybrid-tech skills shortage inflating organiser OPEX | -0.6% | National, concentrated in metro areas | Medium term (2-4 years) |
| Source: Mordor Intelligence | |||
Rising Virtual-Only Alternatives Cannibalizing Physical Footfall
Cloud-native event suites offer on-demand streaming and matchmaking at a fraction of physical participation costs. Knowledge-centric sectors software, publishing, and professional education now alternate flagship shows with virtual summits, trimming travel budgets. Organizers must therefore articulate unique in-person value, such as live equipment demos and serendipitous networking, to defend visitor counts. Hybrid models soften the blow but risk diluting urgency for onsite attendance. In net terms, virtual cannibalization shaves 1.4 percentage points from short-term CAGR.
Persistently Elevated Logistics and Booth-Build Costs
Post-pandemic supply-chain tensions lifted raw-material prices, while skilled-labor shortages lengthened installation timelines. Custom stands now start at USD 10,700, squeezing SME exhibitors. [3]Expo Display Service, “Understanding Trade Show Booth Rental Costs,” ExpoDisplayService.com Interstate e-way-bill formalities add paperwork and detention fees for goods-on-wheels. Organizers respond by offering modular booth packages and warehouse-near-venue logistics partnerships, yet cost pressures still clip 1.1% from medium-term CAGR.
*Our forecasts treat driver/restraint impacts as directional, not additive. The impact forecasts reflect baseline growth, mix effects, and variable interactions.
Segment Analysis
By Event Type: B2B Dominance Drives Market Foundation
B2B exhibitions delivered 57.60% of the India event and exhibition market size in 2025, as India’s manufacturing build-out necessitated large trade shows where buyers can benchmark machinery specifications and negotiate bulk contracts. Flagship engineering fairs in Coimbatore and Delhi transform venue halls into live factories, emphasizing why digital replicas cannot replace tactile product validation. The India event and exhibition market share commanded by B2B formats is anchored in high stand-rent yields and multi-day delegate packages, bolstering organizer cash conversion.
B2C shows, however, are expanding at a 9.12% CAGR on the back of rising household incomes and pent-up demand for in-person entertainment. Comic conventions, food carnivals, and gaming expos adopt influencer-driven programming to attract Gen-Z visitors who amplify reach via social video clips. Hybrid sub-formats emerge when auto shows open consumer days after press and dealer previews, extracting incremental ticket revenue while preserving trade-day exclusivity. This dual-track evolution positions organizers to diversify revenue and mitigate cyclical risks.


By Mode: Physical Events Maintain Dominance Despite Hybrid Growth
Physical formats retained 71.85% of 2025 revenue because large capital-goods displays and tactile sampling still require showroom-style setups. Venues like Pragati Maidan host more than 500 shows yearly, demonstrating sustained demand even as virtual add-ons proliferate. Physical dominance is evident in the India event and exhibition market size for venue services, where ancillary income from parking, food, and advertising boards supplements hall rentals.
Hybrid models, advancing at 9.28% CAGR, use simultaneous streaming and on-demand replays to expand audience pools beyond geography and visa constraints. Organizers bundle “digital exhibitor booths” that remain live for 30 days post-show, selling sponsorship banners inside virtual lobbies. This convergence keeps the India event and exhibition market competitive by offering tiered participation packages to cost-sensitive SMEs while preserving premium in-person tiers for enterprise buyers.
By Revenue Stream: Exhibitor Fees Anchor Business Models
Exhibitor payments contributed 44.05% of 2025 receipts, underscoring their role as the base layer of cash flow for every organizer. Pricing correlates with aisle positioning and ceiling height because machinery exhibitors demand heavy-load flooring. The India event and exhibition market size tied to sponsorships, though smaller, is forecast to outpace other streams at 9.52% CAGR as brands value integrated digital-onsite activations over static booth branding.
Ancillary services, lead scanning, logistics, and stand fabrication represent the fastest-rising cross-sell, accounting for a growing slice of the India event and exhibition market share in organizer profits. Entrance fees remain negligible in B2B contexts but contribute materially in pop-culture and consumer-electronics festivals where VIP passes can run USD 50 apiece. Organizers seeking margin expansion, therefore, prioritize service bundling and inventory yield management across these revenue categories.
By End-User Industry: Manufacturing Leads While Entertainment Accelerates
Industrial manufacturing and engineering represented 28.25% of the 2025 pie, mirroring India’s USD 600 billion factory output and localization thrust under Production-Linked Incentives. Heavy-machinery expos, welding technology forums, and automation pavilions dominate spring calendars in Delhi and Pune, keeping venue occupancy high. The India event and exhibition market size tied to this vertical benefits from multi-cycle equipment upgrades and expansion capex.
Entertainment and media, meanwhile, enjoys the fastest 9.41% CAGR as streaming wars, esports, and music festivals crowd schedules. Live-event revenue in the media sector grew 15% in 2024, feeding demand for purpose-built stages and experiential lighting rigs. Organizers curate content partnerships with OTT platforms to stream highlights, extending monetization windows and reinforcing the hybrid virtuous circle.
Geography Analysis
West India held 35.62% of 2025 turnover thanks to Mumbai’s role as the financial nucleus and superior air-sea connectivity. Jio World Convention Centre’s 1,850-seat theater and 13 exhibition halls allow concurrent sector shows, cementing venue preference for international organizers. A vibrant agency ecosystem in film production, banking, and advertising ensures robust sponsorship demand and high average ticket yields.
South India posts the highest 9.36% CAGR through 2031, powered by Bengaluru’s tech corridor and Chennai’s export-oriented manufacturing clusters. New airside capacity at Coimbatore and greenfield convention centers in Hyderabad lower access barriers for overseas delegates. State incentives granting land rebates and fast-track permissions further entice organizers to schedule first-edition shows, swelling the India event and exhibition market size across the region.
North India remains pivotal owing to policy proximity and the showcase Bharat Mandapam facility. Government ministries frequently co-locate policy conferences with industry expos, guaranteeing footfall from regulators and public-sector buyers. East and Northeast corridors lag in absolute terms but gain momentum as infrastructure corridors bridge last-mile gaps, signaling long-term upside for organizers with regional specialization.
Regulatory Landscape
India's event and exhibition ecosystem operates under trade-promotion oversight and broader business compliance requirements. The India Trade Promotion Organisation (ITPO), under the Ministry of Commerce and Industry, functions as a nodal body for promoting external trade. In industry context, it is referenced for approving international trade fairs and for issuing guidelines intended to manage scheduling and duplication, which affects organizer calendars and venue availability in major hubs.
On the operating side, organizers and service providers typically operate as incorporated entities governed by the Companies Act and comply with standard taxation requirements, notably Goods and Services Tax (GST). Industry representation through bodies such as the Indian Exhibition Industry Association (IEIA) adds a soft-governance layer through best-practice initiatives and professional development, supplementing formal permissions, venue rules, and tax compliance that influence multi-city touring exhibitions.
Value Chain Analysis
The value chain begins with venue owners and operators that provide halls, utilities, safety systems, and on-ground services, including public-sector platforms such as ITPO-managed venues and major private convention and exhibition centers. Professional exhibition organizers (PEOs) including RX India, Messe Muenchen India, Messe Frankfurt Trade Fairs India, NürnbergMesse India, and Koelnmesse YA Tradefair design event IP, and they monetize primarily through floor space and sponsorships while driving exhibitor and visitor acquisition via marketing, delegates, and hosted-buyer programs.
Delivery depends on specialized service partners: stand designers and contractors; AV and broadcast vendors for hybrid formats; ticketing and registration platforms; security and facility management; and freight forwarders and on-site logistics teams handling move-in/move-out and interstate documentation. Industry bodies such as IEIA provide a collaboration forum that connects organizers, venues, and suppliers around standards and capability building, supporting service quality as more events expand into tier-2 city circuits.
Competitive Landscape
Global groups such as Reed Exhibitions, Messe Frankfurt, and RX India vie with domestic operators that possess granular knowledge of local regulations and vendor networks. Recent leadership hires, exemplified by RX India’s appointment of a new country general manager, illustrate how multinationals localize management to sharpen client intimacy. Technology capabilities serve as the new battleground; players deploy AI-driven matchmaking engines that raise exhibitor ROI and justify booth-rate premiums.
Infrastructure visits by the UFI delegation in 2024 validated India’s hall quality, boosting confidence among overseas organizers looking to transplant flagship brands. [4]UFI, “UFI Delegation Completes Successful Three-Day Delegation Visit of India,” UFI.org Consolidation abroad, Hyve’s purchase of HLTH Inc., and Clarion Capital’s acquisition of Marketplace Events signal capital recycling that may fund future India launches. Domestic independents, however, retain a competitive edge in tier-2 cities where relationships with local chambers and civic authorities determine show viability.
Competition thus manifests in venue-supply negotiations, hybrid-platform investments, and sectoral specialization. Organizers that orchestrate seven-day engineering extravaganzas differ materially from those curating two-day fintech forums, allowing coexistence despite overlapping calendars. The diversity of formats keeps average hall occupancy above 55%, supporting steady cash flows for venue owners.
India Event And Exhibition Industry Leaders
Reed Exhibitions India Private Limited
Messe Muenchen India Private Limited
Messe Frankfurt Trade Fairs India Private Limited
NürnbergMesse India Private Limited
Koelnmesse YA Tradefair Private Limited
- *Disclaimer: Major Players sorted in no particular order

Market Opportunities and Future Outlook
White space is developing around specialization and regionalization, where organizers build sector-focused formats tied to industrial clusters rather than relying only on metro flagships. This shift shows up in government-linked and cluster-led programming, including Messe Frankfurt Trade Fairs India's decision to launch a Techtextil India Summit in Coimbatore after an MoU with the Government of Tamil Nadu. The approach links exhibition-led demand to a defined textiles ecosystem and supports local supplier onboarding, hosted-buyer activity, and year-round knowledge communities.
A second opportunity is portfolio scaling through multi-city circuits and brand consolidation, which extends monetization beyond a single-city annual event and improves exhibitor ROI through repeatable, standardized delivery. Messe Muenchen India's two-city circuit spanning Delhi-NCR (Greater Noida) and Bengaluru for electronica India and productronica India, along with Messe Frankfurt Trade Fairs India's integration of Sign India Expo events into the Media Expo platform across multiple cities, reflects demand for distributed footprints. It also broadens the addressable revenue pool for ancillary services such as modular stand packages, integrated logistics, and hybrid content production, as organizers seek repeatable operations across venues and regions.
Recent Industry Developments
- April 2026: Messe Muenchen India hosted the first bi-annual edition of electronica India and productronica India in Greater Noida as part of a new annual two-city circuit covering Delhi-NCR and Bengaluru. The launch extends the electronics trade event footprint across India and positions NCR and Bengaluru as core hubs, pointing to rising calendar density for the sector.
- February 2026: Messe Frankfurt Trade Fairs India finalized a partnership with BusinessLive Trade Fairs to acquire five Sign India Expo events, integrating them into the Media Expo brand. The expansion strengthens regional reach in sign and display markets and creates cross selling opportunities across cities.
- January 2026: Messe Frankfurt Trade Fairs India announced the launch of the Techtextil India Summit in Coimbatore, following a November 2025 MOU with the Department of Textiles and Guidance Tamil Nadu. This helps position Coimbatore as a regional hub for technical textiles and could support supply chain investment and industry collaborations.


Research Methodology Framework and Report Scope
Market Definition and Coverage
This market covers the value generated from organizing and running events and exhibitions in India, including physical, virtual, and hybrid formats, and the key revenue earned from exhibitors, sponsors, visitors, and related services tied to the show.
Scope exclusions: This sizing excludes broader MICE travel spend (airfare, hotels, and tourist spending) and excludes pure ticketing or media rights revenue that is not directly linked to an event or exhibition organizer or venue service.
Segmentation Overview
- By Event Type
- B2B
- B2C
- Hybrid
- By Mode
- Physical/In-person
- Virtual/Digital
- Hybrid (Phygital)
- By Revenue Stream
- Exhibitor Fee
- Sponsorship Fee
- Entrance Fee
- Ancillary Services
- By End-user Industry
- Consumer Goods and Retail
- Automotive and Transportation
- Industrial Manufacturing and Engineering
- Entertainment and Media
- Real Estate and Property
- Hospitality and Tourism
- Healthcare and Pharmaceutical
- Other End-user Industries
- By Region
- North India
- West India
- South India
- East and Northeast India
Data Sources, Market Sizing, and Validation
Desk Research
Desk work started with public, non-paywalled references that help explain how large the activity pool is and how it is changing. We used sources such as the Ministry of Statistics and Programme Implementation (services output signals), Department for Promotion of Industry and Internal Trade (sector investment context), Ministry of Tourism (business travel and MICE directionally), and India Trade Promotion Organisation updates on venue capacity and event calendars. To add structure, we also reviewed industry bodies and venue ecosystem publications, such as exhibition and convention center associations, along with reputed press coverage of large venue additions and policy announcements.
Next, the desk layer was used to convert activity into money in a simple and repeatable way. Company filings, investor presentations, and press interviews were used to frame revenue mixes across exhibitor fees, sponsorships, entry fees, and organizer services, which were then checked against publicly visible pricing cues for booths and sponsorship packages. Where a public trail was thin, we used approved paid subscriptions for company financials and intelligence, news and financials, patent and trademark lookups (for event-tech direction), and global contracts and tenders (for public event spend signals). The desk sources listed here are illustrative, and many other public documents were used to collect, validate, and clarify inputs.
Primary Interviews and Surveys
Primary work was used to confirm what the desk sources cannot show cleanly, especially real booking momentum, discounting, utilization, and how revenue splits shift between physical and hybrid formats. We spoke with organizers, venue operators, service partners, and large exhibitors across major metros and high-growth tier 2 hubs, and then reconciled their inputs into a single set of assumptions for volumes, pricing, and take rates.
Distribution of primary research fieldwork respondents
| Company type | Respondent position | Region |
|---|---|---|
| Top tier: 33% | CXOs: 17% | |
| Mid tier: 49% | Functional/Unit leaders: 25% | |
| Smaller Players: 18% | Managers: 58% |
Market-Sizing & Forecasting
The core model starts from a top-down demand reconstruction, where India venue capacity and utilization, the count of active exhibitions and corporate events, and average monetization per event are brought together to form the annual revenue pool. When the model is built this way, the key is to keep the units consistent, so we track signals like number of event days, average occupied square meters (for exhibitions), exhibitor count per show, sponsor inventory sold, and paid visitor volume. These inputs then feed into revenue buckets that buyers recognize, such as exhibitor fee, sponsorship fee, entrance fee, and organizer services, which are then summed to the total market value.
To make sure the total is not drifting, we corroborated results with selective bottom-up approximations, mainly organizer revenue roll-ups from public financials and interview-based revenue bands, followed by sampled price checks (booth and sponsorship rate cards) multiplied by typical sold inventory. Gaps appear most often in informal or one-off events that do not publish pricing or attendance, so we handle them through calibrated uplift factors that were validated in interviews and then stress-tested against venue utilization and calendar intensity.
Forecasting is driven using scenario analysis supported by light multivariate checks, because the market is sensitive to a few practical drivers that tend to move together. The forward view is anchored on venue capacity additions and ramp-ups, corporate marketing and sales budgets, sector-wise exhibitor appetite (for example, industrial manufacturing and engineering versus consumer shows), and the pace at which hybrid formats keep sponsor value stable even when physical footfall is volatile. Assumptions for pricing progression are kept conservative and are reset when interviews indicate a sustained change in booth rate realization or sponsorship discounting.
Data Validation & Update Cycle
Validation is done in layers so a single data gap does not overly influence the final number. We compare the modeled market value against independent signals, such as venue occupancy trends, event calendar density, and revenue mix patterns shared by multiple respondent groups, and then differences are investigated before sign-off. When an anomaly shows up, such as revenue growth without matching event-day growth, the assumptions are rechecked and respondents are re-contacted to confirm if pricing, sponsorship intensity, or service attach rates changed.
Before publication, the work goes through a multi-step internal review where calculations are recreated and key inputs are cross-verified against fresh desk evidence. Reports are refreshed annually, and interim updates are triggered when material events occur, such as major venue launches, sharp shifts in travel restrictions, or large changes in corporate event spending. Right before delivery, an analyst runs a last-pass scan to ensure the sizing still aligns with the most recent signals available.
Mordor Intelligence's Event and Exhibition Market India Market Estimate Compared With Other Published Estimates
Different published market sizes for India events and exhibitions often do not match because the included revenue streams and the counted activity base are not the same. Some sources focus mainly on exhibitions, while others fold in the wider MICE economy, which changes the number dramatically even if the growth story looks similar.
The main gap drivers here are what gets counted as market value and how hybrid formats are treated. Some estimates add travel and hospitality spillovers, while others only count organizer and venue revenues, and this alone can move the total by several multiples. Another driver is whether sponsorship and exhibitor fee realization is modeled using rate cards or using realized pricing after discounts, and then how quickly those prices are assumed to rise each year. Refresh timing also matters because large venue additions and post-pandemic event recovery can shift utilization and event-day intensity within a short period.
Benchmark comparison
| Source | Market Size | Gaps in Research Methodology |
|---|---|---|
| Mordor Intelligence | USD 5.69 B (2025) | |
| Industry Strategy Paper A | USD 6.61 B (2025) | Uses a wider definition of exhibition-related market output by adding indirect participant spend like accommodation and local transport, which lifts the total beyond organizer and venue revenue. |
| Venue-led Study B | USD 0.36 B (2020) | Narrows scope to exhibitions only and anchors the value mainly to exhibition revenue streams (exhibitor fees, sponsorship, admission), which excludes corporate events and several organizer services. |
The spread is explained largely by whether indirect spending and the wider MICE economy are counted, plus whether the estimate is exhibitions-only versus the full events and exhibitions pool, a scope choice applied by Mordor Intelligence. When we keep the model tied to event-day activity, venue utilization, and realized monetization by revenue stream, the result stays traceable to clear inputs that can be checked and updated in a repeatable way.


Key Questions Answered in the Report
How large is the India event and exhibition market in 2026?
It is valued at USD 6.15 billion and is projected to reach USD 9.04 billion by 2031.
Which region currently leads domestic revenues?
West India holds 35.62% owing to Mumbai’s mature venue ecosystem.
What is the fastest-growing event mode?
Hybrid formats are advancing at a 9.28% CAGR through 2031 as organizers integrate streaming and on-demand content.
Which revenue stream is expanding the quickest?
Sponsorship fees, rising at 9.52% CAGR as brands favor experiential marketing over traditional ads.
Which end-user vertical shows the highest growth momentum?
Entertainment and media, logging a 9.41% CAGR on the back of live events and digital content synergies.
What primary risk threatens physical footfall?
Virtual-only alternatives may cannibalize attendance, trimming short-term growth by 1.4 percentage points.
Page last updated on:


