
EV Taxi Market Size and Share
Market Overview
| Study Period | 2020 - 2031 |
|---|---|
| Market Size (2026) | USD 36.81 Billion |
| Market Size (2031) | USD 110.56 Billion |
| Growth Rate (2026 - 2031) | 24.60 % |
| Fastest Growing Market | Middle East and Africa |
| Largest Market | Asia Pacific |
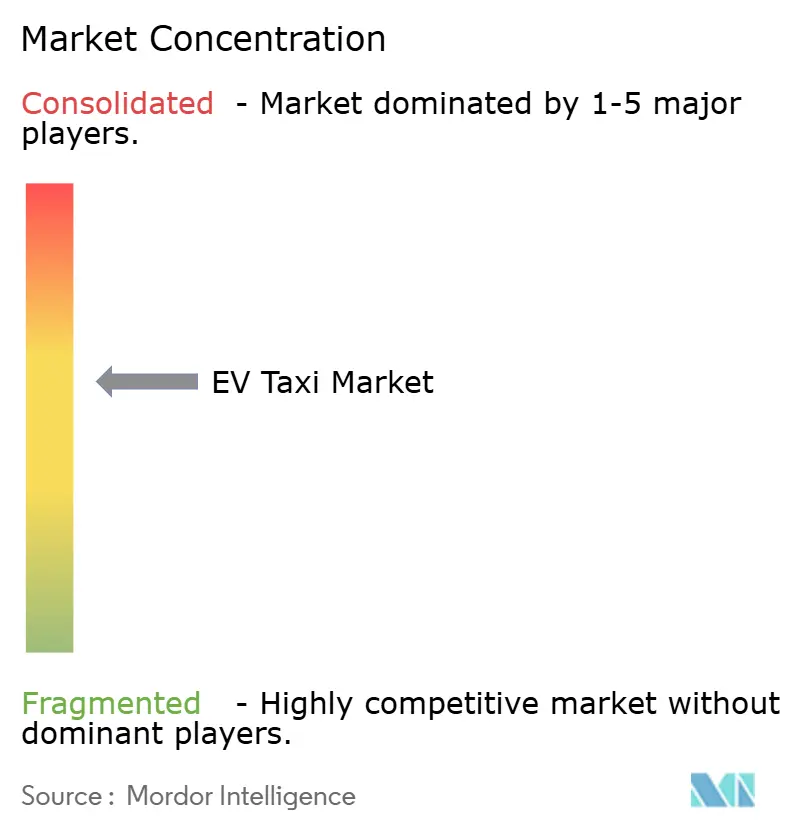
| Market Concentration | Medium |
Major Players *Disclaimer: Major Players sorted in no particular order Image © Mordor Intelligence. Reuse requires attribution under CC BY 4.0. | |
EV Taxi Market Analysis by Mordor Intelligence
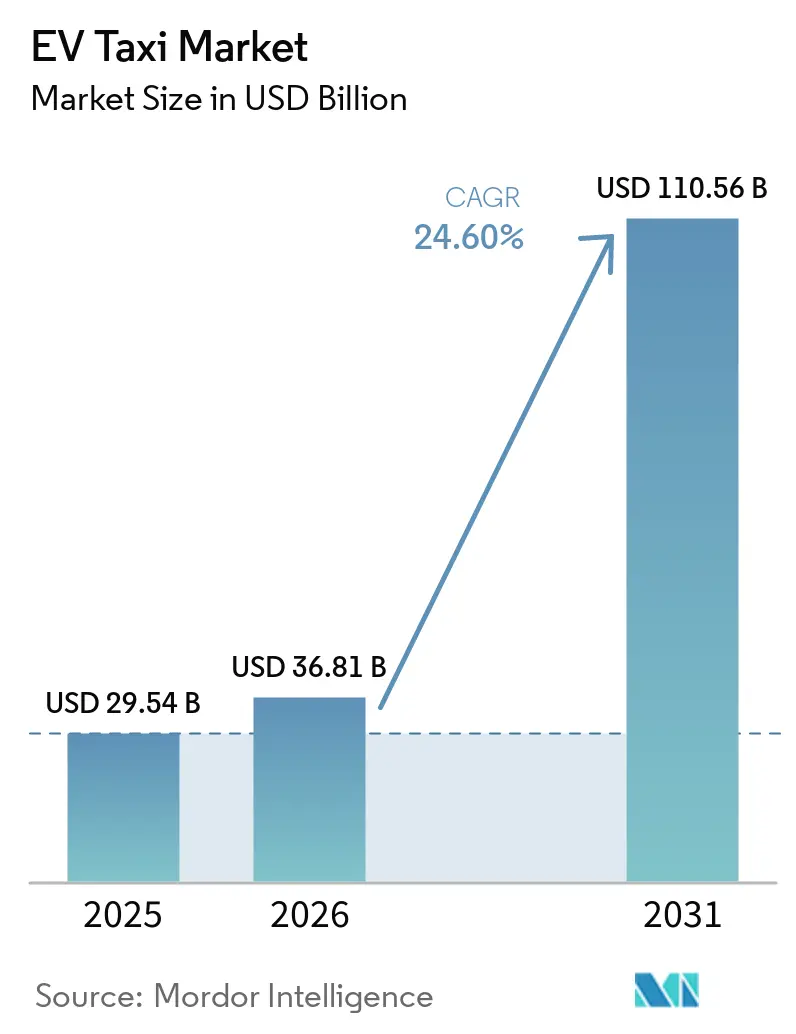
EV taxi market size in 2026 is estimated at USD 36.81 billion, growing from 2025 value of USD 29.54 billion with 2031 projections showing USD 110.56 billion, growing at 24.6% CAGR over 2026-2031. The growth trajectory reflects accelerating total-cost-of-ownership parity, tightening zero-emission taxi mandates, and rapid build-out of fast-charging hubs. Fleets also gain from lower fuel and maintenance outlays, while ride-hailing platforms pull demand forward through firm electrification timelines. Battery-as-a-service business models reduce upfront capital, and ESG-linked municipal finance programs unlock low-cost funding for operators. Asia-Pacific leads on volume, yet the Middle East and Africa register the fastest regional gains as oil-exporting economies pivot toward electrified mobility.
Key Report Takeaways
- By propulsion type, Battery Electric Vehicles held 62.72% of the EV taxi market share in 2025; Plug-in Hybrid Electric Vehicles are projected to expand at a 26.8% CAGR through 2031.
- By vehicle type, four-wheeler taxis accounted for 73.46% of the EV taxi market share in 2025, whereas two-wheeler formats are set to grow at a 27.9% CAGR to 2031.
- By service model, ride-hailing captured 72.88% of the EV taxi market share in 2025, while airport and tourism shuttles are forecast to advance at a 27.6% CAGR through 2031.
- By ownership, fleet-owned operations represented 56.58% of the EV taxi market share in 2025; leasing and subscription frameworks will post the fastest 26.7% CAGR to 2031.
- By battery capacity, 30–60 kWh packs commanded a 51.83% of the EV taxi market share in 2025, yet configurations above 60 kWh are expected to record a 27.85% CAGR through 2031.
- By geography, Asia-Pacific led with a 43.02% EV taxi market share in 2025, whereas the Middle East and Africa are positioned for a 28.45% CAGR through 2031.
Note: Market size and forecast figures in this report are generated using Mordor Intelligence’s proprietary estimation framework, updated with the latest available data and insights as of 2026.
Market Trends and Insights
Drivers Impact Analysis of EV Taxi Market*
| Driver | (~) % Impact on CAGR Forecast | Geographic Relevance | Impact Timeline |
|---|---|---|---|
| Total-Cost-Of-Ownership (TCO) Parity by 2026 | +6.8% | North America and Europe, spill-over to Asia-Pacific core | Short term (≤ 2 years) |
| Ride-Hailing Platform Electrification Commitments | +5.1% | Global, led by North America and Asia-Pacific | Short term (≤ 2 years) |
| Government Zero-Emission Taxi Mandates | +4.2% | Global, with early gains in United Kingdom, California, Singapore | Medium term (2-4 years) |
| Battery-as-a-Service Subscription Economics | +3.8% | Asia-Pacific core, expanding to global markets | Medium term (2-4 years) |
| Expansion of Rapid-Charging Hubs at Airports/Urban Cores | +3.5% | Global, concentrated in major metropolitan areas | Medium term (2-4 years) |
| ESG-Linked Municipal Financing Programs | +2.9% | North America and Europe, emerging in Asia-Pacific | Long term (≥ 4 years) |
| Source: Mordor Intelligence | |||
Total-Cost-of-Ownership Parity by 2026
Rapid battery cost declines—now under USD 100 per kWh—and high fuel prices drive economic inflection. In high-mileage taxi duty cycles, fuel and maintenance savings offset higher upfront pricing within three years of operation. Incentive structures such as purchase rebates and accelerated depreciation compress the payback horizon further. Operators consequently rewrite internal rate-of-return models around electric drivetrains rather than diesel powertrains. Lenders respond by offering longer-tenor, lower-coupon debt backed by predictable cash-flow savings.
Ride-Hailing Platform Electrification Commitments
Platforms use sustainability targets to differentiate and secure investor capital. Uber is striving toward its global sustainability objectives, pledging to achieve a zero-emission fleet by 2040. This goal is bolstered by strategic alliances and extensive procurement strategies, highlighted by a letter of intent to acquire electric vehicles from top manufacturers like BYD. Such actions indicate a transition from mere aspiration to tangible execution, empowering Uber to shape supply chains and set benchmarks in urban mobility. Meanwhile, Lyft offers riders “Green” options for a premium fare, subtly steering its driver partners towards electric models. Such guarantees create durable demand that underpins volume purchasing, catalyzing factory allocation for taxi-optimized trims.
Government Zero-Emission Taxi Mandates
Mandated phase-out deadlines for internal-combustion taxis are reshaping fleet procurement schedules. The United Kingdom requires 80% of new cars to be electric by 2030, while California targets 100% zero-emission taxi fleets that year [1]“Transitioning to Zero Emission Vehicles,”, United Kingdom Department for Transport, gov.uk. Singapore moves sooner, insisting that all new taxi registrations be electric from 2025. These mandates carry fines for non-compliance, turning optional sustainability pledges into binding financial obligations[2]“Advanced Clean Fleets Regulation Text,”, California Air Resources Board, arb.ca.gov. Fleet operators accelerate orders, and automakers prioritize certified zero-emission variants that meet regional homologation rules. Municipalities simultaneously carve out low-emission zones, ensuring immediate utilization advantages for compliant vehicles.
Expansion of Rapid-Charging Hubs at Airports and Urban Cores
Targeted deployment of 150 kW to 350 kW chargers at high-demand nodes curtails wait times that once eroded fleet utilization. In 2024, New York’s JFK installed 24 dedicated fast chargers for electric vehicles. Los Angeles International Airport and Zurich Airport have installed electric ports. City franchising authorities are bundling land-use concessions with zero-emission license renewals, aligning incentives between the public and private sectors. With faster turnarounds, drivers can fit in an additional peak-hour shift, bolstering wage stability and expanding the electric vehicle taxi market.
Restraints Impact Analysis of EV Taxi Market*
| Restraint | (~) % Impact on CAGR Forecast | Geographic Relevance | Impact Timeline |
|---|---|---|---|
| High Vehicle Downtime Due to Charging | -3.7% | Global, acute in markets with limited fast-charging | Short term (≤ 2 years) |
| Uncertain Residual Values for Used E-Taxis | -2.8% | North America and Europe, emerging concern in Asia-Pacific | Medium term (2-4 years) |
| Urban Grid-Capacity Bottlenecks | -2.1% | Major metropolitan areas globally | Long term (≥ 4 years) |
| OEM Production Priority Away from Taxi Variants | -1.9% | Global, particularly affecting specialized taxi models | Medium term (2-4 years) |
| Source: Mordor Intelligence | |||
High Vehicle Downtime Due to Charging
Electric taxis spend more time off-duty than gasoline equivalents because charging sessions are longer and queuing is common at peak hours. Operators in dense cities feel the pinch when simultaneous shift changes coincide with charger congestion. Lost service minutes translate directly to revenue attrition and tip reductions, making some drivers reluctant to convert even when subsidies exist. The constraint is expected to ease as megawatt charging and better load-management software scale, yet near-term capacity gaps still dampen adoption.
Uncertain Residual Values for Used E-Taxis
With their high annual mileage, taxi operations significantly strain electric vehicle batteries. This raises concerns about the batteries' long-term durability and the vehicles' value retention. Heavy usage and frequent charging cycles hasten battery degradation, potentially affecting performance and resale value. Market data indicate that electric cars depreciate faster than internal combustion vehicles over comparable time frames, especially in high-turnover segments such as ride-hailing. Lenders, insurers, and lessors price this uncertainty into higher monthly payments. Until robust battery-health certification standards emerge, smaller operators without balance-sheet depth hesitate to finance large fleets, and this limits the attainable electric vehicle taxi market size over the forecast window.
*Our forecasts treat driver/restraint impacts as directional, not additive. The impact forecasts reflect baseline growth, mix effects, and variable interactions.
EV Taxi Market Segment Analysis
By Propulsion Type:
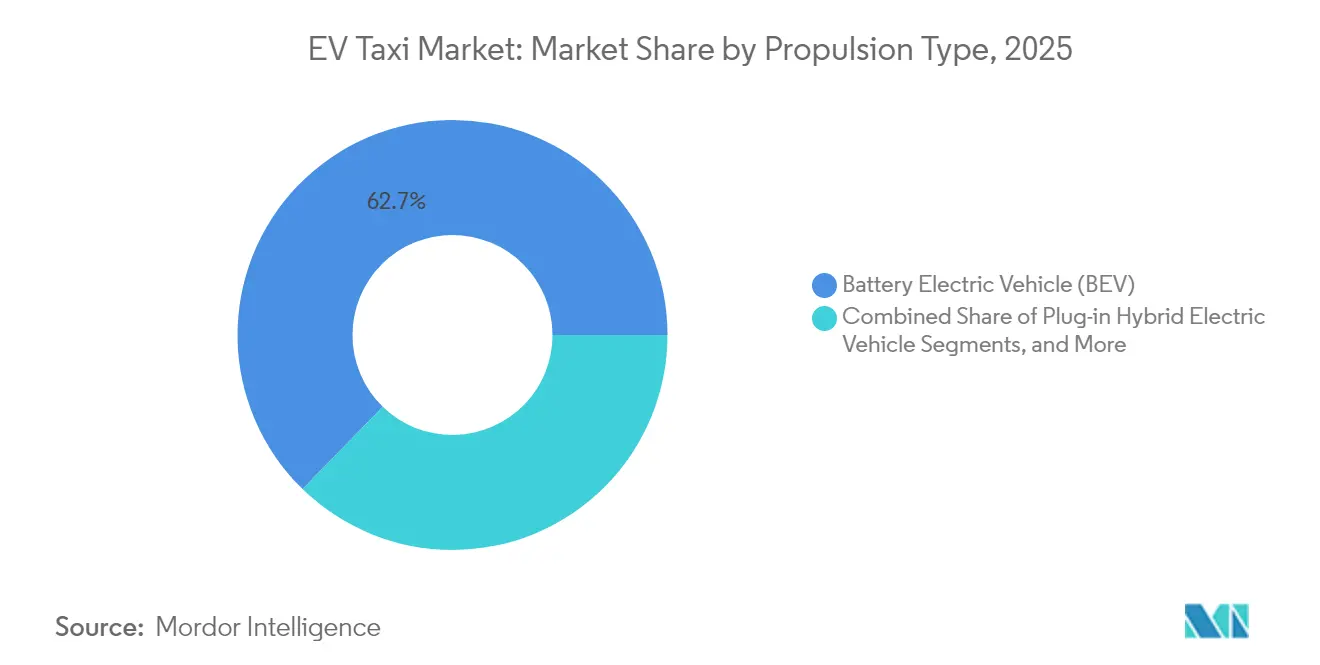
BEV Leadership Meets PHEV HedgingBattery electric vehicles represented 62.72% share of the EV taxi market in 2025, illustrating that the electric vehicle taxi market favors drivetrain simplicity and low servicing costs. Plug-in hybrids, however, are gaining swiftly at a 26.8% CAGR through 2031, as operators hedge against sparse highway chargers in peri-urban zones. Therefore, the electric vehicle taxi industry will likely see dual-track procurement strategies until nationwide charging density normalizes. Forward-looking operators already pivot to pure electric in regions planning to exclude hybrids from zero-emission definitions after 2028. Meanwhile, fuel-cell pilots remain confined to hydrogen-corridor projects, collectively under 1% of the current electric vehicle taxi market.
Second-generation PHEVs pair 20+ kWh batteries with efficient range-extenders, allowing 80 km electric-only range that covers most intra-city trips. This flexibility appeals to mid-tier fleet operators who are balancing capex and uptime considerations. Nonetheless, when comparing five-year cash flows, analysts see BEVs achieving a lower net-present cost as soon as charger queuing times fall below twelve minutes. That inflection could lock in BEV dominance by the late decade.


By Vehicle Type:
Four-Wheeler Core Faces Two-Wheeler DisruptionFour-wheeler sedans and hatchbacks commanded 73.46% of the electric vehicle taxi market share during 2025, thanks to entrenched regulations and passenger comfort expectations. Yet electric motorcycles and scooters are registering a brisk 27.9% CAGR through 2031, led by Indonesia, India, and Vietnam, where narrow streets, low fares, and modular battery packs propel adoption. These two-wheeler formats often need 3–8 kWh batteries, opening the door to curbside swapping that restores full range in under two minutes.
Regulators increasingly recognize two-wheelers as legitimate taxi categories, issuing digital permits linked to platform apps. That legitimacy improves driver income visibility and accelerates financing availability. Minivans and MPVs retain a role in multi-passenger airport routes. Still, they are not forecast to materially disrupt the dominance of smaller four-wheelers within the electric vehicle taxi market size metrics.
By Service Model:
Ride-Hailing Still Dominant, Airport Shuttles FastestRide-hailing apps hold a 72.88% share of the EV taxi market in 2025 and remain the principal channel through which customers access electric taxis. Their digitally matched supply-and-demand model optimizes vehicle utilization, which is crucial for amortizing battery costs. However, airport and tourism shuttle services will log the fastest 27.6% CAGR to 2031 as fixed routes synchronize neatly with scheduled charging windows. The electric vehicle taxi industry’s corporate shuttle niche expands as companies offset Scope 3 emissions.
Policy incentives reinforce the trend: many airports now discount curb fees or allocate priority ranks to zero-emission vehicles. Such privileges improve fare turnover, enticing private shuttle operators to electrify fleets earlier than ride-hailing independents.
By Ownership Model:
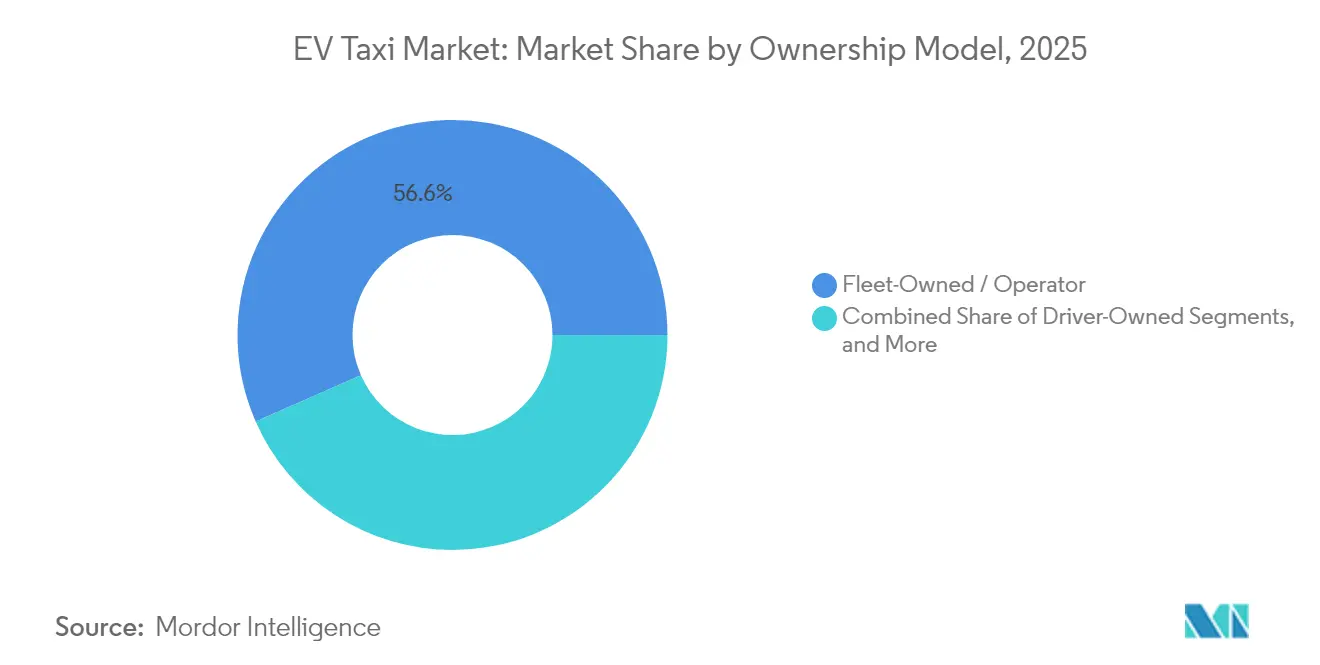
Subscription Economics Challenge Fleet DominanceFleet-owned structures supplied 56.58% of all electric vehicle taxis in 2025, benefiting from scale procurement and in-house workshops. Yet leasing and subscription formats, buoyed by battery-as-a-service, are projected to surge at a 26.7% CAGR through 2031. Under these contracts, the battery remains with a specialized asset manager who guarantees replacement once its health falls below 80%. The arrangement slices upfront vehicle cost by up to one-third and protects operators from residual-value uncertainty.
Individual driver ownership grows only where micro-finance programs pair favorable interest rates with guaranteed platform demand. Absent those enablers, high capex deters single-cab entrepreneurs from joining the electric vehicle taxi market.
By Battery Capacity:
Mid-Range Packs Prevail, High-Capacity in AscentPacks rated 30–60 kWh deliver 51.83% of the EV taxi market in 2025 because they offer 250 km urban range at a manageable cost and weight. Units above 60 kWh, though constituting a smaller base, are expanding at a 27.85% CAGR through 2031, as suburban and inter-city taxi segments require longer stretches between charges. Deployments of sub-30 kWh batteries concentrate in two-wheelers and dense Asian mega-cities, where micro-mobility trips rarely exceed 15 km.
Chemistry advances, such as lithium-iron-phosphate with higher energy density, are shaving pack weight and opening new body-style possibilities. By the late decade, mid-range packs may retain dominance in the total electric vehicle taxi market size, yet high-capacity variants will underpin premium fare classes and airport corridors. Ride-hailing held a leading share of the new energy vehicle taxi market in 2024 and is expected to maintain strong growth as corporate travel, airport transfers, and daily commutes increasingly shift to app-based services.
Geography Analysis
APAC EV Taxi Market
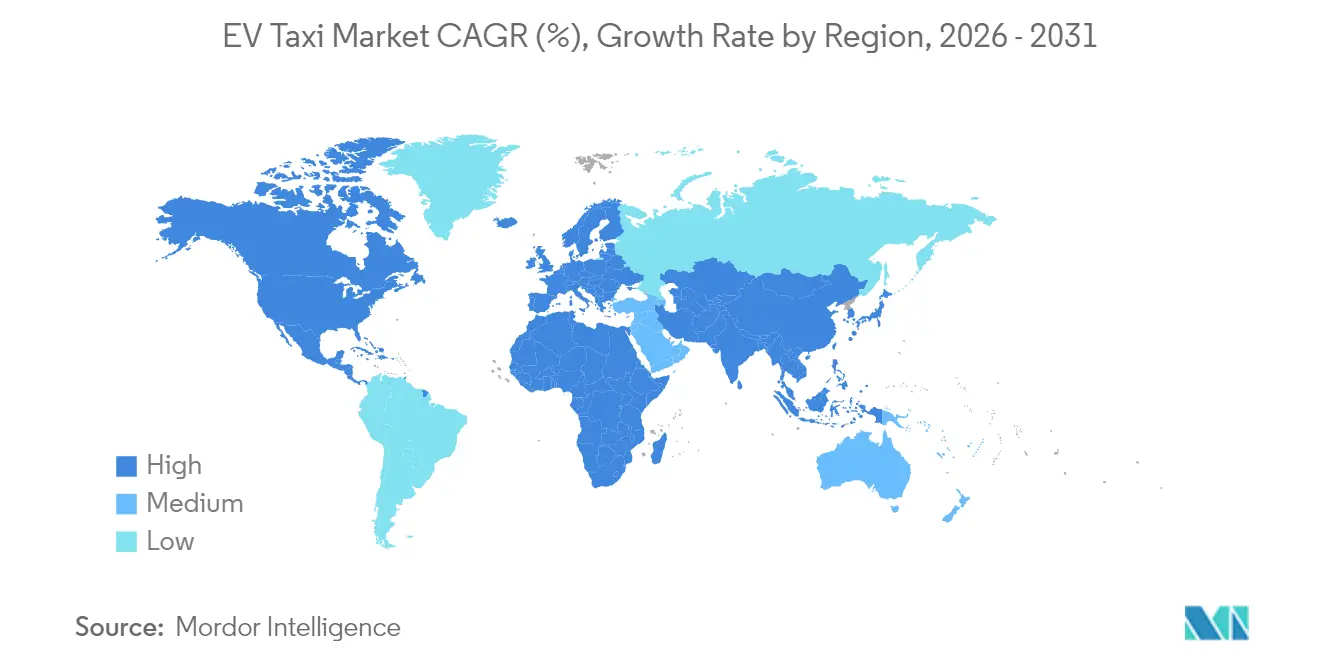
Asia-Pacific holds 43.02% share of the EV taxi market in 2025, reflecting China’s manufacturing heft, India’s two-wheeler boom, and proactive policy incentives in Japan, South Korea, and Australia. Provincial dual-credit schemes in China allow fleet operators to trade compliance certificates, improving project economics. India’s FAME-II subsidies, meanwhile, boost localization of battery packs and chargers, deepening domestic supply chains that stabilize retail pricing.
MEA EV Taxi Market
The Middle East and Africa will record the fastest 28.45% CAGR through 2031, led by the United Arab Emirates’ zero-emission ground-transport vision for Expo 2030 and Saudi Arabia’s NEOM smart-city blueprint. Generous electricity tariffs and abundant solar capacity further reduce operating costs. Egypt and Morocco are rolling out green-bond-funded taxi electrification schemes, drawing on multilaterals for concessional finance.
The Americas and Europe EV Taxi Market
California’s Advanced Clean Fleets rule sets the tone, while New York City caps new internal-combustion taxi medallions. Europe benefits from mature public charging networks, but lingering energy-price volatility still impacts driver payback calculations. South America trails due to exchange-rate risk and elevated cost of capital, yet Brazil and Colombia have begun piloting tariff discounts for overnight fleet charging.

Regulatory Landscape
Regulation for EV taxis is being shaped by city and fleet-level electrification mandates, EV eligibility rules tied to fiscal incentives, and charging interoperability requirements. In the United States, New York City Taxi and Limousine Commission rules under the Green Rides Initiative require high-volume for-hire services to dispatch 25% of trips to zero-emission vehicles (ZEVs) or wheelchair-accessible vehicles (WAVs) in 2026, rising to 40% in 2027. This creates a dispatch-driven compliance trigger that affects platform fleets and affiliated operators.
In China, purchase-tax incentives are linked to technical qualification lists and updated standards. From January 1, 2026, EVs must meet revised technical requirements to qualify for purchase tax exemptions under MIIT, Ministry of Finance, and State Taxation Administration Announcement No. 24 (2025), and MIIT Public Announcement No. 14 (2026) updates the eligible-vehicle catalog for the 2026-2027 period. In the European Union, policy emphasis increasingly sits with enabling measures such as charging infrastructure rules (for example under the Alternative Fuels Infrastructure framework) and national and local taxi/ride-hailing operating rules, leaving city-level electrification measures to play a larger role where taxi licensing sits with municipalities.
Value Chain Analysis
The EV taxi value chain starts with upstream battery materials and cell supply, then moves into OEM vehicle production, including taxi-suitable high-duty-cycle trims. From there, financing and fleet acquisition channels (leasing, subscription, and platform-enabled rentals) feed into charging and energy services, spanning public fast charging, depot charging, and, in some markets, battery swapping. Utilization then flows through dispatch and operations via taxi operators and ride-hailing platforms.
Platforms increasingly act as demand aggregators and orchestrators of downstream services by linking driver access to vehicles and charging with in-app dispatch, uptime tools, and, in some cases, bundled insurance and maintenance. Recent partnerships show how procurement, financing, and infrastructure are being packaged to reduce conversion friction. Uber and BYD announced a multi-year agreement to add 100,000 BYD EVs onto the Uber platform across multiple regions, while Grab partnered with BYD to broaden EV access for drivers in Southeast Asia via rental and ownership financing schemes. On the infrastructure side, Inspiration Mobility Group and WHC Worldwide (zTrip) opened a high-speed commercial multi-fleet charging depot concept in Kansas City, and U Power with Sumitomo Mitsui Auto Leasing supported a battery-swapping taxi deployment in Phuket, highlighting alternative approaches to reducing charging downtime, a key operational constraint for high-mileage taxi duty cycles.
Competitive Landscape
Market rivalry straddles automakers, platform companies, and specialist fleet operators. Uber and Lyft wield scale to negotiate bulk discounts, sometimes integrating direct-to-driver financing that speeds uptake. Chinese OEMs such as BYD, SAIC, and Geely leverage vertically integrated battery supply to undercut legacy manufacturers on price, enabling wider penetration into value-sensitive taxi segments.
Regional pure-plays also emerge. India’s BluSmart Mobility operates a fully electric fleet plus proprietary fast-charging depots across Delhi-NCR and Bengaluru. Vietnam’s GSM Green and Smart Mobility replicates the strategy, integrating home-grown ride-hailing software with charging infrastructure. Airports increasingly award exclusive concessions to operators committing to 100% zero-emission fleets, shifting competitive advantage toward early movers.
Regional pure-plays also emerge. India’s BluSmart Mobility operates a fully electric fleet plus proprietary fast-charging depots across Delhi-NCR and Bengaluru. Vietnam’s GSM Green and Smart Mobility replicates the strategy, integrating home-grown ride-hailing software with charging infrastructure. Airports increasingly award exclusive concessions to operators committing to 100% zero-emission fleets, shifting competitive advantage toward early movers.
EV Taxi Industry Leaders
Uber Technologies Inc.
Didi Chuxing Technology Co.
Grab Holdings Ltd.
Lyft Inc.
Ola Electric Mobility Pvt Ltd. (Ola Cabs)
- *Disclaimer: Major Players sorted in no particular order
EV Taxi Market Companies Covered in this Report
- Lyft Inc.
- Ola Electric Mobility Pvt Ltd. (Ola Cabs)
- Uber Technologies Inc.
- Grab Holdings Ltd.
- Didi Chuxing Technology Co.
- GoGreen Cabs
- Phoenix Taxis
- CAB-EEZ Infra Tech Ltd
- XANHSM Green and Smart Mobility Indonesia (GSM)
- Prakriti E-Mobility Private Limited (Evera Cabs)
- eee-Mobility Solutions Private Limited
- Electric Cab North America
- Free Now GmbH
- Addison Lee Limited
- G7 New Energy Taxi (Beijing) Co.
- Yandex Go
- Bolt Technology OU

Recent Industry Developments in EV Taxi Market
- May 2026: Uber, Nuro, and Lucid named Houston as the second market for their next-generation autonomous robotaxi program and secured a 50,000-square-foot depot to support operations. The development adds a dedicated facilities layer to the EV taxi ecosystem, linking vehicle supply, fleet operations, and charging and servicing readiness for high-utilization service models.
- March 2026: Uber announced a partnership with Rivian to deploy up to 50,000 autonomous R2-based robotaxis, alongside an investment commitment of up to USD 1.25 billion through 2031. The agreement tightens the integration between ride-hailing platforms and EV OEM roadmaps, influencing long-term fleet procurement, maintenance planning, and charging infrastructure needs for taxi-like duty cycles.
- July 2024: Uber and BYD announced a strategic partnership targeting the addition of 100,000 BYD electric vehicles to the Uber platform across multiple global markets. This expanded the pool of commercially oriented EV supply tied to a large dispatch platform, supporting faster fleet turnover where driver financing and vehicle availability constrain adoption.


EV Taxi Market Report Scope and Research Methodology
Market Definition and Coverage
This market covers paid passenger transport services where the trip is delivered using an electric taxi, including ride-hailing and fleet-based taxi operations, and it is measured in revenue terms at the market level across major regions.
Scope exclusions: Private EV passenger cars used for personal commuting and non-passenger electric commercial vehicles are excluded from this sizing.
Segments Covered in This Report
- By Propulsion Type
- Battery Electric Vehicle (BEV)
- Plug-in Hybrid Electric Vehicle (PHEV)
- Hybrid Electric Vehicle (HEV)
- Fuel-Cell Electric Vehicle (FCEV)
- By Vehicle Type
- Two-wheeler Taxi
- Three-wheeler Taxi
- Four-wheeler Taxi (Sedan/Hatchback)
- Multi-Purpose Vehicle / Minivan
- By Service Model
- Ride-hailing (On-demand)
- Ride-sharing (Pooling)
- Corporate / Institutional Fleet
- Airport and Tourism Shuttle
- By Ownership Model
- Fleet-Owned / Operator
- Driver-Owned
- Leasing and Subscription
- By Battery Capacity
- Less than 30 kWh
- 30-60 kWh
- Above 60 kWh
- By Geography
- North America
- United States
- Canada
- Rest of North America
- South America
- Brazil
- Argentina
- Rest of South America
- Europe
- Germany
- United Kingdom
- France
- Italy
- Spain
- Netherlands
- Norway
- Russia
- Rest of Europe
- Asia-Pacific
- China
- India
- Japan
- South Korea
- Australia
- Indonesia
- Thailand
- Rest of Asia-Pacific
- Middle East and Africa
- United Arab Emirates
- Saudi Arabia
- Turkey
- Egypt
- South Africa
- Rest of Middle East and Africa
- North America
Data Sources, Market Sizing, and Validation
Desk Research
Desk research was used to build the starting structure for the model and to anchor it to real-world mobility and EV adoption signals. We reviewed public transportation and mobility statistics, charging and electrification indicators, and policy direction that impacts taxi fleets.
Common inputs came from sources such as the International Energy Agency for EV stock and charging trends, the International Transport Forum and World Bank for urban mobility indicators, U.S. DOT and Eurostat for transport and vehicle registration context, and UN Comtrade for trade direction on relevant vehicle categories where it helped as a cross-check. We also used company annual reports, investor decks, and reputable press to map fleet rollout timelines and pricing cues, and we supplemented this with paid databases for company financials and for patent activity to understand technology shifts. The desk sources mentioned here are illustrative, and other public references were also used for data collection, validation, and research clarification.
Primary Interviews and Surveys
Primary work focused on validating how quickly taxi fleets are electrifying, how utilization and pricing differ by city type, and what portion of new fleet additions are truly electric across key regions. We spoke with a mix of fleet operators, charging ecosystem participants, and mobility stakeholders, and then used their inputs to close gaps where public datasets do not separate taxis from broader EV totals.
Distribution of primary research fieldwork respondents
| Company type | Respondent position | Region |
|---|---|---|
| Top tier: 36% | CXOs: 12% | APAC: 41% |
| Mid tier: 43% | Functional/Unit leaders: 43% | EMEA: 35% |
| Smaller Players: 21% | Managers: 45% | Americas: 24% |
Market-Sizing & Forecasting
The core sizing starts from a demand-pool build where taxi activity and fleet electrification signals are reconstructed at the regional level, and then converted into revenue using realistic pricing and utilization assumptions. For the top-down and bottom-up logic, taxi fleet population and replacement cycles are combined with EV taxi penetration rates validated through interviews, and then translated into annual market value using average fare yields and service intensity.
To keep the totals grounded, we used selective bottom-up approximations as a check, such as sampling fleet rollouts, city-level EV taxi targets, and sampled ASP x volume checks on vehicle additions where public programs provide counts. Key variables used (illustrative) included EV taxi share in fleet additions, average daily kilometers per taxi, average fare per kilometer or per trip, charging access and downtime patterns, and policy triggers like zero-emission zones and taxi licensing requirements. For forecasting, scenario analysis was used, since adoption speed depends on policy enforcement, charger rollout, and battery cost direction, and these were stress-tested with expert views before the final curve was locked. Where granular local fleet data was missing, gaps were filled using proxy city cohorts (similar urban density and regulation profile) and then adjusted through interview-based correction factors.
Data Validation & Update Cycle
Outputs were checked against independent signals so the values do not drift away from real adoption conditions, such as EV fleet announcements, charging deployment pace, and publicly stated city electrification targets for taxi permits. Variance checks were run by region and year, and outliers were reviewed again with supporting assumptions before sign-off.
Each estimate is reviewed in multiple steps, starting with model logic review, followed by input sanity checks, and then final consistency checks across regions and propulsion types. The report is refreshed annually, and interim updates are triggered when material events occur, such as policy changes that accelerate electrification or major shifts in fleet rollout plans. Before delivery, a fresh validation pass is completed so clients receive the latest updated view.
Mordor Intelligence's Ev Taxi Market Size Measured Against Other Published Estimates
Published market values for EV taxis can vary widely because the category sits between mobility services and vehicle electrification, and different authors mix these boundaries in different ways. Differences also show up when one estimate is built from fleet and utilization signals, while another leans more on broad EV sales narratives.
Two-wheeler taxi services are counted here, and that item sits inside Mordor Intelligence's scope, which can move totals versus estimates that only count four-wheeler electric cabs or only include battery electric vehicles. Other gaps typically come from how ride-hailing versus traditional street-hail is treated, how fast penetration is assumed to rise after mandates, and whether currency conversion is taken at a single spot rate or averaged through the year.
Benchmark comparison
| Source | Market Size | Gaps in Research Methodology |
|---|---|---|
| Mordor Intelligence | USD 36.81 B (2026) | |
| Trade Journal A | USD 18.00 B (2024) | Uses an earlier base year and a narrower demand definition in many writeups, and it often blends EV taxi growth with general EV adoption without consistently tying revenue to taxi utilization and fare yield. |
| Industry Publication B | USD 25.17 B (2025) | Carries a longer-dated forecast horizon and typically presents a broad electric taxi number with limited clarity on whether hybrids, fuel-cell vehicles, and two-wheeler taxi services are included, which changes the counted addressable pool. |
The comparison shows that year selection and scope handling are the biggest drivers of spread, more than math differences. When fleet size, EV penetration, and service intensity are tracked consistently, the final market value becomes easier to replicate and easier to pressure-test during updates.


Key Questions Answered in the Report
How fast is the electric vehicle taxi segment growing compared with conventional taxis?
Fleet electrification is projected to climb at a 24.6% CAGR through 2031 versus single-digit growth for conventional models, driven by lower operating cost and stricter emission mandates.
Which region will add the most new electric taxis by 2031?
Asia-Pacific will supply the highest absolute unit additions, yet the Middle East and Africa will register the fastest 28.45% CAGR on a smaller base.
Do operators prefer outright purchase or subscription for batteries?
Leasing and battery-as-a-service contracts are forecast to expand at 26.7% CAGR as they shift battery degradation risk away from drivers and reduce initial capital outlay.
What battery size dominates urban taxi operations?
Packs in the 30–60 kWh range account for 51.83% of active fleets because they balance 250 km daily range with manageable weight and cost.
Will plug-in hybrids remain relevant after 2028?
PHEVs fill infrastructure gaps today, but jurisdictions phasing them out of zero-emission definitions could dampen demand later in the decade.
Page last updated on:


 Your data is secure and never sold or shared.


