
Market Overview
| Study Period | 2021 - 2031 |
|---|---|
| Forecast Data Period | 2026 - 2031 |
| Historical Data Period | 2021 - 2024 |
| Market Volume (2026) | 336.90 gigawatt |
| Market Volume (2031) | 479.25 gigawatt |
| Growth Rate (2026 - 2031) | 7.30 % |
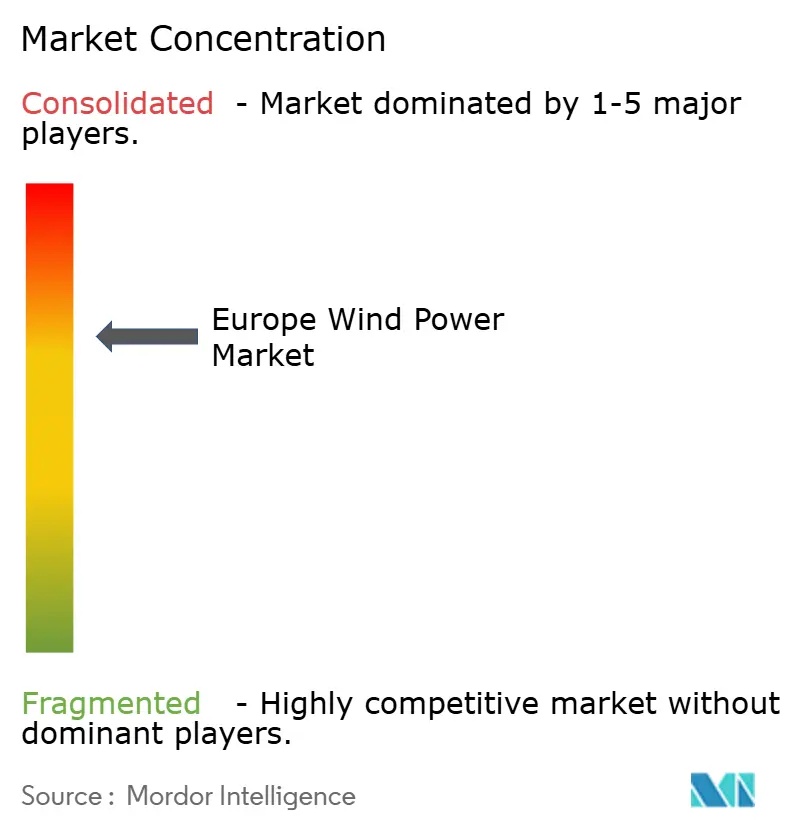
| Market Concentration | Medium |
Major Players *Disclaimer: Major Players sorted in no particular order Image © Mordor Intelligence. Reuse requires attribution under CC BY 4.0. | |
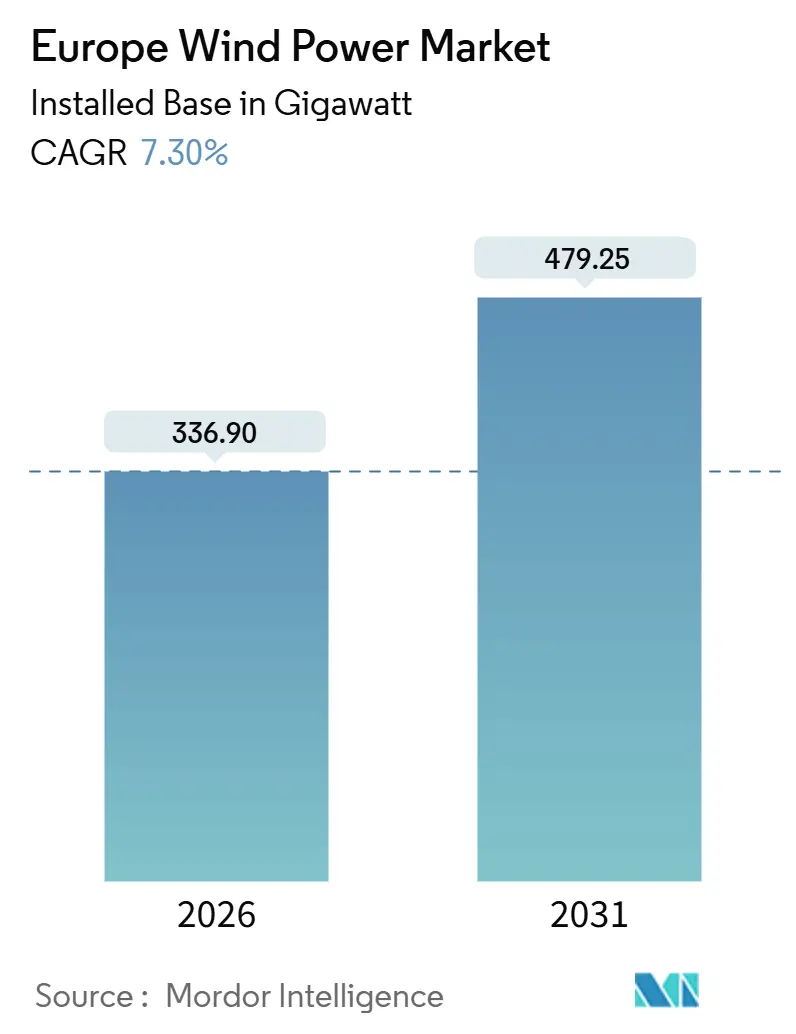
Europe Wind Power Market Analysis by Mordor Intelligence
The Europe Wind Power Market size in terms of installed base is expected to grow from 336.90 gigawatt in 2026 to 479.25 gigawatt by 2031, at a CAGR of 7.30% during the forecast period (2026-2031).
The expansion stems from binding Fit-for-55 targets, accelerating corporate demand for long-term power-purchase agreements, rapid reductions in the levelized cost of electricity, and the commercialization of floating offshore technology. On and offshore turbine upsizing is lowering per-megawatt foundation counts, while utility acquisitions of independent power producers are deepening vertical integration and securing project pipelines. Grid congestion looms as the most immediate constraint, but large-scale battery co-location and new interconnectors are beginning to ease curtailment pressures. Supply-chain localization for towers, blades, and cables is gathering momentum as policymakers emphasize strategic autonomy, yet rare-earth magnet dependence on Chinese refining remains an unresolved vulnerability.
Key Report Takeaways
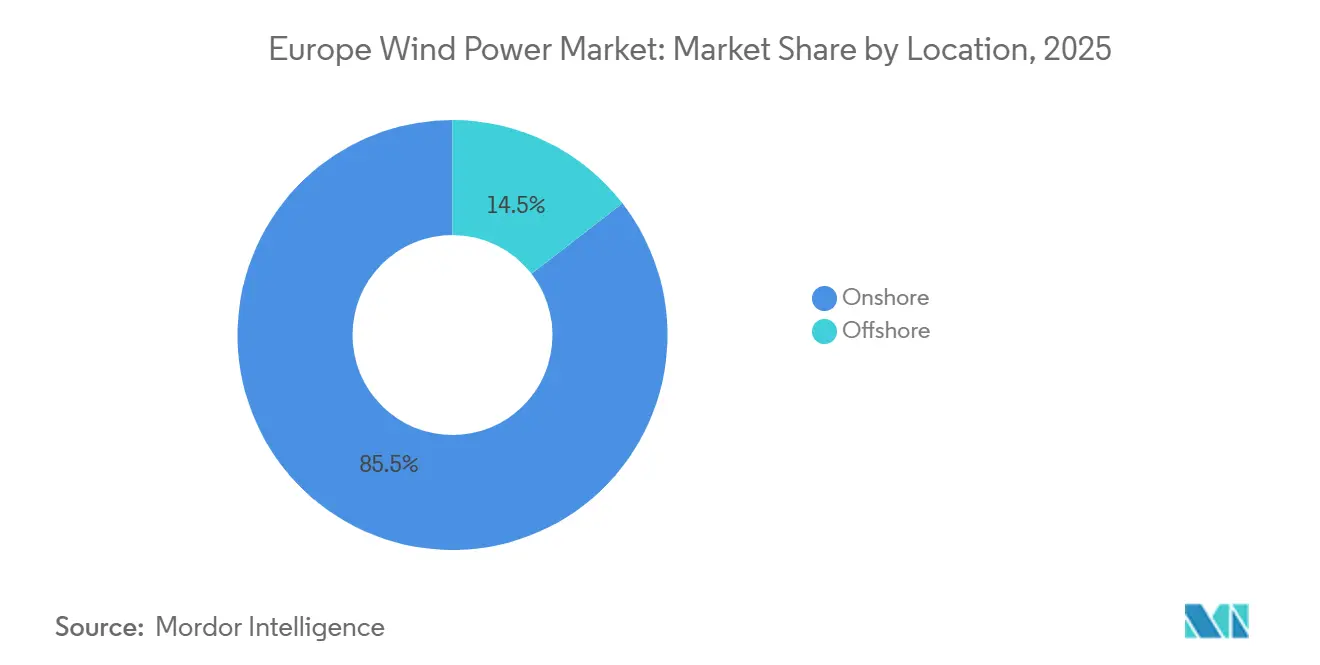
- By location, onshore installations held an 85.5% Europe wind power market share in 2025, whereas offshore capacity is forecast to climb at a 17.2% CAGR through 2031.
- By turbine capacity, the 3 to 6 MW class led with 51.1% of the European wind power market size in 2025, while turbines above 6 MW are set to expand at a 15.8% CAGR during 2026-2031.
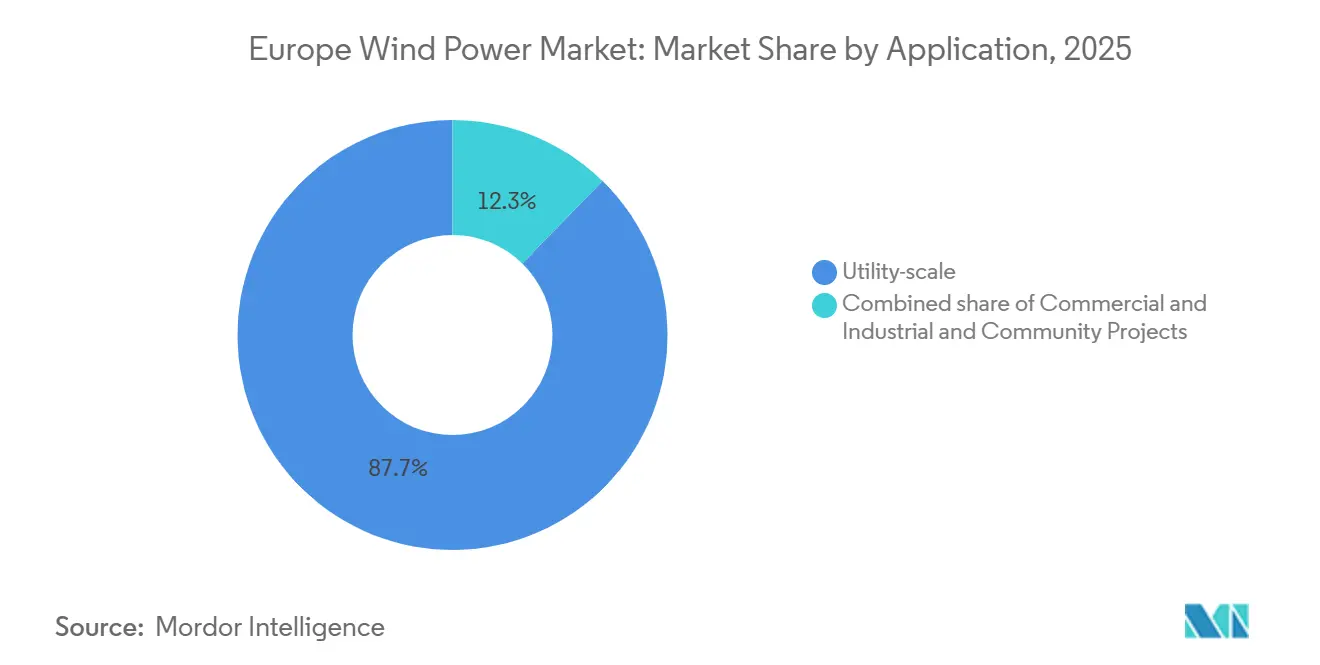
- By application, utility-scale projects captured 87.7% of 2025 capacity; commercial and industrial installations are advancing at a 15.4% CAGR to 2031.
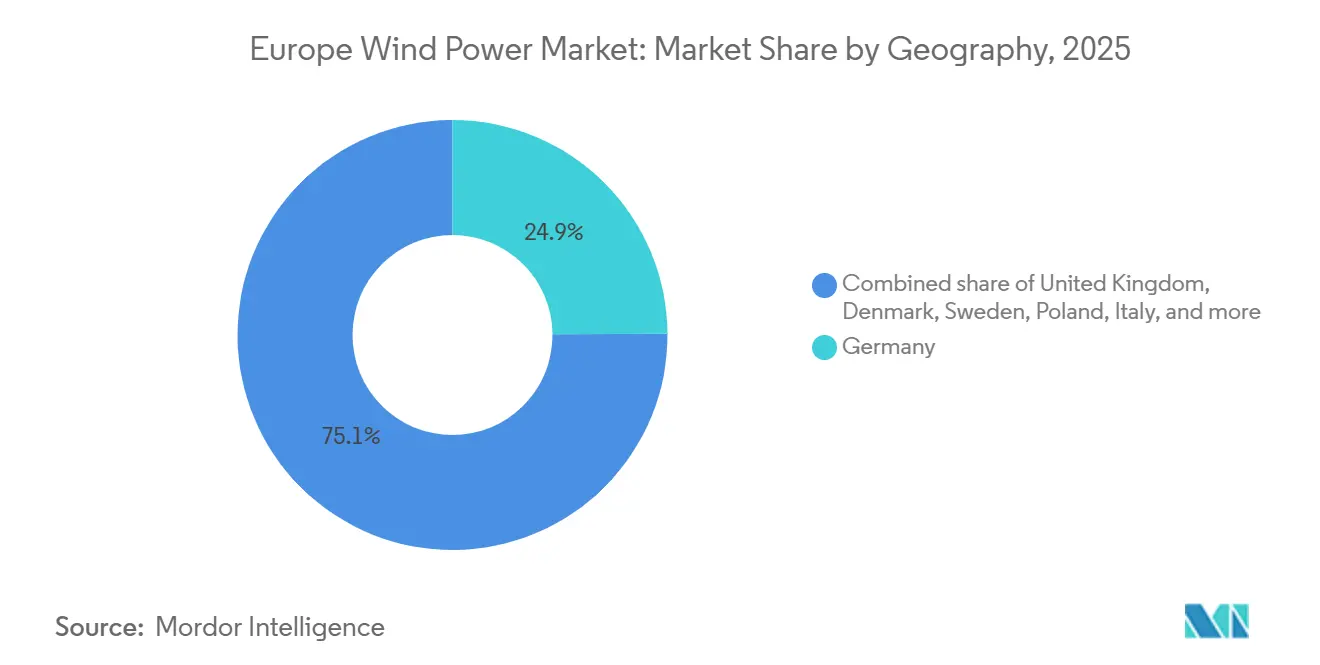
- By geography, Germany commanded 24.9% of installed capacity in 2025, whereas Poland is poised for the fastest growth at a 17.5% CAGR through 2031.
Note: Market size and forecast figures in this report are generated using Mordor Intelligence’s proprietary estimation framework, updated with the latest available data and insights as of January 2026.
Europe Wind Power Market Trends and Insights
Drivers Impact Analysis*
| Driver | (~) % Impact on CAGR Forecast | Geographic Relevance | Impact Timeline |
|---|---|---|---|
| EU Green Deal & Fit-for-55 targets | +1.8% | Pan-European, strongest in Germany, Denmark, Netherlands | Long term (≥ 4 years) |
| Rapid LCOE decline of on- & offshore turbines | +1.5% | Global, with pronounced effects in UK, Germany, Poland | Medium term (2-4 years) |
| Surging corporate PPA demand | +1.2% | Western Europe (Germany, France, UK, Netherlands), expanding to Poland, Spain | Medium term (2-4 years) |
| Repowering of >15-year onshore fleets | +0.9% | Germany, Spain, Denmark, with early gains in Lower Saxony, Schleswig-Holstein | Short term (≤ 2 years) |
| Commercialisation of floating offshore wind | +0.7% | UK (Scotland), Norway, France (Brittany), Portugal | Long term (≥ 4 years) |
| Next-gen recyclable blade technology | +0.4% | Pan-European, pilot deployments in Germany, Denmark, UK | Long term (≥ 4 years) |
| Source: Mordor Intelligence | |||
EU Green Deal & Fit-for-55 Targets
The legislative package obliges member states to update national energy and climate plans every two years and lifts the 2030 renewable-electricity target to 45%, implying a 500 GW wind fleet, 63% above 2025 capacity.[1]European Commission, “Delivering the European Green Deal,” europa.eu Carbon border adjustment on steel and cement from 2026 is steering tower and foundation production back into the continent. Germany earmarked EUR 4.6 billion in 2025 for grid reinforcement to integrate 145 GW of wind by 2030. Denmark’s Energy Island will hub 10 GW of offshore wind and export surplus power, illustrating how transnational coordination multiplies national build-outs. Policy momentum, therefore, keeps the European wind power market on a high-growth trajectory despite supply-chain headwinds.
Rapid LCOE Decline of On- & Offshore Turbines
Onshore levelized costs slid to EUR 0.043–0.092 /kWh in 2024, while offshore costs fell to EUR 0.055-0.103 /kWh as 15 MW platforms trimmed balance-of-system expenses.[2]Fraunhofer ISE, “Cost of Electricity from Renewable Energy Technologies in Germany 2024,” ise.fraunhofer.de The UK’s 2024 CfD round cleared offshore bids 30% below the strike price, proving merchant risk tolerable in robust demand centers.[3]UK Department for Energy Security and Net Zero, “Electricity Generation Costs 2024,” gov.uk Poland’s onshore auction undercut coal generation for the first time, prompting accelerated plant retirements. Vestas’ V162-6.2 MW turbine delivered a 48% capacity factor in inland Germany during 2025, underscoring how larger rotors boost yields on legacy sites. Declining generation costs underpin competitive pricing for corporate PPAs and confirm the cost advantage driving the European wind power market.
Surging Corporate PPA Demand
Corporate contracts rebounded to pre-energy-crisis levels as firms sought price certainty and granular hourly carbon matching under the Corporate Sustainability Reporting Directive. Amazon’s 300 MW Baltic Eagle virtual PPA and Microsoft’s 500 MW Scandinavian portfolio both embed 24/7 clean-energy clauses, escalating demand for firmed wind output. EDF’s aggregation platform now allows small enterprises to access long-duration contracts, once limited to large buyers. This PPA momentum guarantees offtake for new capacity and fortifies the European wind power market against subsidy rollbacks.
Repowering of >15-Year Onshore Fleets
Germany, Spain, and Denmark collectively host over 40 GW of turbines installed before 2010. Swapping 2 MW machines for 6 MW models triples output using existing grid links and roads, delivering internal rates of return above 12% without subsidies. Repowering avoids fresh land-use conflicts and respects new setback rules, making it the quickest path to volume additions. Lower Saxony and Schleswig-Holstein saw the first wave of 5 MW-plus retrofits in 2025, cutting project timelines by half. As feed-in-tariff expiries approach, repowering is expected to add 6-8 GW annually, reinforcing the pipeline for the European wind power market.
Restraints Impact Analysis*
| Restraint | (~) % Impact on CAGR Forecast | Geographic Relevance | Impact Timeline |
|---|---|---|---|
| Grid congestion & weak interconnection build-out | -1.1% | Germany, Spain, UK, with acute bottlenecks in Bavaria, Andalusia, Scotland | Short term (≤ 2 years) |
| Lengthy permitting & local opposition | -0.8% | Pan-European, most severe in Germany, France, Sweden | Medium term (2-4 years) |
| Biodiversity litigation risk (birds, marine mammals) | -0.5% | Germany, Netherlands, UK, Denmark (offshore), Spain (raptor corridors) | Medium term (2-4 years) |
| Rare-earth magnet supply-chain exposure | -0.4% | Global, with heightened risk for European OEMs reliant on Chinese neodymium | Long term (≥ 4 years) |
| Source: Mordor Intelligence | |||
Grid Congestion & Weak Interconnection Build-Out
Germany curtailed 8.2 TWh of wind in 2023 at a taxpayer cost of EUR 3.1 billion as SuedLink and SuedOstLink slipped to 2028 completion. Spain faced 2.5 TWh in 2023 curtailments, and the UK’s grid queue hit 283 GW with seven-year wait times. While the 1.4 GW NeuConnect link eased some constraints, only 2% of the transfer capacity needed to smooth continental imbalances is live. RWE’s 500 MW battery at Kaskasi shows storage can claw back six percentage points of effective capacity, but large-scale transmission remains the critical bottleneck limiting near-term gains for the European wind power market.
Lengthy Permitting & Local Opposition
Despite Renewable Energy Directive III’s two-year cap, approval times averaged 4-5 years in key markets during 2024-2025. Germany’s high court added extra assessments near UNESCO sites, delaying 1.8 GW of projects. France still requires 17 consultations per onshore project, though a 2025 decree trimmed the list to 12 and capped appeals at 90 days. Sweden’s municipal veto halted a 400 MW plant in February 2025. Until streamlined processes truly bite, permitting friction will temper the growth trajectory of the European wind power market.
*Our forecasts treat driver/restraint impacts as directional, not additive. The impact forecasts reflect baseline growth, mix effects, and variable interactions.
Segment Analysis
By Location: Offshore Acceleration Reshapes Deployment Mix
Offshore wind is expanding at a 17.2% CAGR, double the European wind power market average, as floating platforms unlock water depths beyond 60 m. Onshore assets still represented 85.5% of the European wind power market size in 2025, grounded in Germany’s 60 GW fleet and Spain’s 30 GW base. ScotWind’s 10.5 GW awards and Poland’s 8 GW Baltic pipeline will lift offshore’s share to 22% by 2031. Offshore projects carry 45-55% capacity factors and 15-year CfDs, de-risking revenues, whereas onshore greenfield builds battle land-use constraints. Repowering 20-year turbines with 6 MW machines triples output on fixed interconnections, preserving onshore relevance and ensuring a balanced expansion across the European wind power market.
Second-generation floating standards (IEC 61400-3-2) harmonize requirements, slicing certification costs by 15%.[4]International Electrotechnical Commission, “IEC 61400 Series,” iec.ch Offshore lead times of five to seven years remain longer than onshore, but capacity factors compensate, attracting capital. Onshore growth now clusters in Poland and Sweden, while Denmark and the Netherlands pivot toward sea-based projects. This evolving mix underpins a resilient deployment outlook for the Europe wind power market.


By Turbine Capacity: Scale Race Favors Above 6 MW Segment
Turbines over 6 MW are growing at a 15.8% CAGR, driven by offshore demand and tall-tower repowering. The 3-6 MW class held 51.1% of the European wind power market share in 2025, filling the sweet spot for inland repowers. Vestas’ V236-15 MW machine at Hollandse Kust Zuid generates 80 GWh annually per unit, cutting foundation counts by 65% and slashing balance-of-system costs by EUR 150 million per project. Direct-drive designs like Siemens Gamesa’s SG 14-236 DD extend maintenance intervals to 18 months, enhancing availability to 97%. Up-to-3 MW models retreat to radar-height-restricted niches in Poland and Italy but retain relevance where grid feeders are limited. Logistics for 80-m blades challenge inland routes, yet Sweden and Finland exploit pre-engineered timber roads to host 7 MW class machines. Turbine scaling remains the prime lever for lowering LCOE and sustaining competitiveness in the European wind power market.
By Application: Utility-Scale Dominance Masks C&I Surge
Utility-scale assets accounted for 87.7% of 2025 installations, undergirded by CfDs, feed-in premiums, and auction schemes. Nonetheless, commercial and industrial capacity is rising at a 15.4% CAGR as corporations chase Scope 2 compliance and 24/7 clean energy. Amazon’s Baltic Eagle contract-for-difference and Microsoft’s storage-coupled Scandinavian PPAs exemplify new structures favoring temporal matching. Community wind enjoys localized growth in Denmark, where cooperatives own 30% of onshore capacity, easing local resistance. Utility-scale clusters will stay dominant, but diversified contracting broadens demand channels, reinforcing the long-run health of the European wind power market.
Large-scale arrays such as the 1.4 GW Hollandse Kust Zuid reach EUR 0.049 /kWh LCOE, 40% below distributed 10 MW farms. Yet aggregated C&I platforms now let small buyers pool demand and secure multi-decade contracts, democratizing access to low-cost wind. Community schemes in Schleswig-Holstein grant residents equity stakes, neutralizing NIMBY pushback. The coexistence of these models illustrates a maturing European wind power industry that flexibly matches investor risk profiles with offtaker needs.
Geography Analysis
Germany maintained 24.9% of Europe's wind power market size in 2025, yet 8.2 TWh of curtailed output highlighted grid deficits that will persist until SuedLink and SuedOstLink come online in 2028. Poland delivers the fastest 17.5% CAGR through 2031 on the back of doubled auction volumes, simplified permits on former coal-mining land, and 15-year CfDs at PLN 319 /MWh that derisk financing. The United Kingdom boasts a 50 GW offshore pipeline, yet a 283 GW connection queue forces developers into non-firm grid access, amplifying curtailment exposure.
France's AO6 tender awarded 2 GW of floating capacity and imposed 50% local content, spurring nacelle and tower factories in Le Havre and Cherbourg. Spain faced 2.5 TWh of curtailment in 2023 across Castilla y León and Galicia, underscoring the three-to-five-year lag between transmission and generation growth. Italy's 2025 Semplificazione decree accelerated repowering approvals, unlocking 1.2 GW of upgrades in the south. Sweden and Denmark prioritize offshore expansion and repowering thanks to land-use constraints, with Denmark's Energy Island poised to add 10 GW and export surplus power to neighbors.
Rest-of-Europe countries collectively hold 18% of capacity. Norway's 1.5 GW Sørlige Nordsjø II floating tender demands 50% domestic sourcing, while Ireland eyes 5 GW by 2030. Cross-border interconnectors such as NeuConnect's 1.4 GW link between Germany and the UK marginally relieve imbalances but remain well below the capacity needed to stabilize high wind penetration. Geographic diversification, therefore, balances legacy congestion with emerging growth corridors and secures demand for the European wind power market.
Regulatory Landscape
The European wind power market is operating under an increasingly harmonized EU framework, anchored by the revised Renewable Energy Directive (RED III, 2023/2413) and the EU Wind Power Action Plan (October 2023). RED III raises the 2030 renewables ambition and adds procedural tools intended to shorten lead times, including the obligation for Member States to complete coordinated spatial mapping for renewable energy areas by 21 May 2025 and to designate Renewables Acceleration Areas (RAAs) by 21 February 2026, which are meant to simplify and standardize permitting for wind projects.
Policy execution is also reshaping tender economics. As of 2026, Member States are required to apply non-price criteria in wind energy auctions, shifting procurement away from price-only awards toward factors such as sustainability, supply-chain resilience, and grid integration. In parallel, the European Wind Charter (covering 2024-2026) sets out a public commitment framework between EU energy ministers and industry, while uneven transposition and RAA designation across countries continue to drive permitting variability despite the EU-level push to accelerate deployment.
Competitive Landscape
Vestas, Siemens Gamesa, and Nordex captured 68% of 2025 turbine orders, yet Goldwind and MingYang gained a foothold by pricing 15-20% lower and partnering on local assembly in Poland and Spain. RWE’s EUR 1.2 billion purchase of Con Edison Clean Energy’s portfolio exemplifies utilities internalizing development pipelines to lock in merchant upside. Floating wind is the white-space frontier: only three commercial arrays operate, but 15 GW of awards position Equinor and TotalEnergies as early leaders leveraging oil-and-gas engineering expertise.
Component capacity constraints shape competitive dynamics. Prysmian’s cable backlog stretches to 2028, compelling developers to secure slots years in advance. Monopile yards operate near 95% utilization, creating a seller’s market for foundations. Vestas monetizes intellectual property through a 5% royalty deal granting Goldwind access to its V236 rotor, signaling a shift toward licensing income. Enercon’s repowering services delivered 18% operating margins in 2025 by bundling turbine swaps, decommissioning, and grid upgrades. Overall, a moderately consolidated supplier base coexists with rising Asian competition, shaping a dynamic European wind power industry.
Europe Wind Power Industry Leaders
Siemens Gamesa Renewable Energy
Vestas
Nordex
GE Vernova
Enercon
- *Disclaimer: Major Players sorted in no particular order

Market Opportunities and Future Outlook
Near-term opportunities cluster where policy-driven acceleration meets delivery bottlenecks: repowering, grid-enabling solutions, and compliance-ready procurement. Repowering is the most direct lever since it delivers new output from existing sites and connections, especially in Germany, Spain, and Denmark, where large pre-2010 fleets and feed-in-tariff expiries are pushing asset owners toward 5 MW-plus retrofits. Grid constraints keep storage co-location, flexible offtake structures, and interconnection-related services in focus, reinforced by the curtailment and grid-queue pressure already visible in core markets (for example, Germanys 8.2 TWh of wind curtailment in 2023 and the UKs 283 GW grid queue).
Procurement and investment signals are also strengthening demand pull for turbine OEMs and parts of the supply chain. WindEurope reported Europe invested EUR 45 billion in new wind projects in 2025, and governments awarded 29.4 GW through auctions, indicating pipeline replenishment even as execution risk persists. A second opportunity lane comes from Commission Implementing Regulation (EU) 2026/718, which sets minimum environmental sustainability requirements for onshore and offshore wind technology procurement for procedures launched on or after 30 June 2026, creating differentiation for suppliers that can document materials, circularity, and ESG-aligned manufacturing. At the same time, the EU push to shorten permitting timelines, including the Commissions 2026 communication calling for a maximum two-year permitting length by end-2026, keeps specialized permitting, environmental assessment, and stakeholder-management capabilities commercially relevant, particularly where biodiversity litigation and local opposition have delayed projects.
Recent Industry Developments
- April 2026: GE Vernova secured new onshore wind turbine orders in Germany, supplying 71.5 MW to BBWind and Greenvolt Power for multiple projects. The wins reinforce demand for utility-scale onshore additions and highlight the importance of established European supply and service capability as developers work through constrained grid and permitting environments.
- February 2026: Vestas received a firm order for the 1.38 GW Vanguard West offshore wind project in the United Kingdom, covering 92 V236-15.0 MW turbines. The order adds volume to the above-6 MW segment and signals continued developer preference for scaled platforms to reduce balance-of-system costs in large offshore builds.
- October 2024: Iberdrola and Masdar completed wind turbine installation at the Baltic Eagle offshore wind farm in Germanys Baltic Sea. The milestone advanced one of the regions high-profile offshore projects and supported Germanys offshore build-out by moving capacity closer to grid connection and commercial operation.


Research Methodology Framework and Report Scope
Market Definition and Coverage
This market is defined as the wind power installed base across Europe, measured in gigawatts (GW) of operational wind capacity. It covers the capacity in service across onshore and offshore wind projects within the covered European countries.
Scope exclusions: We exclude non-wind renewable capacity, electricity transmission and distribution assets, and the broader revenue pools of wind equipment manufacturing or O&M services unless they directly change installed wind capacity.
Segmentation Overview
- By Location
- Onshore
- Offshore
- By Turbine Capacity
- Up to 3 MW
- 3 to 6 MW
- Above 6 MW
- By Application
- Utility-scale
- Commercial and Industrial
- Community Projects
- By Component (Qualitative Analysis)
- Nacelle/Turbine
- Blade
- Tower
- Generator and Gearbox
- Balance-of-System
- By Geography
- Germany
- United Kingdom
- France
- Spain
- Italy
- Poland
- Sweden
- Denmark
- Rest of Europe
Data Sources, Market Sizing, and Validation
Desk Research
Desk research starts by building a clean view of Europe wind additions, cumulative installed capacity, and the policy pipeline that influences commissioning. For these inputs, we lean on public and official sources such as Eurostat energy statistics, ENTSO-E power system data, European Commission updates on renewables implementation and permitting, and national energy agency publications where country totals are clarified.
We also review trade association releases and datasets such as WindEurope statistics, plus regulatory and auction documents that indicate award volumes and expected commissioning windows. To keep the project and company context grounded, we use annual reports, investor presentations, and reputable press coverage of commissioning, repowering, and grid connection milestones. In a few places, paid subscriptions are used only for company financials and news screening, and for patent databases when technology shifts need to be checked. The desk sources listed here are illustrative, and additional references are used during data collection, cross-checking, and assumption clean-up.
Primary Interviews and Surveys
Primary interviews are used to validate how quickly capacity moves from awarded auctions into grid-connected assets, and where delays are most common (permitting, grid, supply constraints). We spoke with developers, EPC and service-side experts, component-side leaders, and advisors across major European wind markets, so the commissioning schedule assumptions and repowering rates stayed aligned with what is being executed on the ground.
Distribution of primary research fieldwork respondents
| Company type | Respondent position |
|---|---|
| Top tier: 33% | CXOs: 16% |
| Mid tier: 51% | Functional/Unit leaders: 33% |
| Smaller Players: 16% | Managers: 51% |
Market-Sizing & Forecasting
The core model is built using a top-down capacity stack, where country installed bases are reconstructed from historical additions, retirements, and expected commissioning from awarded pipelines. Those country totals are then rolled up to Europe, and split across onshore and offshore based on project commissioning and grid-connection timing.
To keep the numbers practical, we corroborate results with selective bottom-up approximations such as sampled project-by-project rollups for large offshore parks, and channel checks on annual additions versus turbine class mix (up to 3 MW, 3 to 6 MW, and above 6 MW). Key inputs used in the model include annual new installations (GW), decommissioning and repowering volumes, auction award volumes and expected delivery years, offshore grid-connection milestones, and country-level permitting and grid lead times. Where bottom-up detail is incomplete for smaller projects, gaps are handled using country historical shares and validated build-rate ranges from interviews.
For forecasting, scenario analysis is used around commissioning slippage and repowering acceleration, and the final path is chosen based on the most repeated expert consensus by country. This approach keeps the forecast tied to what can realistically be connected to the grid, not only announced capacity.
Data Validation & Update Cycle
Validation is done through several checks before numbers are finalized. Outputs are compared against independent signals such as Europe-wide installed capacity totals, annual installation run-rates, and publicly stated national targets, and then large variances are reviewed country by country.
When an anomaly appears, assumptions are revisited and we re-contact sources if the driver is a material change such as a policy shift, a grid constraint, or a major offshore commissioning delay. A multi-step analyst review is followed so that definitions, math, and unit consistency (GW vs additions) stay clean. Reports are refreshed annually, with interim updates when major events change the expected commissioning curve, and a final freshness pass is completed right before delivery.
Mordor Intelligence's Europe Wind Power Market Size Measured Against Other Published Estimates
Published estimates for Europe wind power do not always line up because the unit of measurement is not consistent, and the boundary between capacity and revenue is often mixed. Timing also matters because some sources use grid-connected capacity, while others track awarded pipelines or equipment spending, which can shift totals by year.
By tracking grid-connected installed base by country and refresh timing across auction and commissioning calendars, Mordor Intelligence is kept aligned to GW capacity in service, which differs from revenue-based views and from outlooks that emphasize only new annual additions.
Benchmark comparison
| Source | Market Size | Gaps in Research Methodology |
|---|---|---|
| Mordor Intelligence | USD 336.90 B (2026) | |
| Industry Association B | USD 285.00 B (2024) | Uses total installed capacity and annual additions reporting, with Europe and EU-27 definitions that can differ, and it does not present a market value series that maps cleanly into the 2026 to 2031 forecast window. |
| Regional Consultancy A | USD 30.36 B (2025) | Sized as a revenue market for the wind energy ecosystem (installation, integration, O&M), so the value reflects spending flows, not the installed capacity stock that grows each year. |
The spread in the table is mainly explained by what is being counted and in which year it is counted. When the scope is held to installed capacity versus spending, and when grid-connection timing is treated consistently across countries, the estimate becomes easier to reconcile with public capacity statistics and with the real commissioning pipeline.


Key Questions Answered in the Report
What is the installed capacity of the Europe wind power market in 2026?
What is the installed capacity of Europe wind power market in 2026?
How fast will offshore wind grow in Europe through 2031?
Offshore installations are projected to expand at a 17.2% CAGR, more than twice the overall market pace.
Which turbine size segment currently leads capacity share?
The 3 to 6 MW class held 51.1% of capacity in 2025.
Why is Poland considered the fastest-growing European wind market?
Streamlined permits on former coal land and doubled auction volumes give Poland a forecast 17.5% CAGR to 2031.
What policy package underpins future European wind deployment?
The EU Green Deal's Fit-for-55 legislation mandates a 55% emissions cut by 2030 and raises the renewable-electricity target to 45%.
How does grid congestion impact wind producers today?
Germany alone curtailed 8.2 TWh, costing EUR 3.1 billion in compensation payments and highlighting urgent transmission needs.
Page last updated on:


 Your data is secure and never sold or shared.


