
Market Overview
| Study Period | 2020 - 2031 |
|---|---|
| Forecast Data Period | 2026 - 2031 |
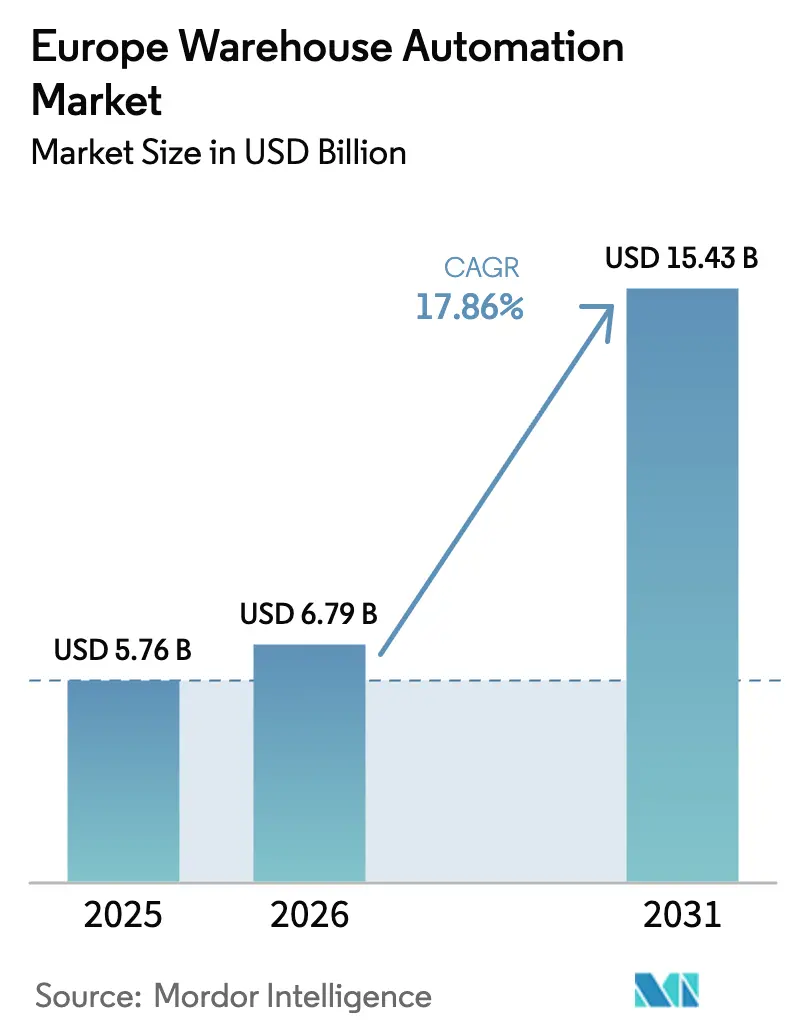
| Base Year Market Size (2025) | USD 5.76 Billion |
| Market Size (2026) | USD 6.79 Billion |
| Market Size (2031) | USD 15.43 Billion |
| Growth Rate (2026 - 2031) | 17.86 % |
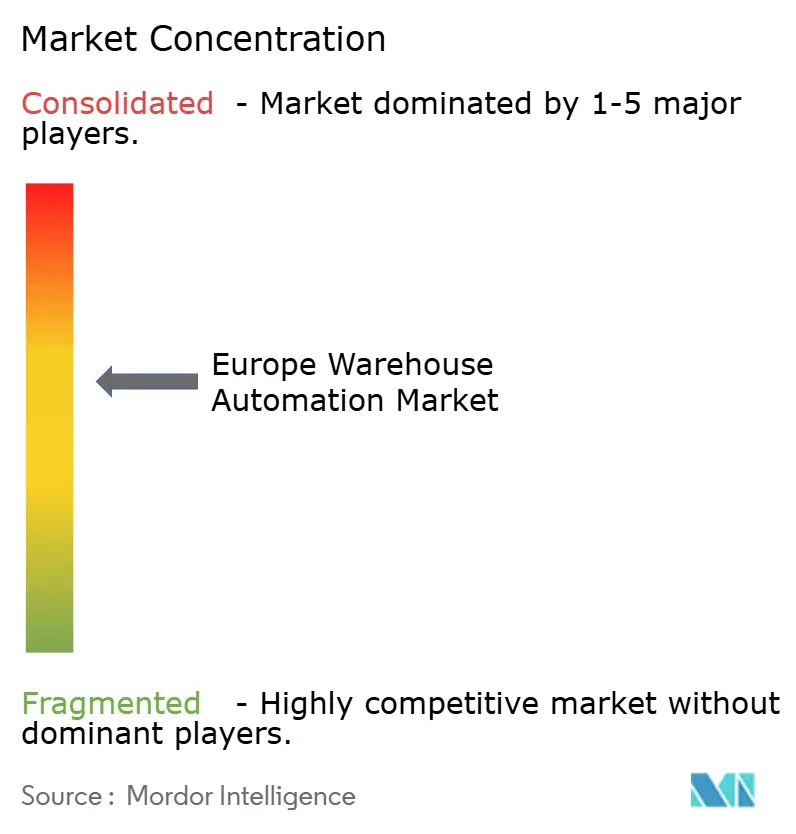
| Market Concentration | Medium |
Major Players *Disclaimer: Major Players sorted in no particular order Image © Mordor Intelligence. Reuse requires attribution under CC BY 4.0. | |
Europe Warehouse Automation Market Analysis by Mordor Intelligence
The Europe warehouse automation market size is expected to grow from USD 5.76 billion in 2025 to USD 6.79 billion in 2026 and is forecast to reach USD 15.43 billion by 2031 at 17.86% CAGR over 2026-2031. Order-processing speed, labor scarcity, and AI-driven robotics convergence are widening the adoption base at both greenfield and retrofit sites, while flexible financing models open the door to small and mid-sized operations. Hardware continues to anchor most investment thanks to high-ticket items such as automated storage and retrieval systems (AS/RS) and pallet conveyors, yet software layers that turn raw machine data into real-time decisions are growing even faster. Pan-European e-commerce, especially in groceries, keeps fulfillment volumes high in every quarter, encouraging warehouse operators to build distributed micro-fulfillment networks instead of a few mega hubs.[1] Simultaneously, stricter cold-chain regulations and sustainability goals press operators to install energy-efficient motors, edge-AI orchestration, and predictive analytics that lower kilowatt-hours per pick.
Key Report Takeaways
- By component, hardware retained 69.60% of the European warehouse automation market share in 2025; Software solutions are projected to post the highest 18.6% CAGR through 2031.
- By end-user industry, e-commerce and groceries led with a 32.45% revenue share of the European warehouse automation market in 2025; manufacturing is forecast to expand at a 19.15% CAGR between 2026-2031.
- By technology type, autonomous mobile robots (AMR) held 36.20% of the European warehouse automation market size in 2025; automated guided vehicles (AGV) are advancing at a 19.1% CAGR to 2031.
- By warehouse size, facilities above 40,000 m² accounted for 51.05% of the European warehouse automation market size in 2025, while small sites below 10,000 m² are growing at an 18.55% CAGR.
- By country, Germany represented 29.35% of the 2025 revenue of the European warehouse automation market, whereas Spain is set to post the highest 19.3% CAGR through 2031.
Note: Market size and forecast figures in this report are generated using Mordor Intelligence’s proprietary estimation framework, updated with the latest available data and insights as of 2026.
Market Trends and Insights
Drivers Impact Analysis of Europe Warehouse Automation Market*
| Driver | (~) % Impact on CAGR Forecast | Geographic Relevance | Impact Timeline |
|---|---|---|---|
| Exponential growth in e-commerce order volumes | +2.5% | Germany, UK, France | Short term (≤ 2 years) |
| Rapid Industry 4.0 adoption across manufacturing | +1.8% | DACH region, Central Europe | Medium term (2–4 years) |
| Acute warehouse-labor shortages and wage inflation | +1.9% | Western and Eastern Europe | Medium term (2–4 years) |
| EU cross-border trade expansion | +2.1% | EU-wide | Long term (≥ 4 years) |
| Stricter cold-chain regulations | +1.2% | Northern and Mediterranean Europe | Long term (≥ 4 years) |
| Edge-AI orchestration and energy savings | +1.7% | Germany, Netherlands, Nordics | Long term (≥ 4 years) |
| Source: Mordor Intelligence | |||
Exponential growth in e-commerce order volumes
Seven markets will account for 70% of continental e-commerce by 2025, yet Romania and Hungary already post around 15% annual growth. DHL eCommerce Poland notes that success hinges on advanced route optimization, live parcel tracking, and seamless returns that manual setups cannot match. Operators are therefore dispersing inventory into numerous regional hubs so orders can cross one or two borders instead of four. Sophisticated order-orchestration engines decide in milliseconds which node should fulfill a basket based on duty costs, transit time, and stock freshness. Automation platforms win deals when they offer the same user interface and spare parts lists in every country, simplifying multi-site roll-outs.
Rapid Industry 4.0 adoption across manufacturing
Germany’s robot density of 429 units per 10,000 employees underscores leadership in factory automation, yet studies from MHP and Ludwig-Maximilian University flag that the wider DACH region trails China and the U.S. in Industry 4.0 maturity. Manufacturers now extend digitization to adjoining warehouses so production, kitting, and dispatch flow in one synchronized loop. MULTIVAC’s EUR 100 million (USD 110 million) expansion in Wolfertschwenden couples automated logistics with flexible production cells to guard uptime. Fraunhofer IML’s EUR 18 million (USD 19.8 million) Digital Testbed Air Cargo shows public-private labs filling R&D gaps. Brownfield retrofits dominate spending since most operators prefer installing shuttle aisles and AMR lanes in existing facilities instead of building new shells.
Acute warehouse-labor shortages and wage inflation
Aging demographics, stricter immigration rules, and rising minimum wages have pushed several operators to demand three-month payback periods on automation bids. Goods-to-person AMR stations raise pick rates two- to three-fold while reducing walking distance to under 100 meters per shift. AG Logistics in the Netherlands combined Körber layer pickers with legacy conveyors and kept headcount flat despite double-digit growth, highlighting technology’s role in employee retention. Tilburg-based Fabory moved to an almost lights-out model where two staff members per shift supervise a STILL fleet and see order-to-ship cycles shrink from one day to under three hours. Upskilling programs now focus on PLC diagnostics, cobot troubleshooting, and data-driven decision making rather than manual picking.
EU cross-border trade expansion
Cross-border sales inside the bloc now grow twice as fast as domestic e-commerce, with 32% of shoppers buying from a different member state in 2025. Temu’s decision to fulfill 80% of European orders via six in-country warehouses by December 2024 proves how proximity cuts delivery lead times from weeks to mere days.[2] Spanish micro-fulfillment centers show that robotic shuttle systems paired with AI demand forecasting can triple order density in tight urban footprints. Peak-season elasticity is another reason operators embrace scalable AMR fleets that can be rented for two-month bursts and sent back afterward. DHL’s capital program of EUR 3.066 billion (USD 3.373 billion) for 7,500 cobots and 51,000 wearables underlines the up-front cash required to meet next-day delivery pledges.
Restraints Impact Analysis of Europe Warehouse Automation Market*
| Restraint | (~) % Impact on CAGR Forecast | Geographic Relevance | Impact Timeline |
|---|---|---|---|
| High upfront CAPEX requirements | −1.4% | Southern and Eastern Europe | Short term (≤ 2 years) |
| Cyber-security and data-sovereignty concerns | −1.2% | EU-wide | Medium term (2–4 years) |
| Scarcity of integration talent and long lead-times | −1.6% | High-automation regions | Medium term (2–4 years) |
| Legacy-system interoperability gaps | −0.9% | Mature industrial zones | Long term (≥ 4 years) |
| Source: Mordor Intelligence | |||
High upfront CAPEX requirements
A person-to-goods system often starts at USD 1 million per site, keeping many SMEs on the sidelines. Robotics-as-a-Service models now cut the entry ticket to roughly USD 100,000 by converting CAPEX into monthly fees, yet banks still demand collateral or parent guarantees. TGW advises involving finance teams from day one so internal rate-of-return metrics shape the scope. DLL’s pre-financing packages that bundle robots, software, and integration costs show lenders tailoring products to intralogistics. Finally, pocket sorters like TGW SmartPocket can go live in six months, reducing construction spend and interest costs compared with conventional sorters.
Cyber-security and data-sovereignty concerns
The EU AI Act and High-Performance Computing regulation oblige vendors to document algorithmic risks, pushing some operators to keep orchestration on-premises rather than in a U.S. cloud.[3] Time-Sensitive Networking standards harden industrial Ethernet but also raise certification costs. Germany and France, mindful of data protection, often ask for split-tunnel designs where sensitive order data never leaves national soil. Attack-surface growth is evident as every sensor, AMR, and wearable connects to Wi-Fi 6 or private 5G. As a result, security audits now add two to three months to typical project timelines and can delay green-button sign-off until all penetration tests pass.
*Our forecasts treat driver/restraint impacts as directional, not additive. The impact forecasts reflect baseline growth, mix effects, and variable interactions.
Europe Warehouse Automation Market Segment Analysis
By Component:
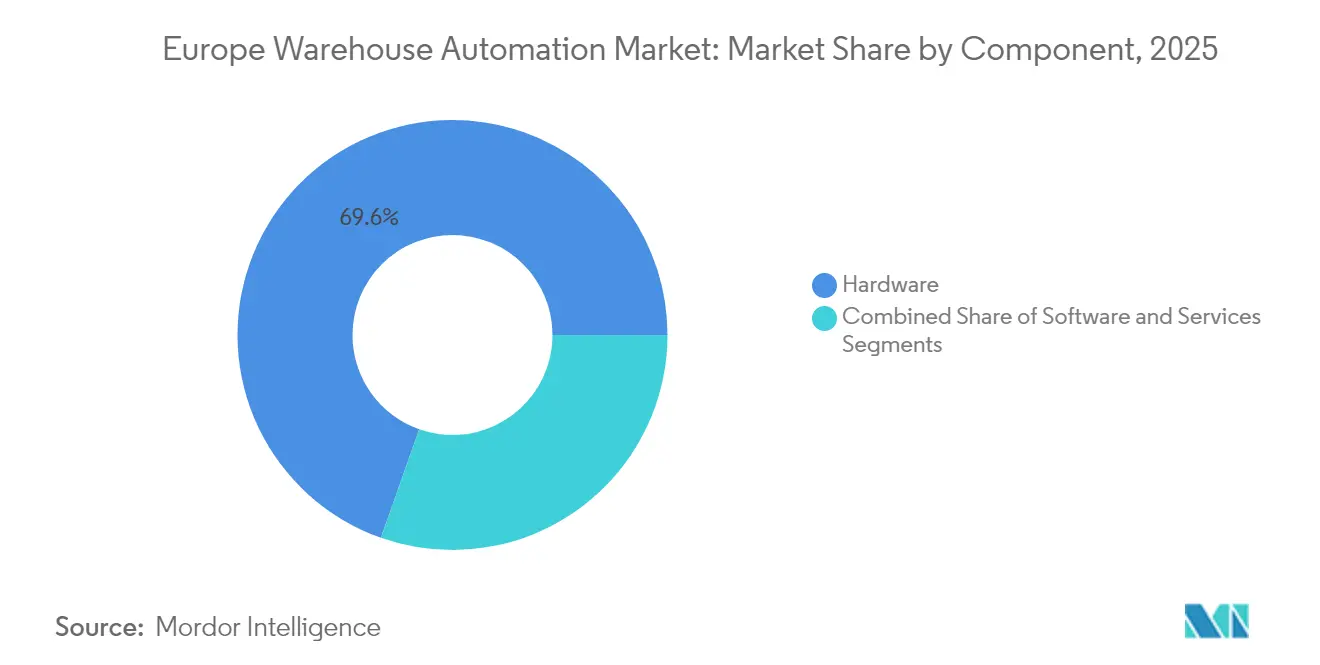
Hardware Dominance Faces Software DisruptionHardware accounted for 69.60% of the European warehouse automation market size in 2025, anchored by AS/RS aisles, conveyors, and AMR fleets. Cube-based storage such as AutoStore achieves four-fold inventory density while trimming kilowatt hours per pick, explaining its rapid uptake in high-rent urban hubs. Services revenue grows steadily as full-service contracts guarantee uptime and predictive-maintenance analytics signal part replacements weeks in advance. TGW’s 20-year lifetime-service deal with Betty Barclay illustrates how integrators lock in annuity streams beyond initial installs.
Meanwhile, software recorded the fastest 18.6% CAGR and is starting to eat into hardware budgets by extracting more cycles from existing machines using AI orchestration engines. Warehouse execution systems now tap edge GPUs to orchestrate hundreds of bots in microseconds, proving that value is tilting toward code as much as steel.

By End-User Industry:
E-commerce Leads While Manufacturing AcceleratesE-commerce and groceries held a 32.45% revenue share in 2025 as next-day delivery became the norm in Germany, France, and the UK. Dark stores and ambient-to-frozen shuttle lanes enable grocers to batch-pick mixed-temperature baskets without manual handling.
Manufacturing, however, is projected to grow at a 19.15% CAGR, with Europe warehouse automation market share gains driven by brownfield retrofits that mesh shop-floor MES with warehouse management systems. Automotive and white-goods plants now sequence kitting totes straight to assembly positions, eliminating buffer stock and shrinking lead times. Food-and-beverage operators deploy pallet shuttles inside −25 °C zones to comply with EU cold-chain rules, while pharma players such as B. Braun integrate GxP-compliant robotics to minimize contamination risk.
By Technology Type:
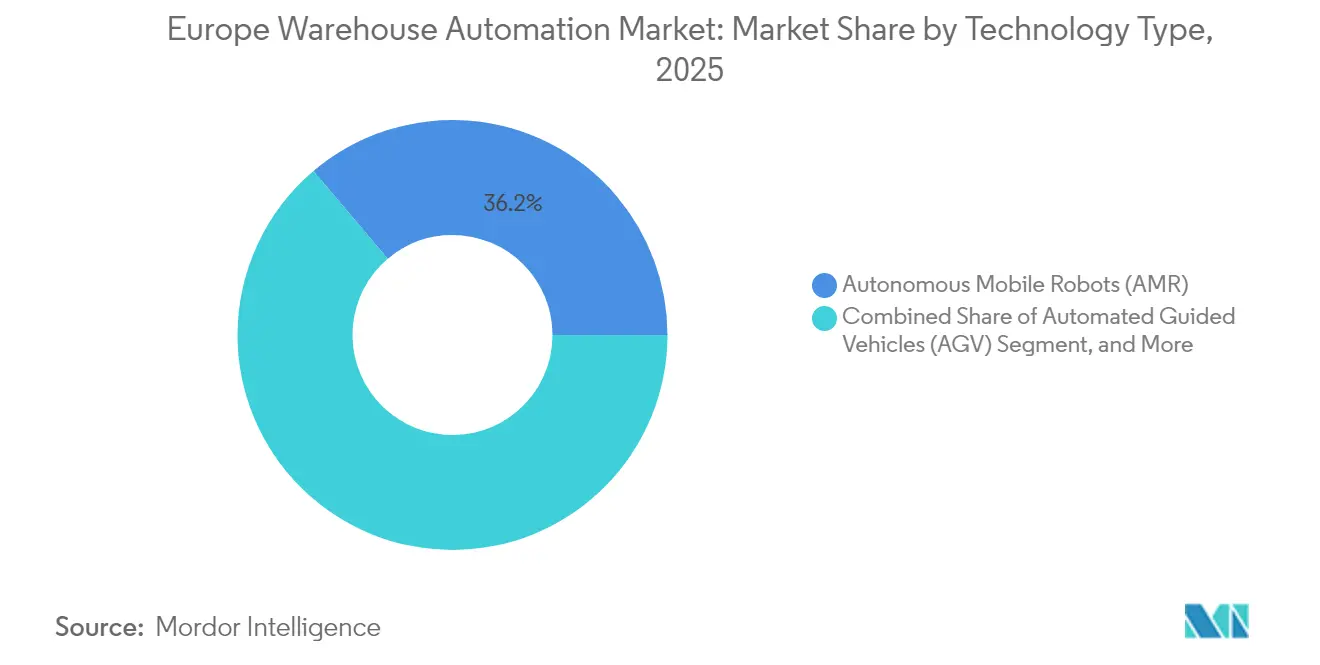
AMR Leadership Challenged by AGV ResurgenceAMR systems captured 36.20% of the European warehouse automation market share in 2025, due to flexible navigation and quick redeployment. Continuous price erosion plus open-source mapping libraries have lowered unit costs by almost 15% since 2022, making AMRs viable for seasonal peaks.
Paradoxically, AGVs are forecast to clock a 19.1% CAGR because standardized, low-spec laser guidance appeals to mid-size warehouses with straight-line routes. Shuttle-based AS/RS excels where high throughput trumps density, whereas cube-based grids rule in fashion and cosmetics, where SKU breadth is king. AI-enabled palletizing robots now manage mixed cartons at 700 cycles per hour, matching human versatility with better ergonomics. Finally, warehouse software suites post the fastest growth as WMS, WES, and WCS layers merge into one unified decision stack hosted at the edge for latency reasons.
By Warehouse Size:
Large-Scale Dominance Meets Small-Scale InnovationFacilities above 40,000 m² contributed 51.05% to the European warehouse automation market size in 2025 because multi-client 3PL hubs and plant-attached distribution centers still attract nine-figure budgets.
Yet sub-10,000 m² sites will expand at an 18.55% CAGR after Robotics-as-a-Service and plug-and-play systems erase hefty pit-deepenings and mezzanine works. TGW SmartPocket and Ocado Porter illustrate modularity: operators add pockets or bots when SKU counts rise, safeguarding cash. Mid-scale buildings between 10,000–40,000 m² remain the battleground where integrators pitch either high-density cube grids or hybrid AMR-plus-conveyor flows, depending on product mix.
Geography Analysis
Germany Warehouse Automation Market
Germany delivered 29.35% of the total 2025 revenue and remains the cornerstone of European warehouse automation market expansion. Anchor projects such as Betty Barclay’s Nußloch center with 120,000 storage slots illustrate the appetite for turnkey solutions that fuse fashion, e-commerce, and retail replenishment. Research spending is robust, evidenced by Fraunhofer IML’s Digital Testbed Air Cargo, a EUR 18 million sandbox for AI-enabled material flow. That said, locally hosted orchestration software is often mandatory because German clients rank data sovereignty alongside uptime.
Spain Warehouse Automation Market
Spain is racing ahead at a 19.3% CAGR, propelled by urban micro-fulfillment and its gateway role to North Africa. Barcelona and Madrid now house several cube-based AS/RS sites under 5,000 m², where robots and shuttle lifts compress order-to-ship cycles below 90 minutes. Genebre’s automated hub and B. Braun’s new plant are emblematic of diversified end-user demand. The warm climate plus EU Regulation 2019/138 further boost cold-chain investments, pushing operators to adopt energy-efficient variable-speed drives and insulated shuttle lanes.
Broader European Markets
The UK, France, Italy, and the Netherlands round out the top tier. Britain keeps investing despite Brexit complexities; Matalan’s KNAPP facility in Knowsley offers a scalable template that can flex from 200,000 to 400,000 picks per day without adding square footage. France benefits from central-location hubs like Poupry, where C-LOG processes 3.5 million online orders annually with next-evening delivery cut-off at 7 PM. Italy shows that diverse sectors from AgriEuro e-commerce to ABB’s component plant favor modular cubes for B2C peaks, yet stick with traditional conveyors for pallet outbound. The Netherlands, meanwhile, leverages Rotterdam and Schiphol logistics gateways; AG Logistics’ Körber layer pickers illustrate how local 3PLs mix legacy racking with new robotics for phased modernizations.
Regulatory Landscape
Warehouse automation deployments in Europe sit at the intersection of EU product-safety and AI governance rules, which is why integrators increasingly package compliance documentation alongside equipment and software. The EU Machinery Regulation (EU) 2023/1230, which explicitly captures autonomous robots and safety-critical software, sets mandatory compliance from 20 January 2027 and tightens requirements around digital instructions, conformity assessment (including for certain safety functions using machine learning), and the handling of substantial modifications during retrofits.
Alongside this, the EU AI Act (Regulation (EU) 2024/1689) introduces tiered obligations for AI systems and imposes AI literacy duties on deployers from 2 February 2025. That affects warehouse operators using AI-enabled orchestration, vision, or decision-support tools. For AI systems embedded in regulated products such as machinery, the high-risk requirements apply from 2 August 2028, creating a dual-compliance planning track for vendors selling AMR/AGV and AS/RS systems with embedded AI. On 6 May 2026, EU institutions reached a provisional agreement on a Digital Omnibus on AI intended to streamline overlaps between the AI Act and sector product-safety frameworks, a development that vendors are tracking when defining certification and technical-file strategies for Europe-wide rollouts.
Value Chain Analysis
The European warehouse automation value chain runs across component suppliers (drives, sensors, safety hardware, controllers), OEMs for robots and storage systems (AMR/AGV, shuttle and cube-based AS/RS, conveyors and sorters), software vendors (WMS/WES/WCS, simulation and digital-twin tools), and systems integrators that engineer, install, and maintain end-to-end sites. Integration and lifecycle services are also where monetization concentrates, particularly in brownfield-heavy deployments, since phased cutovers, interoperability work with legacy conveyors and host systems, and long-term spares and uptime commitments extend engagement beyond the initial install.
Recent ecosystem moves also point to tighter coupling between software and equipment and a stronger focus on industrializing autonomous intralogistics. In April 2026, Siemens and KION announced a strategic partnership centered on AI, simulation, and digital twins, with KION adopting Siemens Digital Twin Composer. In July 2026, Colruyt Group and KION launched an R&D center in Antwerp to advance next-generation supply chain robotics, including self-driving pallet truck technology. Across Europe, execution risk and timelines increasingly hinge on non-equipment constraints, including grid-capacity availability in logistics hubs, permitting lead times (cited as 18 to 24 months in parts of Flanders), and shortages of electromechanical maintenance and WMS configuration talent, which raises the value of partners able to support commissioning, training, and ongoing managed services.
Competitive Landscape
The European warehouse automation market remains moderately fragmented. Swisslog, SSI Schaefer, TGW Logistics, and Dematic keep leveraging global portfolios and in-house software stacks, but innovators like AutoStore, Ocado, and Exotec continue nibbling market share with niche-specific architectures. Partnerships rather than pure acquisitions dominate because speed to market outranks vertical integration; witness FORTNA aligning with AutoStore, Rockwell, and Hai Robotics to bundle cube grids, PLCs, and AMRs into one throat to choke.
Consolidation is accelerating nonetheless. Vanderlande’s EUR 300 million purchase of Siemens Logistics added fast-parcel sorters to its airport baggage roots, while Element Logic’s ABCO buyout expands North American reach. Suppliers now differentiate on algorithmic prowess: Arvato’s Moonshot WMS with Microsoft embeds AI to predict pick-density spikes hours ahead, trimming labor by double digits. Compliance readiness also matters; firms that can deliver EU AI Act documentation win tenders against technically similar rivals. White-space opportunity persists in small-site Robotics-as-a-Service where monthly fees align with cash-strapped SMEs.
Three strategic themes dominate boardrooms: 1) Edge computing that slashes cloud latency yet respects data-locality laws; 2) Energy-savvy drives and regenerative braking to cut emissions; 3) Lifecycle services baked into contracts so uptime, spares, and software updates sit under one SLA. As a result, top-tier integrators bundle financing, compliance, and after-sales into proposals, making it harder for pure-play robot start-ups to compete unless they partner.
Europe Warehouse Automation Industry Leaders
-
Swisslog Holding AG (KUKA AG)
-
SSI Schaefer AG
-
TGW Logistics Group GmbH
-
KNAPP AG
-
Vanderlande Industries B.V.
- *Disclaimer: Major Players sorted in no particular order
Europe Warehouse Automation Market Companies Covered in this Report
- Swisslog Holding AG (KUKA AG)
- SSI Schaefer AG
- TGW Logistics Group GmbH
- KNAPP AG
- Vanderlande Industries B.V.
- Dematic GmbH (KION Group AG)
- WITRON Logistik + Informatik GmbH
- AutoStore Holdings Ltd.
- Ocado Group plc
- Exotec SAS
- Mecalux S.A.
- Körber Supply Chain GmbH
- Geekplus Technology Co. Ltd.
- Locus Robotics Inc.
- GreyOrange Pte. Ltd.
- Jungheinrich AG
- Honeywell Intelligrated
- Bastian Solutions LLC
- BEUMER Group GmbH and Co. KG
- Kardex Holding AG
- HAI Robotics Co. Ltd.
- Cimcorp Oy
Market Opportunities and Future Outlook
Multi-site standardization programs by large retailers and shippers create an opportunity for vendors that can repeat a proven reference design across countries while still meeting local expectations on data handling, safety documentation, and commissioning support. In March 2026, Decathlon disclosed a multi-site automation program (Skyfleet) spanning seven warehouse sites across France, the United Kingdom, Portugal, Italy, and Germany using Exotec Skypod systems, reinforcing demand for repeatable architectures and harmonized software layers across distributed networks. In March 2026, LPP Logistics reported that it expanded its autonomous robotic fleet from 555 units to over 3,500 units across fulfillment centers in Poland and Romania, illustrating scaling needs in Central and Eastern Europe where labor dynamics and e-commerce growth support faster adoption of mobile robotics and orchestration software.
A second opportunity area is modernization of large fulfillment estates, with the software and services layered above hardware, especially fleet management, simulation, and system health analytics designed to reduce downtime and energy intensity. In June 2026, Amazon announced a EUR 10 billion investment to modernize European fulfillment centers with next-generation robotics and create 25,000 jobs, underscoring continued enterprise budgets around robotics-enabled throughput gains, and the integration, safety validation, and operational tooling that follow. On the development side, the July 2026 launch of the KION Automation Center Antwerp with Colruyt Group points to growing appetite for co-development and commercialization pipelines for autonomous vehicle technologies, which can draw through demand for compliant safety stacks, testing, and lifecycle support across EMEA deployments.
Recent Industry Developments in Europe Warehouse Automation Market
- July 2026: KION Group and Colruyt Group agreed on a strategic partnership in which KION acquired 70% of Colruyt's autonomous pallet truck R&D activities to accelerate commercialization. The deal strengthens KION's access to specialized autonomy know-how and creates a clearer route from pilot technology to standardized products for EMEA warehouse operations.
- March 2025: Ocado Intelligent Automation unveiled the Porter AMR designed for 1.5-ton pallets. The introduction broadened Ocado's robotics addressable scope beyond grocery-style workflows and supported heavier-duty intralogistics use cases common in European 3PL and manufacturing warehouses.
- December 2024: Temu activated six European warehouses to fulfill 80% of continental orders locally. Localizing inventory reduced cross-border delivery times and pressured fulfillment networks to add automation that can absorb higher parcel volumes and faster cut-off times.
Europe Warehouse Automation Market Report Scope and Research Methodology
Market Definition and Coverage
In this study, the Europe warehouse automation market is defined as revenues earned from automation hardware, software, and related services that are deployed inside warehouses and distribution centers to store, move, pick, sort, and manage goods.
Scope exclusions: We exclude last mile delivery automation that operates outside the warehouse, such as curbside delivery fleets and parcel door-to-door services.
Segments Covered in This Report
- By Component
- Hardware
- Mobile Robots (AGV, AMR)
- Automated Storage and Retrieval Systems (AS/RS)
- Conveyors and Sortation Systems
- Palletizing and Depalletizing Systems
- Automatic ID and Data Capture (AIDC)
- Piece-Picking Robots
- Software
- Warehouse Management Systems (WMS)
- Warehouse Execution Systems (WES)
- Services
- Hardware
- By End-User Industry
- Food and Beverage
- Post and Parcel
- E-commerce and Groceries
- General Merchandise and 3PL
- Apparel and Footwear
- Manufacturing (Durable/Non-Durable)
- Other End-User Industries
- By Technology Type
- Autonomous Mobile Robots (AMR)
- Automated Guided Vehicles (AGV)
- Cube-Based AS/RS (e.g., AutoStore)
- Shuttle-Based AS/RS
- Mixed-Case Palletizing Robotics
- Warehouse Software Suites (WMS/WES/WCS)
- By Warehouse Size
- Small-Scale (<10,000 m²)
- Mid-Scale (10,000–40,000 m²)
- Large-Scale (>40,000 m²)
- By Country
- Germany
- United Kingdom
- France
- Italy
- Spain
- Netherlands
- Rest of Europe
Data Sources, Market Sizing, and Validation
Desk Research
Desk research was used to set the market boundary, build the country view, and create starting assumptions on adoption and pricing. We relied on public sources such as Eurostat for logistics and labor indicators, the European Commission for policy and safety related signals, and national statistical offices for industrial output and warehousing activity trends. For trade and supply cues, we also referenced UN Comtrade and customs level summaries where available, because some automation equipment categories show up through import patterns.
To link demand with real buying cycles, we reviewed company annual reports, investor presentations, and press releases that describe warehouse expansions, automation rollouts, and service backlogs. We also scanned patents and standards references using a paid patent database to understand which automation functions are getting practical traction across Europe. A paid company financials and intelligence subscription helped us cross-check business line exposure when public segment reporting was limited. These desk sources are illustrative only, and many other public materials were reviewed to collect data, validate assumptions, and clarify gaps.
Primary Interviews and Surveys
Primary work was done through expert interviews and structured surveys with system integrators, automation solution providers, component suppliers, and warehouse operators across retail, e-commerce, manufacturing, and 3PL settings. We used these discussions to confirm typical project sizes, replacement cycles, service attachment rates, and how software and controls are bundled, then rechecked any large variances at the country level with follow-up calls.
Distribution of primary research fieldwork respondents
| Company type | Respondent position |
|---|---|
| Top tier: 32% | CXOs: 20% |
| Mid tier: 47% | Functional/Unit leaders: 24% |
| Smaller Players: 21% | Managers: 56% |
Market-Sizing & Forecasting
Our sizing starts from a top-down build where the demand pool is reconstructed by linking warehouse activity and investment cycles to automation adoption across key European countries, then it is allocated into equipment, software, and services. The totals were corroborated with selective bottom-up approximations, such as sampled project values shared by integrators, country-level channel checks, and a simple ASP times volume sense-check for common systems.
A few inputs carried most of the weight in the model, including new warehouse and fulfillment space additions, labor cost pressure and vacancy trends, e-commerce and retail fulfillment throughput growth, the share of greenfield sites versus retrofits, and typical automation penetration by warehouse size. We also tracked how software and service revenues attach to hardware, since this can change the headline value even when unit installations are steady. Where bottom-up visibility was weaker for smaller countries or niche technologies, gaps were handled using peer-country ratios and confirmed with experts who cover multi-country projects.
For the forecast, scenario analysis was used with a base case that reflects what interviewees expect on capex timing, commissioning lead times, and pricing direction. The scenario outputs were checked against known order backlog commentary and the pace of announced distribution center upgrades before finalizing the curve through 2031.
Data Validation & Update Cycle
We validate outputs by triangulating the market model against independent signals, including automation project announcements, reported backlog direction, and visible shifts in warehouse investment activity. When a country or component line shows an unusual jump, the assumptions are reopened and the driver is traced back to inputs like penetration, ASP, or service attachment before it is accepted. A second analyst review is done to check that arithmetic, currency handling, and year mapping are consistent across the workbook.
The report is refreshed annually, and interim updates are made when material events occur that can move demand, such as sharp shifts in labor availability, policy changes that affect warehouse operations, or major changes in automation lead times. Before delivery, the model is given a fresh pass so the numbers reflect the most recent information available at that time.
Mordor Intelligence's Europe Warehouse Automation Market Size Compared Against Other Published Estimates
Published market sizes for Europe warehouse automation can look far apart because different studies draw the line in different places, and they also handle services, software bundling, and country coverage in their own ways. Differences also come from how fast pricing is assumed to move, and whether the forecast reflects a base case demand path or a more aggressive capex cycle.
Last mile delivery automation sits outside Mordor Intelligence's scope here, so the value is anchored to warehouse and distribution center systems like AS/RS, mobile robots, conveyors and sorters, control software, and related services. Some published figures also widen the market by combining warehouse automation with broader intralogistics or end-to-end logistics automation, which can pull in port, airport, or transport automation lines. Variance is further created when software is counted at full enterprise license value instead of warehouse-use allocations, and when currency conversion uses different average-year rates for multi-country Europe totals.
Benchmark comparison
| Source | Market Size | Gaps in Research Methodology |
|---|---|---|
| Mordor Intelligence | USD 5.76 B (2025) | |
| Global Consultancy A | USD 17.03 B (2023) | Uses a broader logistics automation framing for Europe, which can include automation beyond warehouses, and it also applies an earlier base year that is not directly comparable to a 2025 warehouse-only definition. |
| Regional Consultancy B | USD 31.10 B (2035) | Extends the forecast horizon and tends to bundle multiple automation technologies across a wider solution set, which can amplify the long-range total through higher assumed penetration and longer-term pricing uplift. |
The comparison shows that scope and timing explain most of the spread, especially when warehouse-only systems are mixed with wider logistics automation and when end-year forecasts are compared to a base-year view. By keeping inputs traceable to warehouse investment activity, adoption by facility type, and realistic software and service attachment, the model stays repeatable and easier to audit across European countries.
Key Questions Answered in the Report
How large is the Europe warehouse automation market in 2026?
The market reached USD 6.79 billion in 2026 and is forecast to climb to USD 15.43 billion by 2031 on an 17.86% CAGR.
Which component category is growing fastest?
Software, particularly warehouse execution systems and AI orchestration layers, is projected to record a 18.6% CAGR through 2031.
Which European country shows the highest growth momentum?
Spain is set to expand at a 19.3% CAGR thanks to urban micro-fulfillment and its role as a southern European logistics hub.
What technology type currently holds the largest share?
Autonomous mobile robots account for 36.20% of 2025 revenue, though automated guided vehicles are expanding faster.
How are small warehouses affording automation?
Robotics-as-a-Service and modular plug-and-play systems reduce upfront costs to roughly USD 100,000, making advanced solutions accessible to SMEs.
What is the main restraint hindering wider adoption?
High upfront CAPEX remains the biggest hurdle, especially in SME-heavy regions, although leasing and RaaS models are easing entry barriers.