
Market Overview
| Study Period | 2019 - 2031 |
|---|---|
| Forecast Data Period | 2026 - 2031 |
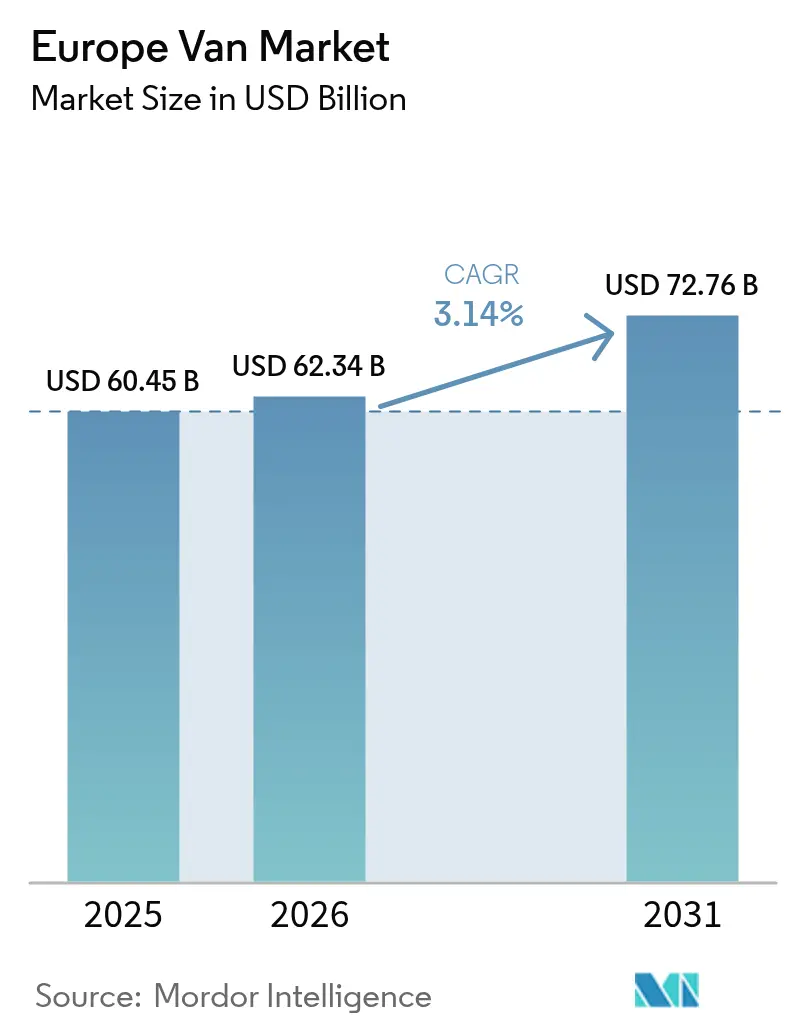
| Base Year Market Size (2025) | USD 60.45 Billion |
| Market Size (2026) | USD 62.34 Billion |
| Market Size (2031) | USD 72.76 Billion |
| Growth Rate (2026 - 2031) | 3.14 % |
| Market Concentration | Medium |
Major Players *Disclaimer: Major Players sorted in no particular order Image © Mordor Intelligence. Reuse requires attribution under CC BY 4.0. | |
Europe Van Market Analysis by Mordor Intelligence
The European van market size is projected to be USD 60.45 billion in 2025, USD 62.34 billion in 2026, and reach USD 72.76 billion by 2031, growing at a CAGR of 3.14% from 2026 to 2031. In 2025, diesel models continued to dominate the market. However, battery-electric vans are growing steadily and reshaping fleet economics, driven by factors such as subsidies, payload-parity designs, and clean-zone regulations. Germany's demand was supported by its dense logistics networks and strong manufacturing base, while Norway experienced the fastest growth due to tax exemptions that significantly boosted BEV adoption. Commercial fleets remained the primary buyers, but rental and leasing operators increasingly adopted asset-light strategies to address the higher price of BEVs. Despite this growth, challenges such as semiconductor shortages, a lack of drivers, and gaps in charging infrastructure continue to influence OEM sourcing, route planning, and ownership models.
Key Report Takeaways
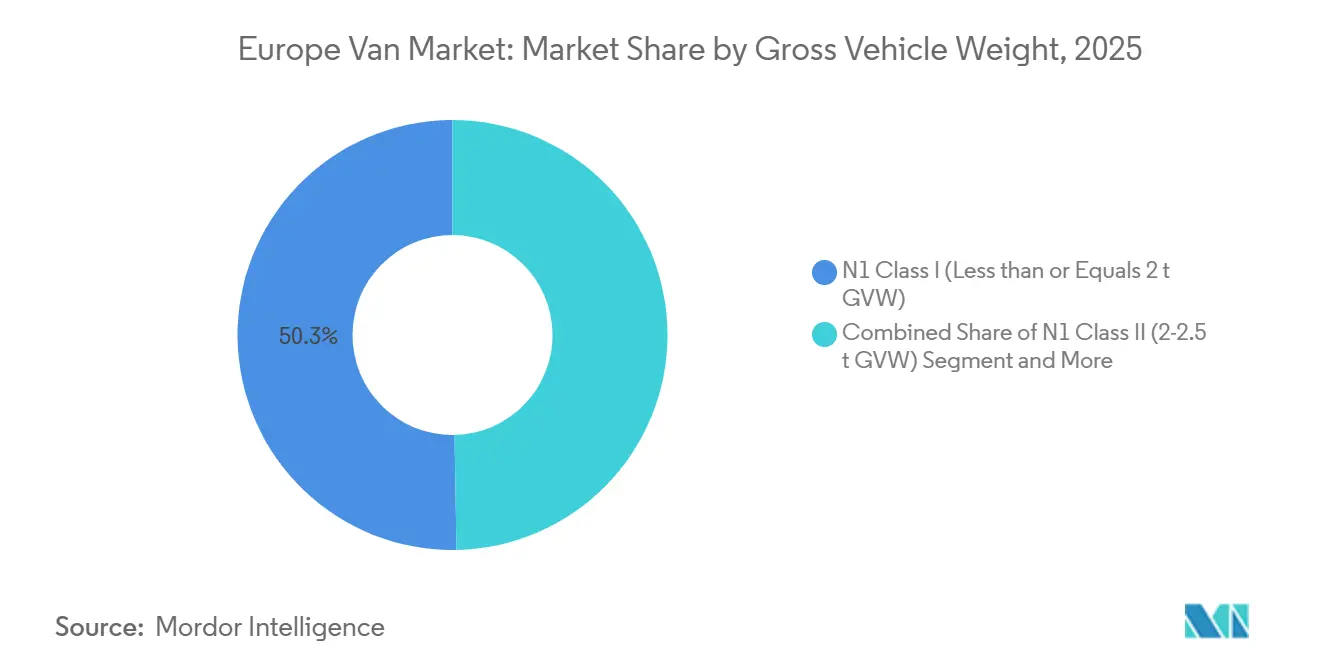
- By gross vehicle weight, N1 Class I vans captured 50.33% of Europe Van market share in 2025 while growing at a 3.85% CAGR to 2031.
- By cargo space, vans above 5 m³ held 64.11% share in 2025, whereas compact formats (≤5 m³) are advancing at a 5.01% CAGR.
- By end user, commercial fleets led with 73.25% revenue share in 2025, but rental and leasing operators are forecast to expand at 5.65% CAGR through 2031.
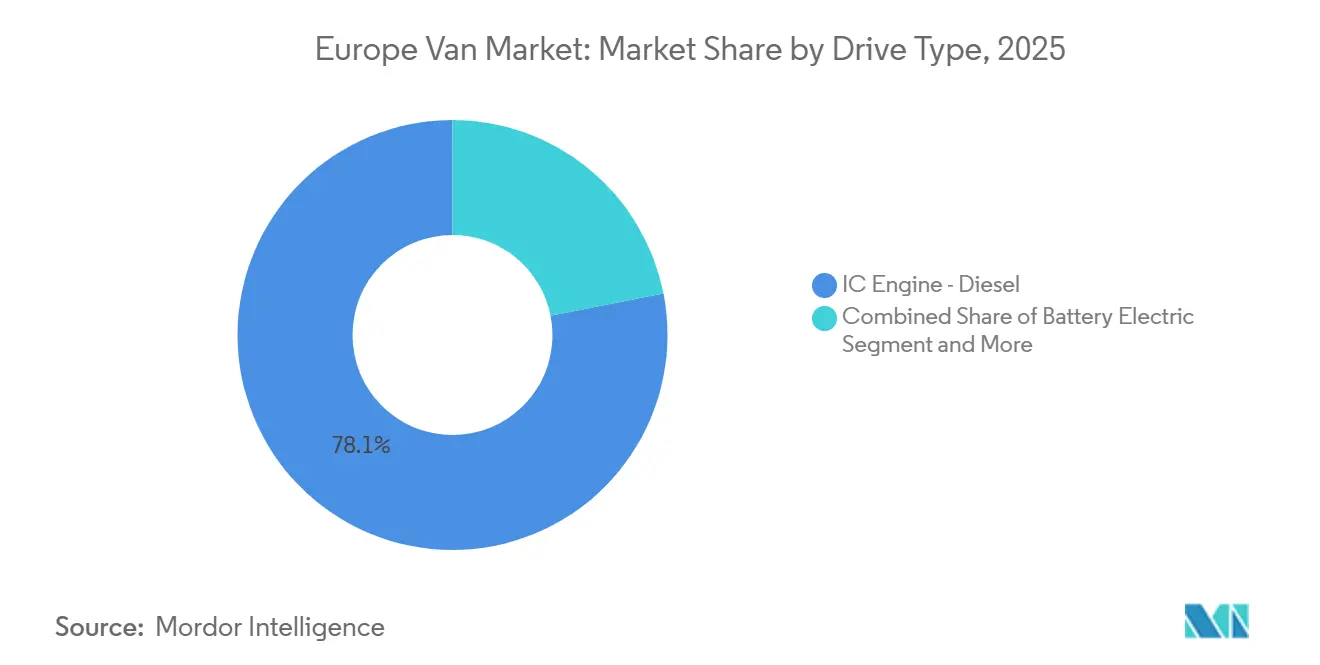
- By drive type, diesel retained 78.10% share in 2025, yet battery-electric vans record the highest projected CAGR at 8.11% across 2026-2031.
- By sales channel, direct OEM fleet sales accounted for 66.12% volume in 2025, while online and digital platforms registered the quickest growth at 6.12% CAGR.
- By geography, Germany contributed 29.13% of revenue in 2025; Norway represents the fastest-growing national market at a 4.53% CAGR.
Note: Market size and forecast figures in this report are generated using Mordor Intelligence’s proprietary estimation framework, updated with the latest available data and insights as of 2026.
Market Trends and Insights
Drivers Impact Analysis of Europe Van Market*
| Driver | (~) % Impact on CAGR Forecast | Geographic Relevance | Impact Timeline |
|---|---|---|---|
| Rising Sales of Electric Vans | +0.9% | Germany, France, Netherlands, Norway; spillover to the United Kingdom and Spain | Medium term (2-4 years) |
| E-Commerce Last-Mile Boom | +0.7% | Urban centers across Germany, the United Kingdom, France, Italy, and Spain | Short term (≤2 years) |
| Low-Emission-Zone Mandates | +0.6% | Germany, Netherlands, France, Italy, Spain; Norway leading | Long term (≥4 years) |
| OEM Skateboard EV Platforms | +0.4% | Pan-European; manufacturing hubs in France, Germany, Spain | Long term (≥4 years) |
| Micro-Fulfilment Hub Adoption | +0.3% | Germany, the United Kingdom, France, Netherlands | Medium term (2-4 years) |
| Battery-as-a-Service Models | +0.2% | France, Netherlands, Germany; early pilots in the United Kingdom and Scandinavia | Medium term (2-4 years) |
| Source: Mordor Intelligence | |||
Rise in Sales of Electric Vans
Battery-electric vans accounted for 5.9% of new registrations in 2024 after subsidy cuts, but rebounded to 9.5% during H1 2025 as corporate fleet mandates intensified [1]. The Clean Vehicles Directive mandates that public entities procure only zero-emission vans starting in 2026, ensuring consistent demand. Between 2024 and 2026, OEMs introduced new BEV models, offering a wider range of payload options. In the United Kingdom, total-cost-of-ownership parity is achieved when vehicles meet certain mileage thresholds, a target many fleets reach within a short period. This shift in procurement preferences favors zero-emission vehicles over diesel, despite existing charger limitations.
E-commerce Last-Mile Boom
By 2030, parcel volumes in Western Europe are expected to grow significantly. This growth is prompting fleets to increasingly opt for smaller vans, enabling them to navigate tight urban spaces and complete more delivery loops daily. The number of automated parcel machines has increased by 2024, highlighting a trend towards frequent, low-payload deliveries. Operators like Otto Group have reported achieving greater delivery efficiency using compact BEV vans compared to their diesel counterparts[2]. Quick-commerce companies are strategically positioning micro-fulfilment hubs close to their consumers, driving up the demand for vans with smaller cargo volumes. With delivery frequency taking precedence over payload capacity, OEMs are now focusing on enhancing thermal management and fast-charging capabilities, rather than merely expanding cubic space.
EU Low-Emission-Zone Mandates
Regulation (EU) 2019/631 mandates an emission reduction by 2025. While the regulation initially aimed for a complete transition to zero-emission sales by 2035, a proposal in December 2025 moderated this target, citing employment concerns. Despite these adjustments, cities are forging ahead with their own initiatives. By 2030, Amsterdam and Rotterdam plan to exclude non-zero-emission vans from their central zones [3]. Meanwhile, Milan has already implemented weekday restrictions on Euro 5 diesels. These fragmented municipal regulations are complicating cross-border logistics, leading to heightened compliance costs for fleets operating across Europe. In the United Kingdom, the ZEV mandate fell short of its target in 2024, resulting in penalties that are set to inflate list prices in 2026. Such divergences in regulations are exerting strategic pressure on OEMs regarding allocation and fleet planning.
OEM Skateboard EV Platforms
Stellantis, Volkswagen, and Mercedes-Benz have adopted a flat-floor "skateboard" chassis design. This design integrates batteries, motors, and suspension into a single under-floor module. This approach has led to a notable reduction in development costs compared to traditional bespoke architectures. Due to this modular strategy, Stellantis's Hordain plant can seamlessly switch between producing diesel and electric vans on the same assembly line in under an hour. This agility offers OEMs significant production flexibility amidst the ongoing powertrain transition. Volkswagen, leveraging its MEB passenger-car platform, successfully adapted it for the ID. Buzz Cargo. This adaptation demonstrates that with wheelbase extensions and reinforced floors, a substantial payload is achievable without starting from scratch. Meanwhile, Mercedes-Benz's EVA2 architecture is versatile enough to accommodate battery packs of varying capacities within a single structural framework. This flexibility allows fleet buyers to tailor the vehicle's range to specific routes, all while maintaining optimal interior space.
Restraints Impact Analysis of Europe Van Market*
| Restraint | (~) % Impact on CAGR Forecast | Geographic Relevance | Impact Timeline |
|---|---|---|---|
| Battery and Vehicle CAPEX | -0.5% | Pan-European; acute in Spain, Italy, Eastern Europe | Short term (≤2 years) |
| Limited Depot Fast-Charging | -0.4% | United Kingdom, Germany, France, Italy; rural and peri-urban fleet operators | Medium term (2-4 years) |
| Semiconductor Supply Constraints | -0.3% | Germany, France, Spain manufacturing hubs | Short term (≤2 years) |
| Driver Shortage and License Rules | -0.2% | Germany, the United Kingdom, France, Poland; logistics-intensive regions | Long term (≥4 years) |
| Source: Mordor Intelligence | |||
High Battery and Vehicle CAPEX
In the United Kingdom, battery-electric vans remain significantly costlier than their diesel counterparts. High-mileage users can expect total-cost parity within a few years, but smaller fleets may take longer, hindering quicker adoption. While battery pack prices declined in recent years, stabilization of commodities has slowed further reductions. A decline in BEV van registrations in 2024, following Germany's subsidy withdrawal, underscores the fragility of such policies. Although leasing eases initial costs, it transfers the residual-value risk to lessors, who then factor this uncertainty into monthly rates.
Limited Depot Fast-Charging Sites
As of 2024, only a small portion of commercial vehicle depots in Europe had fast-charging capabilities. This limitation has compelled most fleets to depend on overnight AC charging, restricting their daily range and hindering multi-shift operations. To meet the European Commission's target of 3.5 million public chargers by 2030, a significant expansion of the current infrastructure is essential, requiring substantial investment that remains largely unfunded. Furthermore, grid connections present a significant challenge for these depots. Operators in the United Kingdom are facing lengthy delays for medium-voltage service upgrades, stalling their fleet electrification efforts, even when vehicles are readily available. While corridor hubs from Gridserve and Shell Recharge facilitate inter-city routes, most van mileage is concentrated on urban last-mile loops, which still lack dependable high-power charging options.
*Our forecasts treat driver/restraint impacts as directional, not additive. The impact forecasts reflect baseline growth, mix effects, and variable interactions.
Europe Van Market Segment Analysis
By Gross Vehicle Weight:
Compact Formats Guide the Urban PivotIn 2025, N1 Class I vans (with a gross vehicle weight of ≤2 tons) commanded a dominant 50.33% market share. These vans are projected to grow at a steady 3.85% CAGR through 2031, underscoring the e-commerce industry's preference for nimble vehicles adept at navigating tight urban spaces. Class II vans are gaining traction as fleets adapt to urban and regional delivery needs. These vans are increasingly used for city tasks or scaled up for broader regional operations. Class III vans, primarily serving construction and utility sectors, face challenges related to battery weight. For instance, a 75 kWh battery pack adds an extra 450 kg, pushing certain BEV models into a higher class and diminishing their usable capacity.
Stellantis has countered this challenge by introducing a composite cargo floor, effectively reducing weight by 60 kg. While licensing regulations permit standard B-category drivers to operate vans weighing up to 3.5 tons, certain states introduce additional testing for heavier BEVs, complicating compliance. Mercedes-Benz offers modular battery sizes, allowing fleets to prioritize either range or payload on a unified chassis. As urban zero-emission zones become more stringent, the European van market is increasingly favoring lighter classes.

By Cargo Space:
Large Still Rules, Compact RisesVans above 5 m³ commanded 64.11% share during 2025 because parcel carriers and tradespeople require cubic space for bulky loads. Growth is muted at a notable CAGR, while compact vans (≤5 m³) grow 5.01% as quick-commerce platforms prioritize trip frequency. The European van market size for compact formats is forecast to advance rapidly on the back of dense urban demand. Renault’s Master E-Tech offers up to 22 m³ with a 130 kWh battery to maintain a 250 km range under load.
At the other extreme, Stellantis’ ë-Berlingo provides 4.4 m³ cargo space and qualifies for resident parking permits in Paris and Milan, lowering operational friction. Modular racking improves asset utilization by allowing fleets to switch between shelving and open cargo bays in minutes, blurring rigid segment lines. Payload trade-offs increasingly favor flexible interiors over sheer volume, prompting OEMs to market configurable decks and tool-less lashing systems.
By End User:
Fleets Prevail, Rentals AccelerateIn 2025, commercial fleets accounted for 73.25% of the demand, driven by scheduled replacement cycles and notable CAGR growth. Municipal buyers, adhering to zero-emission procurement rules set to kick in 2026, captured a notable share. Meanwhile, rental and leasing firms, holding a significant share, experienced the swiftest growth at 5.65%. This surge reflects a rising appetite among small businesses for flexible terms, allowing them to sidestep the residual-value risk associated with BEVs.
In a strategic move, Arval and ALD jointly ordered several electric vans in 2025, clinching discounts that undercut standard dealer rates. Subscription models are evolving, bundling insurance, maintenance, and charging into a single fee, thereby alleviating administrative burdens. Following a 2024 rule adjustment in France, government tenders are now prioritizing total-cost metrics, a trend gaining traction among other member states. However, trade-service fleets are lagging in electrification due to challenges such as rural call-outs and a lack of depot chargers.
By Drive Type:
Diesel Holds, Battery Charges AheadDiesel vans retained 78.10% share in 2025 but are slipping at a negative CAGR as emission penalties escalate. Battery-electric units will rise 8.11% annually through 2031 as model variety improves. Hybrid electric vans are gaining traction among cautious buyers, offering a balanced option between traditional and fully electric vehicles. Fuel-cell vans remain a niche choice due to the limited availability of hydrogen infrastructure. CNG and LPG vans are witnessing a decline as countries like Italy and Spain shift their focus toward electrification.
Amazon's large-scale order of electric vans highlights the growing interest of major fleets in adopting battery-electric vehicles. On the other hand, smaller operators are delaying vehicle replacements, extending the use of diesel vans due to challenges such as charger shortages. By 2026, the European van market is expected to see significant growth in battery-electric vehicles, particularly in regions where stable incentives and depot charging facilities are well-established.
By Sales Channel:
Direct Dominates, Digital ScalesDirect OEM fleet sales held 66.12% volume in 2025 through tailored service contracts, telematics, and volume rebates. Authorized dealers will grow with a steady CAGR by catering to single-van buyers. Online and digital channels will register the highest 6.12% CAGR as configurators compress purchasing friction. In its inaugural year, Stellantis Pro One achieved significant success by seamlessly merging build-to-order services with financing and predictive maintenance.
Mercedes-Benz Vans Online has enhanced transparency for SMEs by offering defined delivery windows. Subscription services from Onto and Elmo are redefining the boundaries between sales and rentals, with Onto demonstrating notable activity in 2025. Dealers are shifting their focus towards after-sales services, including installation and software updates, ensuring they remain locally relevant in an increasingly digital landscape.
Geography Analysis
Western and Southern Europe Van Market
Germany generated 29.13% of revenue in 2025, leveraging a significant volume of active vans and a robust OEM footprint. In late 2023, an abrupt halt to subsidies led to a significant drop in BEV van registrations in 2024, underscoring how policy shifts can eclipse industrial strengths. The United Kingdom, France, and Italy remain key players in the market: the UK is falling short of its own ZEV target, France is reaping benefits from its domestic OEM capacity, and Italy is lagging, hindered by a sparse charging infrastructure.
Northern and Southern Europe Van Market
Norway expands at a 4.53% CAGR as VAT and registration waivers push BEV uptake above 90% of new van sales. Both the Netherlands and Sweden are implementing zero-emission urban zones, supported by financial incentives. Meanwhile, Spain and Italy are experiencing moderate growth. However, their progress is hampered by a slower adoption of BEVs and a lagging rollout of charging stations; for context, Spain has significantly fewer public chargers compared to the Netherlands.
Central and Eastern Europe Van Market
Other European nations, including Poland, the Czech Republic, and Romania, are witnessing steady growth. This growth is primarily driven by expansions in logistics hubs rather than a renewal of domestic fleets. A notable trend is the cross-border registration arbitrage, where fleets purchase vans in Norway or the Netherlands—countries with generous incentives—and then redeploy them in other regions. This loophole has caught the attention of member states, which are now seeking to close it through domicile verification. Charger density varies significantly across Europe, with the Netherlands leading and Poland lagging. This disparity contributes to differing rates of electrification across the continent.
Regulatory Landscape
EU van compliance is anchored by Regulation (EU) 2019/631 on CO2 emission performance standards for new vans, tightening fleet-average targets through 2025-2029 and 2030-2034 versus a 2021 baseline, with a 2035 endpoint embedded in the framework. A December 2025 European Commission proposal to review the rules added uncertainty around the end-state design (including additional flexibility concepts), while national and city measures such as low-emission and zero-emission zones continue to influence fleet renewal timing and route compliance across major logistics markets.
Safety regulation is also raising the technical compliance floor for N1 vehicles via the General Safety Regulation 2 (Regulation (EU) 2019/2144). Phase two requirements applied to existing van models from July 7, 2024, and the July 2026 milestone expands the scope toward more advanced driver monitoring and vulnerable road user protections. This increases OEM and supplier content per vehicle and affects type-approval planning for refreshed model lines.
Value Chain Analysis
The European van value chain runs from upstream materials and components (steel/aluminum, semiconductors, wiring harnesses, and batteries) to vehicle engineering and assembly, then to distribution through direct OEM fleet channels, dealer networks, and expanding digital platforms. After sales follow via service, telematics, software updates, and parts. As battery-electric vans gain share, the value captured shifts toward battery packs, power electronics, thermal systems, and software. At the same time, fleets depend more heavily on charger hardware, depot electrical upgrades, and energy management.
On the supply side, Europe remains exposed to disruptions in critical components, with 2026 production pauses reported at major OEMs tied to battery and wiring-harness constraints. These issues can throttle output even when end-demand exists. OEM responses include platform modularization and localized sourcing initiatives (including joint-venture approaches that emphasize Europe-based supply chains), as well as more flexible plants that build ICE and BEV variants on shared lines. This helps balance diesel-heavy volumes with a growing electric mix, but it keeps pressure on semiconductor, battery-module, and harness supply resilience.
Competitive Landscape
In 2025, Stellantis, Mercedes-Benz, Volkswagen, Ford, and Renault dominated the European van market. Stellantis, leveraging platform commonality, rolled out multiple badge-engineered BEV vans that share a significant portion of their parts, achieving notable cost efficiencies. Mercedes-Benz set itself apart with software innovations; its eSprinter features over-the-air battery optimizations that enhance energy efficiency. Volkswagen showcased the advantages of modular reuse by adapting its MEB platform for the ID. Buzz Cargo. Meanwhile, Ford's E-Transit, built on a modified ladder frame, faces challenges related to weight, which could impact its competitiveness as payload sensitivity becomes more critical.
Chinese players leveraging their integrated battery supply, both BYD and SAIC Maxus, two prominent players, are intensifying price competition by offering comparable BEVs at discounted rates. Rivian disrupts traditional ownership models with its fleet-as-a-service packages, converting capital expenses into per-mile fees. However, smaller startups grapple with the certification costs of adhering to UNECE R100 and ISO 26262 standards, a hurdle that fortifies the position of established players. Below the 2-ton threshold, opportunities abound; for instance, the Renault Twizy Cargo, a micro van, sidesteps certain licensing restrictions, granting it access to pedestrian zones in bustling city centers. Noteworthy strategic maneuvers include Stellantis and IVECO's joint effort to develop electric LCVs for a 2026 debut, and a collaboration between Renault and Volvo's Flexis, set to introduce new E-Tech vans in the same year, underscoring a trend of shared R&D investments.
Today's competition pivots on battery procurement, software capabilities, and charging networks, moving away from traditional sheet-metal distinctions. As the decade unfolds, alliances, platform sharing, and integrated battery strategies will play pivotal roles in determining profit margins within the European van landscape.
Europe Van Industry Leaders
-
Stellantis N.V.
-
Mercedes-Benz Group AG
-
Volkswagen AG
-
Ford Motor Company
-
Renault Group
- *Disclaimer: Major Players sorted in no particular order

Europe Van Market Companies Covered in this Report
- Stellantis N.V.
- Mercedes-Benz Group AG
- Volkswagen AG
- Ford Motor Company
- Renault Group
- Iveco S.p.A.
- Toyota Motor Corporation
- Nissan Motor Co., Ltd
- BYD Co., Ltd.
- Hyundai Motor Company
- SAIC Maxus Automotive Co. Ltd.
- MAN Truck & Bus SE
- London Electric Vehicle Company (LEVC)
- Rivian Automotive LLC
Market Opportunities and Future Outlook
Public procurement under the Clean Vehicles Directive is a near-term demand anchor for zero-emission vans. It shifts public-entity purchasing toward zero-emission vans from 2026 and provides base-load volumes for OEMs and converters in municipal and utility use cases. That policy pull runs alongside tightening CO2 compliance under Regulation (EU) 2019/631, which pushes manufacturers and fleets toward higher BEV availability and more structured compliance planning. The 2025-2027 averaging flexibility also changes how compliance is managed across model cycles.
Industrial investment and product programs open additional whitespace for suppliers and service providers tied to electrified vans, including charging infrastructure, grid connection services, and software-led fleet uptime tools. In 2026, Stellantis announced investment at Ellesmere Port to add a new assembly line for battery-electric medium-sized vans, Mercedes-Benz Vans started VLE production on the VAN.EA platform at Vitoria, and MAN began production of the electric eTGL in Krakow. These actions point to deeper regionalization of electrified commercial-vehicle output, supporting demand for European battery, harness, and power-electronics capacity, along with depot-fast-charging solutions that help multi-shift fleet operations.
Recent Industry Developments in Europe Van Market
- July 2026: Stellantis Pro One announced the upcoming world premiere of its Box on Wheels autonomous concept vehicle for IAA Transportation in Hannover. The concept ties the LCV portfolio to software-defined and connected-service roadmaps, supporting professional-customer offerings beyond powertrain choice.
- June 2026: Stellantis Pro One unveiled an updated version of its compact van family in Europe. The refresh strengthens the OEM's ability to defend share in high-volume urban and last-mile segments, where fleets compare diesel and BEV variants on payload, uptime, and total cost.
- June 2025: Amazon announced it will deploy nearly 5,000 Mercedes-Benz electric vans across Austria, France, Germany, Italy, and the United Kingdom. The rollout represents a large fleet electrification action that increases demand for BEV-capable aftersales, charging access, and vehicle availability in multiple core European van markets.
Europe Van Market Report Scope and Research Methodology
Market Definition and Coverage
For this study, the Europe van market is defined as the revenue generated from the sale of vans used for commercial and mixed-use transport across European countries, counted at the vehicle level and valued in current USD for each year.
Scope exclusions: We exclude heavy trucks and buses, and we also do not count aftermarket parts, service, insurance, or standalone financing as market revenue.
Segments Covered in This Report
- By Gross Vehicle Weight
- N1 Class I (≤ 2 t GVW)
- N1 Class II (2-2.5 t GVW)
- N1 Class III (2.5-3.5 t GVW)
- By Cargo Space
- ≤ 5 m³
- Above 5 m³
- By End User
- Commercial Fleets
- Government and Municipal
- Rental and Leasing Operators
- By Drive Type
- IC Engine - Petrol
- IC Engine - Diesel
- Battery Electric
- Hybrid Electric
- Fuel-Cell Electric
- Alternative Fuel (CNG/LPG)
- By Sales Channel
- Direct OEM Fleet Sales
- Authorized Dealerships
- Online / Digital Platforms
- By Country
- Germany
- United Kingdom
- France
- Italy
- Spain
- Netherlands
- Sweden
- Norway
- Rest of Europe
Data Sources, Market Sizing, and Validation
Desk Research
Desk research was used to anchor the demand and supply signals that shape van sales across Europe, and to keep country totals consistent with official transport and trade statistics. We referred to public sources such as ACEA registration releases, Eurostat transport and external trade tables, and national vehicle registration agencies that publish new vehicle counts. Policy and compliance signals were also checked through European Commission materials on CO2 standards and city access rules (which often affect fleet replacement timing), followed by cross-checks using OEM annual reports, investor presentations, and reputable press.
To convert unit signals into value, we used a paid subscription database for company financials and news to track model mix, price direction commentary, and the timeline of production or supply constraints. Patent databases were selectively referenced to understand the pace of electrification features and platform launches, which can shift average selling prices by class. The sources listed here are illustrative only, and we also referred to other public documents and datasets for data collection, validation, and clarification during the research process.
Primary Interviews and Surveys
Primary work focused on interviews and structured surveys with vehicle manufacturers, fleet operators, dealers, leasing and rental managers, and logistics-focused buyers to confirm what was really being purchased and at what price bands. We used these discussions to validate powertrain shifts, replacement cycles, and the practical impact of clean-zone rules in major European countries, and then to triangulate assumptions where desk sources were not fully aligned.
Distribution of primary research fieldwork respondents
| Company type | Respondent position |
|---|---|
| Top tier: 29% | CXOs: 17% |
| Mid tier: 53% | Functional/Unit leaders: 29% |
| Smaller Players: 18% | Managers: 54% |
Market-Sizing & Forecasting
Sizing was built using top-down and bottom-up logic, where European van demand was reconstructed from registration and sales series and then converted into value using class-level pricing and mix. Once the country totals were formed, they were rolled up to a Europe total and checked against production context and trade flows, so sudden jumps were questioned before being accepted. A selective bottom-up approximation was then used as a reality check, mainly by sampling representative van classes and estimating average selling price times unit volumes, followed by channel checks with dealers and fleet buyers.
The model used a small set of practical inputs that can be updated each year, such as new van registrations by country, diesel versus electrified powertrain share, fleet replacement cycle timing, typical list-price movement versus incentive intensity, and delivery and e-commerce activity that drives last-mile fleet additions. Where a country had limited public detail on powertrain split or price progression, we filled the gap using nearby market proxies and interview-led ranges, and then adjusted only after the totals matched the most stable unit indicators. Forecasts were produced using scenario analysis supported by short ARIMA runs on country unit series, and the final outlook was chosen after confirming assumptions on GDP growth sensitivity, urban access restrictions, and OEM model launch cadence with industry respondents.
Data Validation & Update Cycle
Validation was handled through multiple passes so that the final totals stayed consistent with independent signals. We compared the value outputs against unit registrations, powertrain share trends, and country-level economic and logistics indicators, then investigated any year that showed unusual price or mix movement. If a variance could not be explained by a regulation change, a supply disruption, or a model cycle shift, the assumptions were reopened and the relevant experts were re-contacted.
Before sign-off, the model and key assumptions go through an internal analyst review so arithmetic, currency timing, and cross-country aggregation errors are removed. Reports are refreshed on an annual cycle, and interim updates are made when a material event changes sales momentum, policy direction, or pricing. Right before delivery, we do a final check so the numbers reflect the latest public releases available at that time.
Mordor Intelligence's Europe Van Market Size Versus Other Published Estimates
Published market values for Europe vans can look different across sources, even when they sound like they cover the same topic, because the scope lines are drawn differently and the value build can rely on different unit and price assumptions. In practice, the gap usually comes from whether the estimate counts only new vehicle sales revenue, whether it blends in adjacent light commercial vehicles, and how it treats price changes during incentive-heavy years.
The table points to a clear spread around the mid-2020s. Under Mordor Intelligence's scope, the 2025 value is tied to new van sales revenue in Europe and is built from country unit signals and class-level pricing checks, rather than adding service revenue, heavy commercial vehicles, or a broader light commercial umbrella that can inflate totals.
Benchmark comparison
| Source | Market Size | Gaps in Research Methodology |
|---|---|---|
| Mordor Intelligence | USD 60.45 B (2025) | |
| Industry Association A | USD 56.90 B (2025) | Often starts from EU-only registration counts and applies a narrower average price assumption, which can understate the value when higher-spec fleet trims and electrified models are gaining share. |
| Global Consultancy B | USD 68.20 B (2025) | Commonly groups vans within a wider light commercial bucket and may layer in leasing or service-related revenue, which pushes the total above a new-vehicle sales-only definition. |
Seen together, the differences are mainly explained by what gets counted as revenue and how pricing is translated from unit trends into USD. Our approach stays traceable to country unit indicators and a repeatable price and mix logic, which makes the final market size easier to reconcile with real-world sales movement year to year.
Key Questions Answered in the Report
What is the projected value of the Europe Van market by 2031?
The market is forecast to reach USD 72.76 billion by 2031.
Which drive segment is growing fastest in European vans?
Battery-electric vans are expanding at an 8.11% CAGR between 2026 and 2031.
Why do N1 Class I vans dominate urban deliveries?
Their ≤2-ton GVW, compact footprint, and parking agility suit congested city centers and last-mile routes.
How are rental and leasing operators influencing van demand?
They are growing at 5.65% CAGR as asset-light models help fleets avoid the BEV price premium.
What are the main obstacles to faster fleet electrification?
High upfront BEV costs, semiconductor shortages, limited depot fast-charging, and ongoing driver shortages constrain adoption.