
Market Overview
| Study Period | 2020 - 2031 |
|---|---|
| Forecast Data Period | 2026 - 2031 |
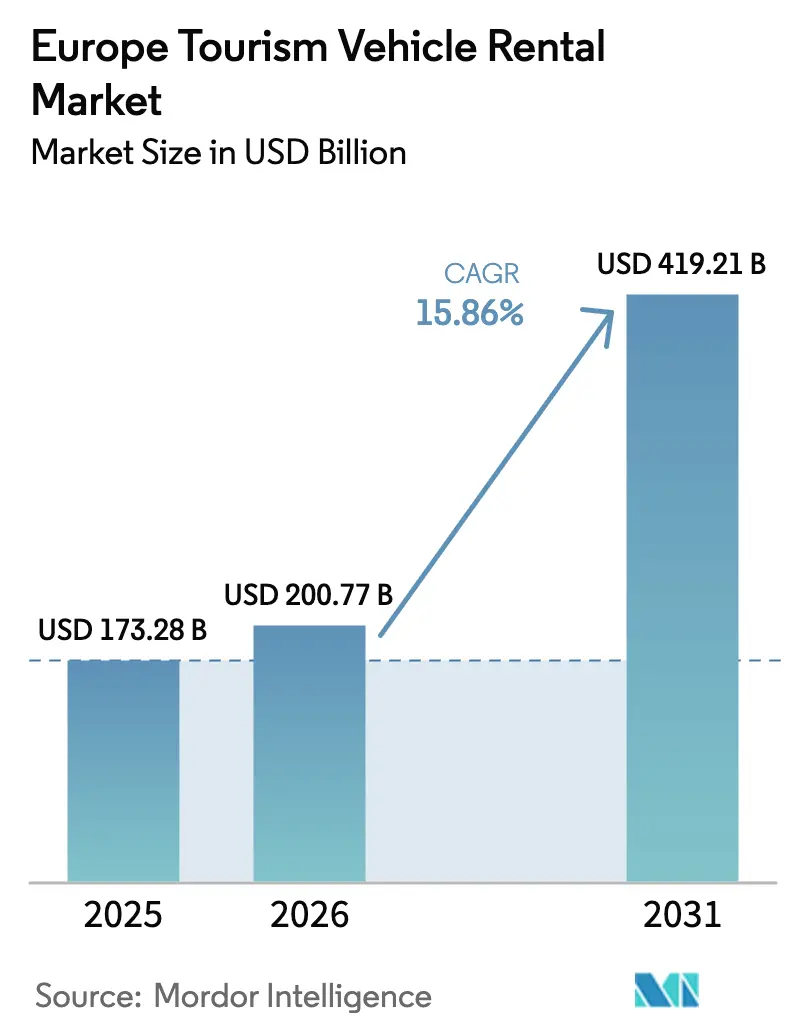
| Base Year Market Size (2025) | USD 173.28 Billion |
| Market Size (2026) | USD 200.77 Billion |
| Market Size (2031) | USD 419.21 Billion |
| Growth Rate (2026 - 2031) | 15.86 % |
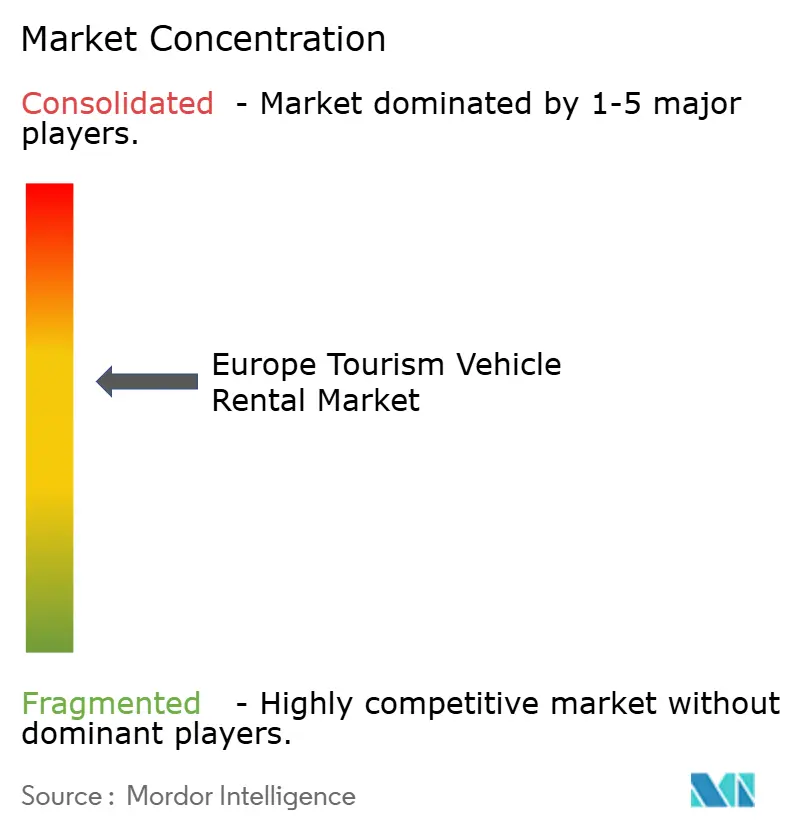
| Market Concentration | Medium |
Major Players *Disclaimer: Major Players sorted in no particular order Image © Mordor Intelligence. Reuse requires attribution under CC BY 4.0. | |
Europe Tourism Vehicle Rental Market Analysis by Mordor Intelligence
The Europe Tourism Vehicle Rental Market size is expected to grow from USD 173.28 billion in 2025 to USD 200.77 billion in 2026 and is forecast to reach USD 419.21 billion by 2031 at 15.86% CAGR over 2026-2031. Pent-up leisure demand, widening Gen Z adoption of access-over-ownership mobility models, and continued constraints on air-rail capacity all reinforce the positive trajectory of the European tourism vehicle rental market. Operators benefit from dynamic-pricing algorithms that lift average daily rates, while EU incentive schemes for electric-vehicle (EV) fleets underpin long-term margin resilience. Technology integration represents both opportunity and operational complexity, with SIXT pioneering app-integrated charging solutions across hundreds of thousands of European charge points, while fleet optimization through 5G and telematics enables real-time demand matching. The sector's growth trajectory faces headwinds from ultra-low-cost public transport expansion in Central and Eastern European markets, alongside proposed surge pricing regulations in Italy and Spain that could constrain revenue optimization strategies during peak tourism periods.
Key Report Takeaways
- By application, leisure tourism held 66.42% of the European tourism vehicle rental market share in 2025 and is projected to expand at a 16.12% CAGR through 2031.
- By booking channel, online platforms captured 72.84% revenue share of the European tourism vehicle rental market size in 2025, while the channel is set to post the fastest 16.05% CAGR.
- By rental duration, short-term bookings commanded 83.55% of the European tourism vehicle rental market size in 2025; long-term rentals are poised for the strongest 15.92% CAGR.
- By vehicle type, economy and compact cars led with 36.22% revenue share in 2025, whereas electric and hybrid vehicles are forecast to grow the fastest at 16.34% CAGR.
- By country, Germany contributed 31.74% of 2025 revenue, while the United Kingdom is expected to see the highest 16.18% CAGR from 2026-2031.
Note: Market size and forecast figures in this report are generated using Mordor Intelligence’s proprietary estimation framework, updated with the latest available data and insights as of 2026.
Market Trends and Insights
Drivers Impact Analysis of Europe Tourism Vehicle Rental Market*
| Driver | (~) % Impact on CAGR Forecast | Geographic Relevance | Impact Timeline |
|---|---|---|---|
| Post-pandemic intra-Europe leisure | +3.2% | Western Europe, Southern Europe | Medium term (2-4 years) |
| Shift from ownership to usership | +2.8% | UK, Germany, Netherlands | Long term (≥ 4 years) |
| Air-rail capacity pinch pushes tourists to road trips | +2.1% | Southern Europe, Mediterranean destinations | Short term (≤ 2 years) |
| Electric-vehicle subsidy schemes favour rental fleet renewals | +1.9% | EU core markets, Nordic countries | Medium term (2-4 years) |
| Dynamic-pricing algorithms | +1.7% | Early adoption in UK, Germany | Short term (≤ 2 years) |
| 5G/telematics integration | +1.4% | Western Europe, expanding to CEE | Medium term (2-4 years) |
| Source: Mordor Intelligence | |||
Post-pandemic intra-Europe leisure boom sustains rental demand
Demand has tilted toward flexible road trips as airport slot shortages and rail bottlenecks persist, making the Europe tourism vehicle rental market integral to itinerary planning. EU tourist establishments logged more than 3 billion guest-nights in 2024, a record that directly converted into higher fleet utilisation. Spain, Italy, and France captured the bulk of incremental visitors, rewarding operators located at gateway airports and downtown depots. Rental companies also lengthened average contract days because travelers explored multiple secondary cities per trip.
Shift from ownership to usership among Gen Z travellers
Digital-native Gen Z consumers perceive vehicles as on-demand mobility solutions rather than depreciating assets, dovetailing with car-sharing and subscription offers. Survey data show 57% of non-EV drivers across 12 EU states are open to battery-electric usage in the next vehicle decision cycle.[1] Netherlands-based car-share platforms logged around one fifth of the rise in corporate memberships, signalling wider crossover from business mobility budgets to leisure extensions.
Air-rail capacity pinch pushes tourists to road trips in Southern Europe
Summer 2024 highlighted structural congestion at key Mediterranean airports, while high-speed rail operators capped frequencies due to maintenance cycles. Ticket prices spiked, prompting visitors to pivot toward road travel. Secondary airports in Andalusia and Sicily reported double-digit expansion in rental pick-ups, underscoring the elasticity between transport modes. Operators benefited from longer booking windows that allowed them to optimise fleet allocation across regional stations. The margin uplift is most visible in one-way rentals that cater to multi-country itineraries, a format uniquely suited to the Europe tourism vehicle rental market.
Electric-vehicle subsidy schemes favour rental fleet renewals (2025-2028)
EU member states collected a decent amount for EV purchase incentives through 2028, covering up to EUR 7,000 per unit for fleet buyers. SIXT committed to buying as many as 250,000 vehicles from Stellantis, heavily weighted to battery models, demonstrating how subsidies offset higher acquisition cost. Planned installation of 3.5 million public chargers by 2030—up from roughly 900,000 now—reduces utilisation risk. Subsidy timelines align with typical fleet-rotation cycles, thereby smoothing residual-value volatility.
Restraints Impact Analysis of Europe Tourism Vehicle Rental Market*
| Restraint | (~) % Impact on CAGR Forecast | Geographic Relevance | Impact Timeline |
|---|---|---|---|
| Ultra-low-cost public transport in CEE markets | -1.8% | Central and Eastern Europe | Medium term (2-4 years) |
| EV charging-infrastructure latency | -1.5% | Rural areas across Europe, particularly Nordic and Alpine regions | Long term (≥ 4 years) |
| EU Digital Markets Act | -1.2% | EU-wide, with concentration in major tourism markets | Short term (≤ 2 years) |
| Surge-pricing caps | -0.9% | Italy and Spain, potential spillover to other Southern European markets | Medium term (2-4 years) |
| Source: Mordor Intelligence | |||
Ultra-low-cost public transport in CEE markets hampers conversion
Governments in Poland, Hungary, and Romania subsidise bus and rail fares that undercut daily rental rates by up to 70%. The price gap discourages tourists from booking cars, especially for point-to-point city breaks. Additionally, CEE cities have expanded multimodal ticketing that integrates trams, metro, and inter-city coaches, lowering friction for riders. Rental operators face utilisation dips during shoulder seasons when discretionary spend tightens. Some have responded by repositioning idle vehicles to Western markets, but logistics costs trim margins.
EV charging-infrastructure latency at rural tourist hot-spots
EU regulation mandates charging stations every 60 km along core corridors by 2025, yet mountain and coastal districts lag implementation, leaving coverage gaps. Alpine resorts in Austria and northern Sweden remain prone to queue-induced range anxiety. Rental companies must therefore maintain dual-fuel fleets, raising capital intensity. Seasonal peaks amplify the infrastructure crunch, pushing some operators to impose kilometre caps on EV bookings. Customer surveys cite charging concerns as the top barrier to selecting electric rentals for nature-based trips.
*Our forecasts treat driver/restraint impacts as directional, not additive. The impact forecasts reflect baseline growth, mix effects, and variable interactions.
Europe Tourism Vehicle Rental Market Segment Analysis
By Application:
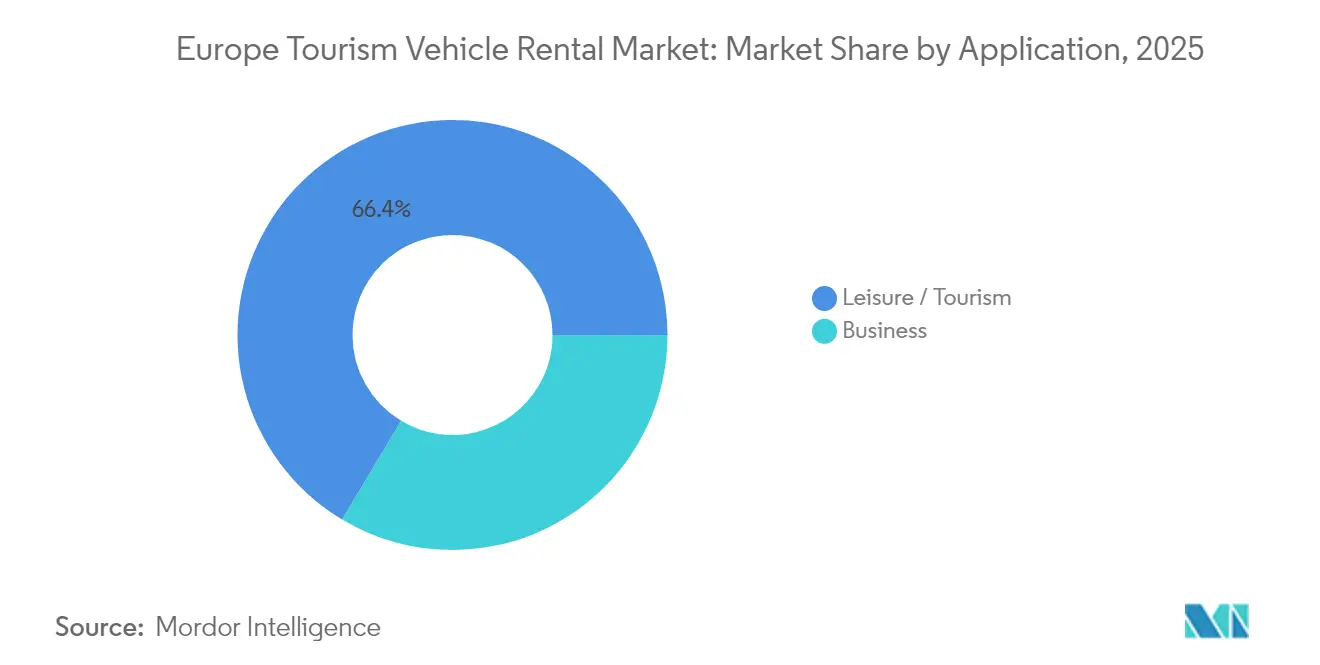
Leisure Tourism Drives Growth Despite Business RecoveryThe leisure segment accounted for 66.42% of the Europe tourism vehicle rental market in 2025, and it is projected to outpace the overall market with a 16.12% CAGR to 2031, underscoring its dual role as both volume and growth engine. Leisure bookings surged as EU guest-night totals hit 3 billion in 2024, reflecting travelers’ preference for flexible road itineraries over group tours, a 2.2% increase compared to 2023. Intraregional trips represented 70% of cross-border flows, extending average rental durations and enhancing yield per contract. Multi-city journeys also increased one-way drop-off revenue.
Leisure growth also benefits from EU push for seamless Schengen travel, allowing tourists to drive across multiple countries without border controls. Promotional campaigns such as Spain’s “Travel Safe” initiative strengthened destination confidence, supporting longer stays that align with extended vehicle bookings. Digital influencers amplify road-trip itineraries, inspiring younger segments to replicate similar experiences, further widening the rental funnel.

By Booking Channel:
Digital Transformation Accelerates Online DominanceOnline channels captured 72.84% of 2025 rental transactions and are forecast to log a 16.05% CAGR through 2031, cementing their primacy in customer acquisition. Algorithmic meta-search visibility, instant confirmation, and transparent pricing underpin customer trust. The EU Digital Markets Act labelled Booking Holdings a gatekeeper in 2024, raising the likelihood of higher commission structures. Operators mitigate dependence on intermediaries by refining direct-to-consumer apps that bundle rewards and seamless check-in.
Dynamic-pricing engines embedded in operator web portals sharpen revenue capture by tailoring rates to search-history signals. Free2move’s all-in-one mobility app offers access to more than 500,000 vehicles worldwide, integrating short-term rental, car-sharing, and subscription plans. Such super-apps reframe bookings as part of broader mobility ecosystems, reinforcing customer lifetime value.
By Rental Duration:
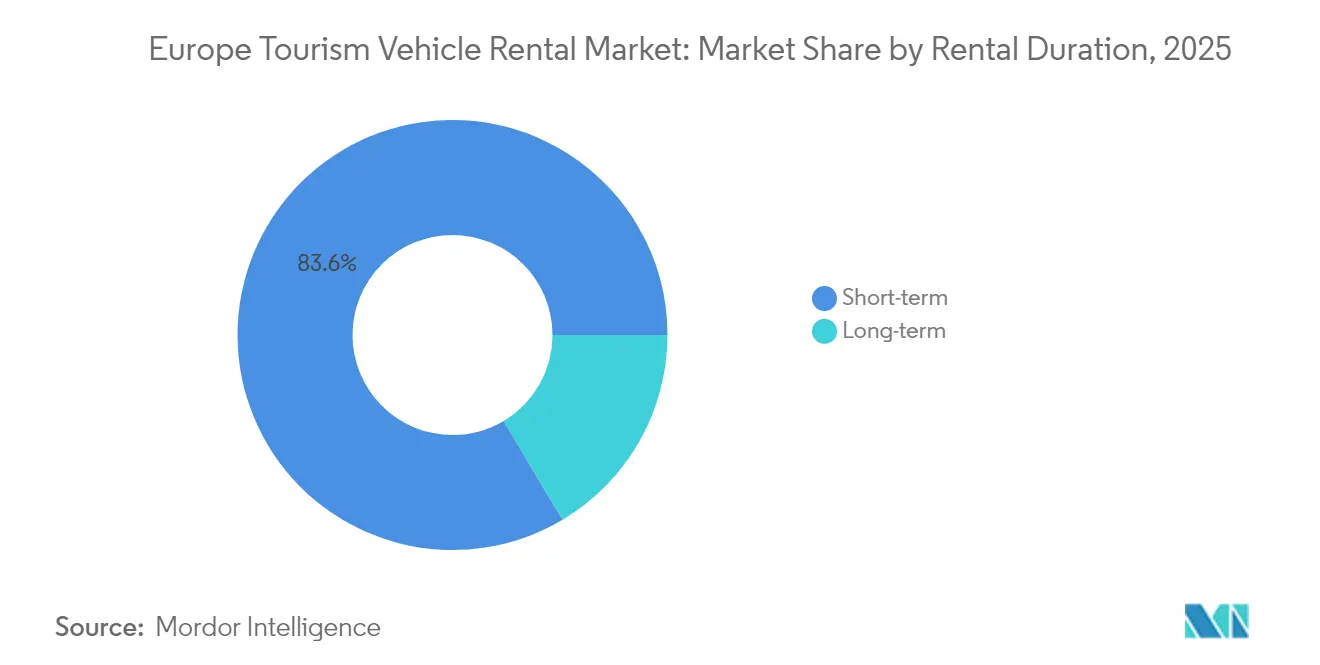
Long-term Segment Emerges as Growth DriverShort-term rentals—defined as contracts under 30 days—held 83.55% of revenue in 2025, yet the long-term category (1-3 months) is projected to expand at a 15.92% CAGR between 2026 and 2031. Subscription-style offers answer consumer needs for flexible yet commitment-light vehicle access, mirroring trends in streaming media and gym memberships. Millennials, facing urban parking constraints, prefer monthly mobility passes over ownership, turning to long-term rentals during work-from-anywhere stints.
Corporate demand fuels the segment as firms outsource fleet management to avoid residual-value risk. Enterprise Mobility’s Flex-E-Rent platform grew double digits in 2024, tapping small-business appetite for on-demand vans. Telematics enable usage-based billing, aligning cost with employee mileage. Long-term contracts also mitigate seasonality, redeploying idle assets from leisure-heavy Mediterranean stations to urban hubs during winter. Cross-selling insurance and maintenance bundles lifts average contract value. The segment’s momentum reinforces the strategic imperative for Europe tourism vehicle rental market participants to integrate subscription architecture within core systems.
By Vehicle Type:
Electric Vehicles Lead Growth Despite Operational ChallengesEconomy and compact models retained 36.22% share in 2025 owing to cost-efficient fleet economics, but electric and hybrid vehicles are forecast to record the fastest 16.34% CAGR. Government decarbonisation targets and low-emission zone expansion compel operators to electrify. SIXT’s in-app charging integration grants renters access to 500,000+ European charge points, addressing range anxiety. The Europe tourism vehicle rental market size for EVs is projected to triple by 2030 as battery costs fall and charging networks densify. Nonetheless, Hertz’s 2024 liquidation of 20,000 EVs underscores the residual-value and maintenance risks tied to high-utilisation environments.
SUVs and crossovers continue to attract families seeking cargo space, while luxury vehicles carve out experience-driven niches such as vineyard tours. Operators use tiered fleet structures to hedge demand volatility: high-utilisation economy units drive volume, premium EVs burnish brand image, and specialty off-roaders diversify yield. Telematics data informs future model mixes by correlating utilisation with customer-rating metrics. As charging infrastructure in rural regions lags, dual-fuel fleets persist, yet investment in mobile rapid chargers signals operator intent to accelerate the transition. Altogether, vehicle-mix optimisation remains a competitive fulcrum within the Europe tourism vehicle rental market.
Geography Analysis
Germany Tourism Vehicle Rental Market
Germany maintained 31.74% of 2025 revenue, benefitting from its central location, strong highway system, and a deeply ingrained corporate-travel culture. The country’s convention calendar and automotive exhibitions secure year-round demand, balancing seasonal leisure peaks. Car-hire stations cluster around Frankfurt, Munich, and Berlin airports, ensuring high fleet rotation rates. However, market maturity and assertive domestic competitors temper forward-growth prospects, yielding a solid yet moderating trajectory compared with peripheral markets.
United Kingdom Tourism Vehicle Rental Market
The United Kingdom is set to post a vigorous 16.18% CAGR to 2031, regaining momentum following Brexit-related uncertainty. Island geography necessitates vehicle rentals for inbound tourists lacking personal cars, while congestion charges in London and other cities propel demand for short-duration hires on the city outskirts. Enterprise Mobility operates more than 480 branches nationwide, underscoring network scale. The UK government’s decision to defer EV duty surcharges on fleets until 2028 further sweetens the operating landscape, spurring accelerated electrification adoption.
Southern and Broader Europe Tourism Vehicle Rental Market
Southern Europe—France, Italy, and Spain—leverages Mediterranean allure and favourable climate to anchor summer demand spikes. France saw double-digit rental revenue growth in 2024 as Parisian and Côte d’Azur attractions reclaimed pre-pandemic visitor volumes. Italy’s tax credit on tourism-related CAPEX enables operators to modernise branches and electrify fleets, while Spanish regional airports report record incoming charter flights. Rest-of-Europe markets, including Poland, Greece, and Portugal, displayed mixed performance: geopolitical tension slowed CEE recovery, whereas Portugal benefited from a surge in North American tourists. Overall, geographic spread offers portfolio insulation for Europe tourism vehicle rental market leaders.
Regulatory Landscape
Europe tourism vehicle rental is governed primarily through horizontal EU frameworks on consumer protection and services rather than a single sector-specific regulation. Enforcement and operating conditions, including fees, insurance practices, deposit handling, and local mobility rules, are shaped largely at the Member State level. EU guidance for citizens on cross-border car rental and ECC-Net consumer-rights resources continue to anchor disclosure and contract-fairness expectations, while the European Commission has highlighted friction from divergent national registration requirements for rental vehicles used across borders, putting cross-border facilitation proposals into policy focus.
Decarbonisation policy is increasingly influencing rental fleets as Council-level discussions on corporate-vehicle measures consider minimum shares of zero- and low-emission vehicles in new registrations for large undertakings, which can include major rental operators. In parallel, EU corridor charging requirements (charging coverage targets along core routes) interact with operator fleet plans by affecting how quickly electric rentals can be deployed at tourist hot-spots and on long-distance itineraries, linking compliance, charging access, and operational readiness.
Value Chain Analysis
The value chain includes (1) vehicle supply and specifications from OEMs, (2) financing, leasing, and fleet lifecycle services, (3) rental-operator procurement, remarketing, and depot operations, and (4) distribution through direct digital channels and intermediated online travel or OTA platforms. Upstream, large-scale procurement agreements and platform partnerships shape availability and model mix, reflected in SIXT's agreement for up to 250,000 vehicles from Stellantis and in OEM-leasing collaborations such as Stellantis and Ayvens working on vehicle reconditioning at the Mirafiori Circular Economy Hub in Turin to feed used-car and secondary rental channels.
In midstream operations, differentiation comes from fleet optimization, telematics, and pricing and allocation capabilities, while downstream demand is increasingly captured through app-led booking, loyalty, and ancillary services such as charging access for EV rentals. The EV transition adds new nodes to the chain, including charging-network access, battery-health monitoring, and residual-value management. At the same time, long-term rental for commercial vehicles is expanding through finance-OEM structures, including the DLL and Iveco Group joint venture tied to GATE to improve access to low- to zero-emission commercial vehicles in Europe.
Competitive Landscape
The Europe tourism vehicle rental market exhibits moderate consolidation, with the three largest global brands—Enterprise Mobility, Avis Budget Group, and Hertz—anchoring supply across major gateways. Enterprise Mobility, crediting European operations for outsized growth. Fleet scale allows bulk procurement discounts and multi-airport network coverage, forming high entry barriers. Regional champions such as Europcar and SIXT protect domestic strongholds through loyalty programmes and premium service tiers.
Technology is the primary battleground for differentiation. SIXT’s API-rich application layers loyalty, mobile check-in, and EV-charging payments, reducing friction across the customer journey. Avis deployed machine-learning algorithms that fine-tune rate fences in sub-5-minute increments, maximising asset yield. Meanwhile, Free2move and Virtuo Technologies blur category lines by combining car-sharing and short-term rental in a single interface, appealing to younger, app-centric audiences. Their asset-light models rely on predictive demand pools rather than expansive branch footprints, pressuring incumbents to streamline legacy overhead.
Strategic alliances expand reach: SIXT’s Stellantis order secures priority vehicle allocation, while Avis partners with IONITY to guarantee fast-charger access along trans-European routes. Cross-industry convergence accelerates, as evidenced by Lyft’s USD 197 million acquisition of FREENOW in April 2025, which imported EUR 1 billion in annualised gross bookings into its multi-modal network.[3] Competitive intensity remains balanced by high capital requirements and the complexity of pan-European regulatory compliance, yet digital disruptors continue to chip away at commoditised pricing segments.
Europe Tourism Vehicle Rental Industry Leaders
-
Sixt SE
-
Avis Budget Group, Inc
-
Hertz Corporation
-
Enterprise Holdings Inc.
-
Auto Europe
- *Disclaimer: Major Players sorted in no particular order
Europe Tourism Vehicle Rental Market Companies Covered in this Report
- Enterprise Holdings Inc.
- Avis Budget Group
- Europcar Mobility Group
- Hertz Global Holdings Inc.
- Sixt SE
- Booking Holdings Inc. (Rentalcars.com)
- Auto Europe
- OK Mobility
- Virtuo
- Green Motion International
- Getaround
- Carwiz International
Market Opportunities and Future Outlook
Electrification is creating a clear whitespace in tourism rental fleets, as policy signals and operator deployment are moving faster than historic ZEV penetration in the segment. The European Commission's corporate-fleet impact assessment (published in 2025) cited rental fleets recording 6.1% ZEV new registrations in the first half of 2025. Named operators have also been scaling EV availability, including SIXT's plan to lift EV availability to over 30% of its fleet in the DACH region by mid-2026, and Europcar Mobility Group UK reporting nearly half a million BEV rental days in 2025 with a 93% year-over-year increase, alongside a 2026 fleet partnership with BMW Group that adds additional electric models. The gap between policy direction and observed fleet mix supports opportunities in EV-specific offerings, such as guaranteed EV class, bundled charging access, and route-ready packages for nature and rural tourism, along with operating capabilities that reduce downtime, including battery-health telemetry and rapid turnaround processes.
Digital distribution and fleet-intelligence programs form a second opportunity area, especially where online platforms dominate bookings and where gatekeeper rules reshape economics. Operators scaling direct channels and loyalty can pair this with station-network upgrades at high-throughput gateways and with subscription-style long-term rentals that smooth seasonality. Investment-backed fleet renewal programs also point to room for scaling in specific countries, including the EBRD-backed electrification financing for Avis in Greece, which supports larger EV procurement and charging-aligned operations in a leisure-heavy market.
Recent Industry Developments in Europe Tourism Vehicle Rental Market
- May 2026: Hertz announced a strategic fleet partnership with Uber, via affiliate Oro Mobility, to provide vehicle asset management for autonomous robotaxi and driver-led fleet operations. The collaboration expands rental-company participation in ride-hailing fleet services while building operational know-how around high-utilization EV and autonomy-adjacent fleets.
- June 2025: Free2move partnered with Ample to pilot modular battery swapping for Fiat 500e units in Madrid, cutting recharge stops to under five minutes and scaling the fleet from 40 to 100 vehicles. The pilot targets higher EV utilization during tourism peaks by reducing charging-related downtime in an urban leisure market.
- June 2024: Europcar launched operations at airport locations in Atlanta and Dallas/Fort Worth, marking its first direct operating footprint beyond Europe. The expansion extends the transatlantic network reach that can support inbound tourist flows and cross-selling to European travelers familiar with the brand.
Europe Tourism Vehicle Rental Market Report Scope and Research Methodology
Market Definition and Coverage
For this study, the Europe tourism vehicle rental market covers revenues earned from renting passenger vehicles to leisure and travel customers across Europe, including airport and city pick-ups, for self-drive use over short and medium durations.
Scope exclusions: We exclude vehicle leasing, chauffeur-driven taxi and ride-hailing trips, and public transport tickets bundled with travel packages.
Segments Covered in This Report
- By Application
- Leisure / Tourism
- Business
- By Booking Channel
- Online
- Offline
- By Rental Duration
- Short-term
- Long-term
- By Vehicle Type
- Economy/Compact
- SUV and Crossover
- Luxury and Premium
- Electric and Hybrid
- By Country
- United Kingdom
- Germany
- Italy
- France
- Spain
- Rest of Europe
Data Sources, Market Sizing, and Validation
Desk Research
Desk work starts by mapping the travel demand pool and the rental supply footprint, since tourism-linked rentals tend to move with arrivals, flight capacity, and seasonal peaks. We refer to public tourism and mobility indicators from sources such as Eurostat, national tourism boards and statistics offices, the European Travel Commission, the International Air Transport Association for air passenger signals, and the International Civil Aviation Organization for airport traffic context.
To translate demand signals into market value, we also use company annual reports and investor presentations, plus airport and rail hub statistics that indicate visitor throughput. We also use reputed press coverage on fleet expansion and pricing changes. Where needed, we complement this with paid subscriptions for company financials, and for intelligence covering market and fleet moves, then cross-check directionally with shipment-level import and export data for vehicles in select countries to sanity-check fleet replenishment cycles. The desk sources listed here are only illustrative, and many other public and proprietary references were used to collect, validate, and clarify data.
Primary Interviews and Surveys
Primary work is used to pressure-test what desk sources cannot show clearly, such as utilization changes between peak and shoulder seasons, discounting intensity, and how online travel platforms shift booking mix. We speak with a spread of rental operators, airport and station concession stakeholders, and travel trade participants across key European destinations, then reconcile the inputs with our model assumptions before finalizing totals.
Distribution of primary research fieldwork respondents
| Company type | Respondent position |
|---|---|
| Top tier: 36% | CXOs: 12% |
| Mid tier: 44% | Functional/Unit leaders: 34% |
| Smaller Players: 20% | Managers: 54% |
Market-Sizing & Forecasting
Our sizing uses top-down and bottom-up logic in a practical way. The top-down path rebuilds demand from Europe travel volumes and trip patterns, which are then converted into rental days and rental revenue using observed booking behavior and price levels. Results are then corroborated using selective bottom-up approximations, such as rolling up sampled operator revenues where available, checking typical fleet size to utilization ranges, and validating average daily rate assumptions through channel checks.
A few market fingerprints are kept in the model because they move the market quickly and can be checked regularly. These include inbound and domestic tourist trip volumes by season, airline seat capacity and airport passenger throughput for major hubs, average rental length of stay (days), utilization ranges during peak months, and average daily rate progression by vehicle class and booking lead time. When a bottom-up view is incomplete for smaller destinations, gaps are handled by applying country-level ratios derived from similar tourism profiles and then reviewed with interview feedback.
For forecasting, we rely mainly on scenario analysis supported by trend smoothing, where macro travel recovery, airline capacity plans, and pricing normalization are used to build base, conservative, and high-demand paths. Assumptions are updated using what operators report on fleet plans, expected utilization, and forward booking strength, so the forecast remains tied to observable travel indicators.
Data Validation & Update Cycle
After the first model run, outputs are checked against independent signals such as tourism arrivals, airport passenger counts, and known seasonality patterns, so the market does not trend in a way that contradicts travel realities. Any sharp jumps in value are reviewed for root causes, which often come from rate spikes, currency impacts, or a step-change in travel volumes.
Before sign-off, the work goes through multi-step analyst reviews, and follow-up calls are triggered when a key assumption shifts beyond a set tolerance band. Reports are refreshed annually, with interim updates when material events occur, and a final pre-delivery pass is completed so clients receive the most current view.
Mordor Intelligence's Europe Tourism Vehicle Rental Market Size Versus Other Published Estimates
Published market values for Europe tourism vehicle rental can look far apart because the boundaries are not always the same, and the price and volume inputs are often built using different shortcuts. In our work, we keep the market tied to measurable travel and rental activity, and then validate the value build with direct operator feedback.
Airport passenger throughput, inbound trip counts, and peak-season utilization checks are the evidence anchors that keep Mordor Intelligence's estimate aligned to realized rental days and realistic average daily rates, rather than to broad mobility spending totals.
Benchmark comparison
| Source | Market Size | Gaps in Research Methodology |
|---|---|---|
| Mordor Intelligence | USD 173.28 B (2025) | |
| Industry Advisory A | USD 28.50 B (2024) | Uses a narrower car rental lens for Europe with a prior-year base, and it often omits tourism-specific rentals beyond standard passenger cars and excludes some adjacent short-term vehicle categories that are picked up in wider tourism mobility accounting. |
| Independent Research Desk B | USD 18.70 B (2026) | Starts from a later forecast-year revenue point and applies a single growth curve, with limited visibility into utilization seasonality and average daily rate dispersion across airport versus downtown channels, which can compress the total market value. |
Looking across the table, the spread is mainly explained by scope boundaries and by how rental value is rebuilt from travel activity and pricing. When demand is reconstructed from travel volumes and then checked using utilization and rate reality checks, the outcome stays easier to trace and to repeat for updates.
Key Questions Answered in the Report
What is the current value of the Europe tourism vehicle rental market?
The sector is worth USD 200.77 billion in 2026 and is projected to more than double by 2031.
Which country holds the largest share in the Europe tourism vehicle rental market?
Germany leads with 31.74% of 2025 revenue due to its central location and strong corporate travel base.
How fast is the United Kingdom segment growing?
The UK is forecast to register a 16.18% CAGR from 2026-2031, the highest rate among major European markets.
Which booking channel is expanding the quickest?
Online platforms are projected to grow at 16.05% CAGR, driven by mobile app adoption and dynamic pricing.
Why are electric vehicles important for rental companies?
Government subsidies and low-emission regulations are nudging fleets toward electrification, with electric and hybrid rentals expected to grow at 16.34% CAGR through 2031.
What is the biggest restraint facing the market?
Ultra-low-cost public-transport policies in parts of Central and Eastern Europe reduce rental uptake, curbing overall market growth.