
Market Overview
| Study Period | 2020 - 2031 |
|---|---|
| Forecast Data Period | 2026 - 2031 |
| Historical Data Period | 2020 - 2024 |
| Market Size (2026) | USD 14.75 Billion |
| Market Size (2031) | USD 20.95 Billion |
| Growth Rate (2026 - 2031) | 7.24% CAGR |
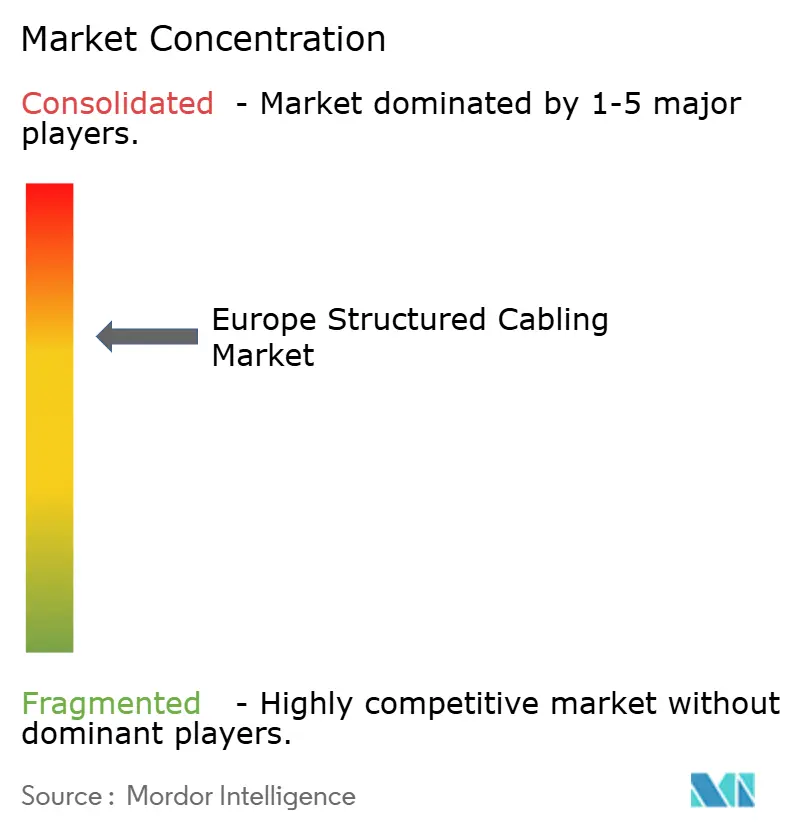
| Market Concentration | Medium |
Major Players *Disclaimer: Major Players sorted in no particular order Image © Mordor Intelligence. Reuse requires attribution under CC BY 4.0. | |
Europe Structured Cabling Market Analysis by Mordor Intelligence
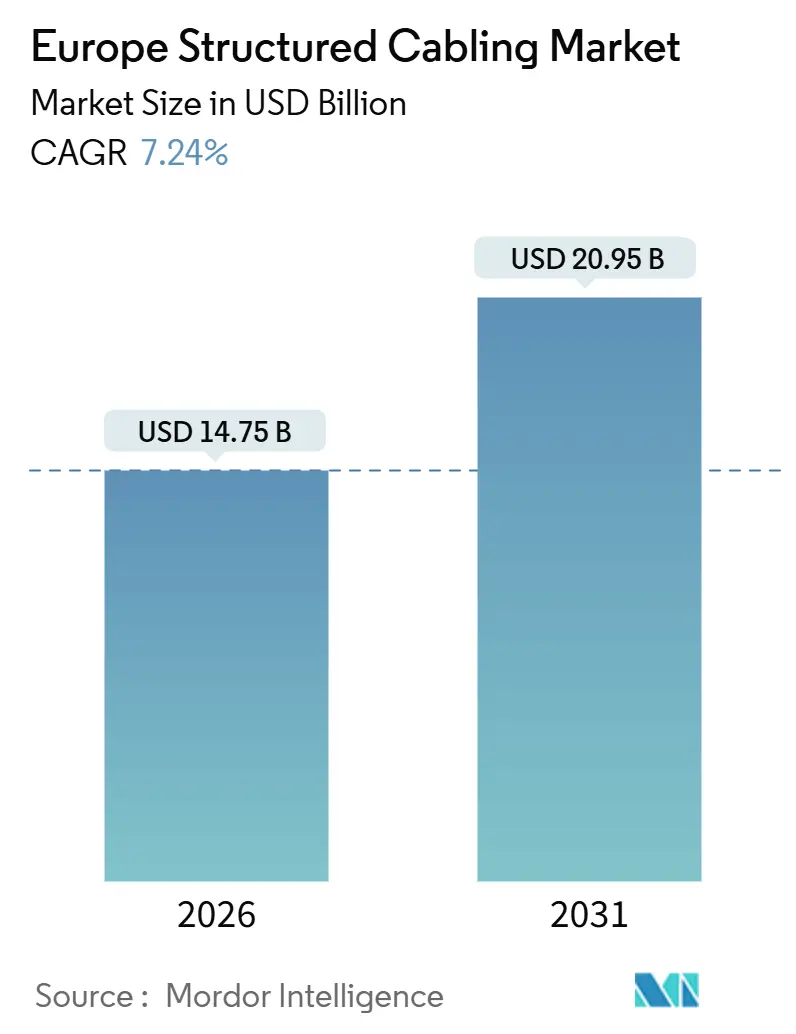
The Europe structured cabling market size stands at USD 14.75 billion in 2026 and is projected to reach USD 20.92 billion by 2031, reflecting a 7.24% CAGR over the forecast period. Rising hyperscale data center construction, aggressive EU digital infrastructure funding, and the electrification of industrial automation networks underpin this expansion. Edge computing rollouts on factory floors, dense 5G back-haul fiber builds, and stricter green-building codes are steering specifications toward higher-bandwidth Category 6A, Category 8, and single-mode fiber systems. Vendors capable of delivering pre-terminated, low-smoke, zero-halogen (LSZH) assemblies are gaining competitive traction as European operators prioritize faster time-to-service and compliance with the Construction Products Regulation. Meanwhile, persistent raw-material price swings, for instance, copper averaged USD 9,513 per metric ton in Q2 2025, squeeze mid-tier installers’ margins.[1]Federal Reserve Bagnk of St. Louis, “Global Price of Copper,” FRED, fred.stlouisfed.org Labor shortages for Category 8-certified technicians further complicate project timelines as hyperscalers accelerate build-outs in Frankfurt, Amsterdam, and Paris.
Key Report Takeaways
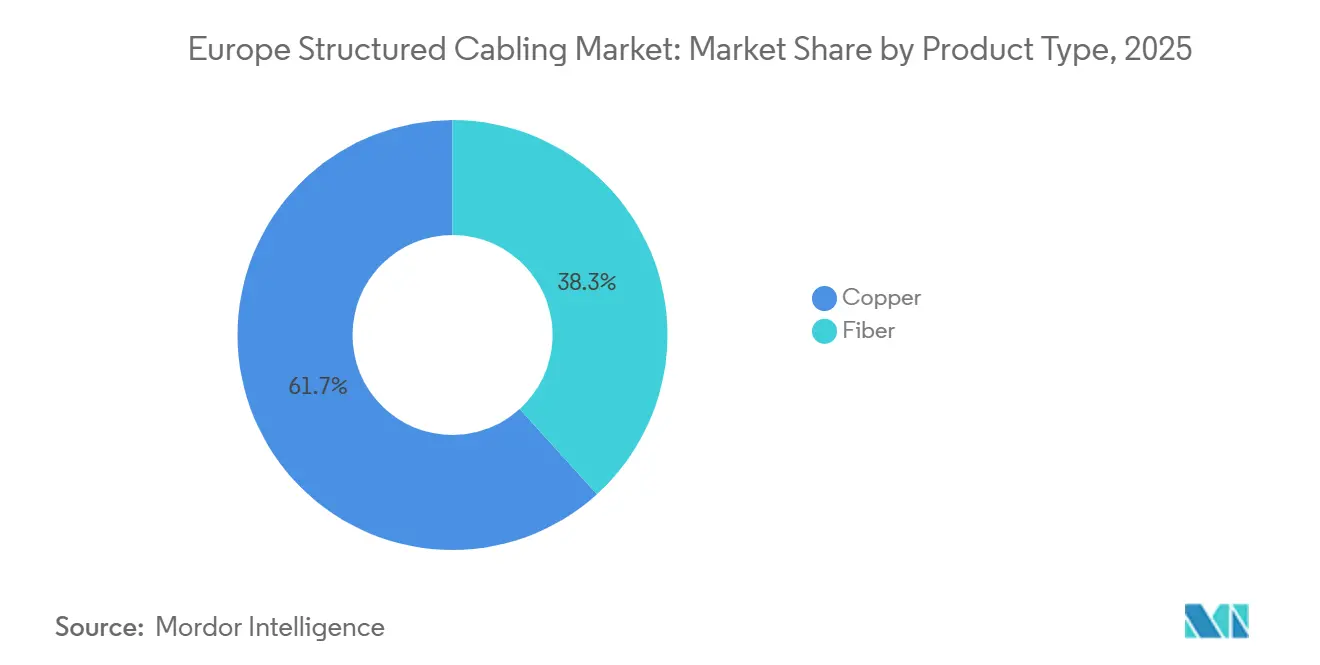
- By product type, copper systems led with 61.72% revenue share in 2025 in the Europe structured cabling market, while fiber solutions are forecast to expand at a 9.02% CAGR through 2031.
- By cable category, Category 6 held 38.63% of Europe structured cabling market share in 2025 whereas Category 8 is projected to grow at 7.98% CAGR between 2026-2031.
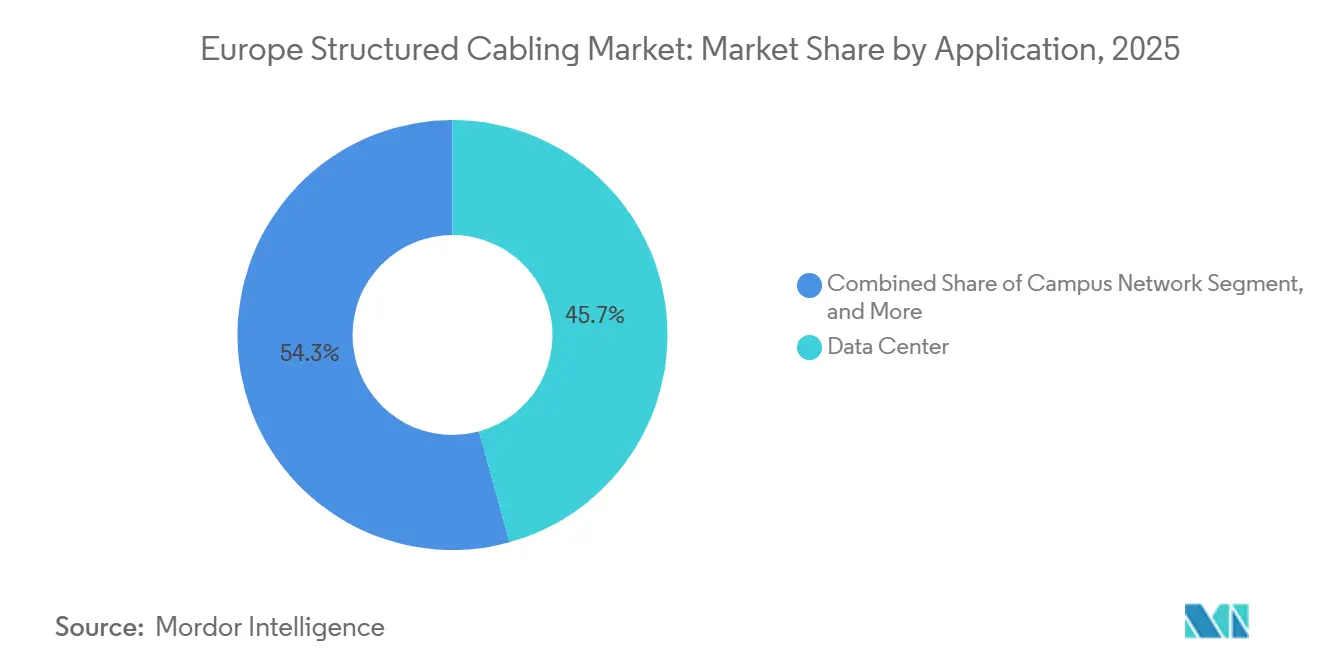
- By application, data-center deployments accounted for 45.73% of Europe structured cabling market size in 2025 while industrial automation networks will advance at an 8.44% CAGR over the same period.
- By industry vertical, IT and telecom dominated with 32.94% revenue share in 2025 of Europe structured cabling market and is estimated to register an 8.14% CAGR to 2031.
- By country, the United Kingdom captured 38.73% of Europe structured cabling market revenue in 2025, while Germany is poised for the fastest 8.44% CAGR through 2031.
Note: Market size and forecast figures in this report are generated using Mordor Intelligence’s proprietary estimation framework, updated with the latest available data and insights as of January 2026.
Europe Structured Cabling Market Trends and Insights
Drivers Impact Analysis*
| Driver | (~) % Impact on CAGR Forecast | Geographic Relevance | Impact Timeline |
|---|---|---|---|
| Hyperscale data-center build-outs across Europe | +1.8% | Germany, France, Netherlands, Nordics | Medium term (2-4 years) |
| Rapid adoption of PoE and IoT driving higher-bandwidth cabling | +1.3% | United Kingdom, Germany, France | Short term (≤ 2 years) |
| EU digital-infrastructure funding (CEF-Digital, Recovery Fund) | +1.5% | Pan-European, with emphasis on Spain, Italy, Eastern Europe | Long term (≥ 4 years) |
| 5G back-haul densification requiring fiber-rich cabling | +1.2% | United Kingdom, Germany, Nordics | Medium term (2-4 years) |
| Stricter EU green-building codes favoring LSZH cable | +0.9% | Pan-European, led by Germany, Netherlands, Nordics | Long term (≥ 4 years) |
| Edge micro-data-center rollout in Industry 4.0 plants | +1.1% | Germany, Italy, France manufacturing hubs | Medium term (2-4 years) |
| Source: Mordor Intelligence | |||
Hyperscale Data-Center Build-Outs Across Europe
Google’s EUR 5.5 billion (USD 6.0 billion) commitment to Dietzenbach and Hanau and Schwarz Group’s EUR 11 billion (USD 12.1 billion) AI hub in Lübbenau epitomize how hyperscale programs embed structured cabling budgets of 8-12% of total capital outlays.[2]Schwarz Digits, “Lübbenau AI Hub Project,” schwarz-it.com Each campus specifies Category 8 copper for top-of-rack links and single-mode fiber trunks exceeding 100 meters, driving demand for 864-fiber MPO assemblies. Data4’s 180 MW Hanau complex and Colt DCS’s 117 MW German pipeline reinforce a multi-year order book that installers must service with pre-staged inventory and certified labor. The Netherlands amplifies regional demand as new trans-Atlantic cables terminate in Amsterdam, necessitating high-density connectivity that fits within tight colocation footprints. Collectively, these mega-projects significantly expand the addressable Europe structured cabling market beyond historical enterprise LAN refresh cycles.
Rapid Adoption of PoE and IoT Driving Higher-Bandwidth Cabling
IEEE 802.3bt’s 90-watt PoE standard ignited large-scale deployments after 2024, when European logistics warehouses and smart-city pilots converged lighting, cameras, and Wi-Fi 6E on unified cabling. Category 6A became the default because its 500 MHz bandwidth supports 10GBASE-T across 100 meters while minimizing voltage drop for devices such as pan-tilt-zoom cameras. The Connecting Europe Facility Digital program earmarked funds for smart-city pilots in Barcelona, Amsterdam, and Copenhagen, multiplying near-term demand for shielded Category 6A bundles.[3]European Commission, “Connecting Europe Facility Digital Programme,” europa.eu Panduit and Siemon are capitalizing by offering 10GBASE-T and TERA connector systems that reduce channel insertion loss and simplify remote powering strategies. Rising PoE currents also require recalculating cable-bundle fill ratios because thermal derating can impair adjacent conductors when conduit occupancy exceeds 40%, nudging facility managers toward higher-grade LSZH jackets.
EU Digital-Infrastructure Funding Programs
The European Parliament Research Service projects EUR 148-200 billion (USD 162-219 billion) in cumulative investment is required to achieve full fiber-to-premises coverage and ubiquitous 5G by 2030. National recovery plans supplement the EUR 2.07 billion CEF-Digital envelope, directing resources to rural fiber rollouts, 5G corridors, and smart-manufacturing clusters. France’s Très Haut Débit program channels EUR 3.5 billion (USD 3.8 billion) into suburban fiber builds, while the United Kingdom’s Project Gigabit allocates GBP 800 million (USD 1.0 billion) to connect 312,000 premises with pre-terminated drop fibers. Spain’s 5G corridor program densifies small-cell sites every 200-300 meters, each requiring Category 6A fronthaul links. Structured cabling vendors positioned in outdoor-rated single-mode fiber and hardened splice closures stand to benefit over the long term.
5G Back-Haul Densification
Europe’s shift from microwave backhaul to fiber transport is accelerating as mid-band 5G spectrum demands fronthaul throughput exceeding 25 Gbps and latency of less than 10 milliseconds. Colt Technology Services’ 2025 Channel Tunnel fiber, engineered for sub-2-millisecond London-to-Paris paths, consumed 400 kilometers of bend-insensitive single-mode fiber. Prysmian and Nexans are scaling their submarine and terrestrial fiber output, with Prysmian’s IOEMA system and Nexans’ hybrid power-fiber cables addressing backhaul densification and grid monitoring simultaneously. High-fiber-count trunks (288-864 strands) and modular cassettes enable mobile operators to aggregate multiple radio sectors onto centralized baseband sites, driving premium demand inside the Europe structured cabling market.
Restraints Impact Analysis*
| Restraint | (~) % Impact on CAGR Forecast | Geographic Relevance | Impact Timeline |
|---|---|---|---|
| Shift toward enterprise-class Wi-Fi and virtualized networks | -0.7% | United Kingdom, Germany, France | Short term (≤ 2 years) |
| High retrofit cost of fiber in brownfield buildings | -0.9% | Italy, Spain, United Kingdom urban cores | Medium term (2-4 years) |
| Raw-material price volatility (copper and optical glass) | -1.1% | Pan-European | Short term (≤ 2 years) |
| Shortage of Cat-8-certified installers and test gear | -0.6% | Germany, Netherlands, Nordics | Medium term (2-4 years) |
| Source: Mordor Intelligence | |||
Shift Toward Enterprise-Class Wi-Fi and Virtualized Networks
Wi-Fi 6E and emerging Wi-Fi 7 devices deliver multi-gigabit throughput in the 6 GHz band, allowing some brownfield offices to reduce the density of new copper drops. Financial firms in Frankfurt and London are piloting software-defined WAN overlays that mix 5G and satellite links, marginally limiting commercial real-estate demand for Category 6A. Private 5G standards published by ETSI in 2024 enable factories to bypass wired Ethernet for certain mobile assets. However, latency-critical workloads, high-frequency trading, machine-vision quality control, still rely on deterministic wired links, preserving a sizable core addressable to structured cabling vendors.
High Retrofit Cost of Fiber in Brownfield Buildings
Historic cores of Rome, Barcelona, and London exhibit retrofit costs of EUR 150-300 (USD 164-329) per meter due to heritage permits, asbestos abatement, and congested conduits. Resulting payback periods exceed 15 years without subsidies, deterring private investors. Consequently, demand for structured cabling skews toward greenfield data centers and industrial parks, while aging office towers rely on incremental upgrades or wireless substitutes. Vendors must navigate lumpy public-sector tender cycles and allocate inventory toward faster-moving hyperscale and industrial projects.
*Our forecasts treat driver/restraint impacts as directional, not additive. The impact forecasts reflect baseline growth, mix effects, and variable interactions.
Segment Analysis
By Product Type: Fiber Moves to the Spine
Fiber connectivity captured accelerating demand in 2026 as hyperscale operators specified single-mode runs for every inter-rack and spine-leaf link exceeding 100 meters, lifting the segment toward a 9.02% CAGR through 2031. Within data centers, 864-fiber MPO trunks enable modular growth while reducing floor-space by 30%, directly contributing to improved power-usage effectiveness metrics. Copper still held 61.72% Europe structured cabling market share in 2025, anchored by vast installed bases of Category 6 and 6A that support PoE lighting and Wi-Fi 6E upgrades. Copper also offers the unique ability to deliver data and 90-watt power over the same medium, an advantage fiber cannot replicate without expensive hybrid cables. The growing Europe structured cabling market continues to see fiber displacing copper in Germany’s megacampuses, where Google and Data4 mandate single-mode only architectures. Yet in logistics warehouses and legacy campuses, Category 6A remains the cost-performance sweet spot, highlighting a bifurcated adoption curve that vendors must balance.
Copper’s outlook is buoyed by PoE trends and the relative simplicity of RJ45 terminations compared to fusion-spliced LC connectors. However, Category 8’s emergence imposes new certification hurdles; test gear costing up to EUR 25,000 (USD 27,400) constrains installer capacity, particularly in Frankfurt and Amsterdam build-hotspots. Fiber’s immunity to electromagnetic interference makes it indispensable in automotive and pharmaceutical plants where variable-frequency drives operate alongside precision robots. Corning’s 2024 bend-insensitive launch, allowing 5-millimeter radii, further reduces cabinet footprints in space-constrained colocation halls. This technology convergence positions fiber to capture higher value per rack even as copper clings to PoE-heavy building networks.


By Cable Category: Category 8 Targets Top-of-Rack Density
Category 8 is projected to log a 7.98% CAGR to 2031, because hyperscalers view its 2 GHz bandwidth and 30-meter reach as an economical bridge to 400 Gbps without overhauling entire spine fabrics. Early adopters include Schwarz Group’s Lübbenau AI hub, where 100,000 GPUs necessitate compact high-speed copper to facilitate rack airflow. Category 6 dominated 38.63% of Europe structured cabling market share in 2025, reflecting its entrenched use across office LANs and education sites. Category 6A, with alien-crosstalk shielding and 500 MHz headroom, remains the go-to for 10GBASE-T and 60-90-watt PoE, accounting for most new commercial renovations. Category 7 and 7A linger in niche industrial settings due to GG45 connector incompatibilities that deter broader adoption.
Certification bottlenecks hamper Category 8 acceleration. BICSI only folded 2 GHz testing into curricula in late 2025, so few technicians can validate the stringent channel limits. As hyperscale sites in Germany outstrip local labor pools, contractors import certified staff or stretch schedules, neither of which aligns with investors’ fast-track targets. Conversely, Category 5e’s residual footprint is shrinking because 100 MHz channels cannot sustain modern PoE budgets or 10GBASE-T, catalyzing upgrade cycles where office landlords opt directly for Category 6A. EU CPR LSZH mandates add 10-15% material cost on Category 6A and Category 8, but compliance is non-negotiable in Germany, Netherlands, and Nordics, prompting vendors to standardize LSZH production.
By Application: Industrial Automation Accelerates
Data-center deployments remained the single largest slice, holding 45.73% of 2025 revenue, but industrial automation networks are poised to grow faster, at 8.44% CAGR to 2031. Automotive and pharmaceutical clusters in Germany and Italy require deterministic sub-1-millisecond latency, achieved through Time-Sensitive Networking over Category 6A or fiber backbones. Belden’s Hirschmann switches and Siemens’ TSN-capable PLCs integrate seamlessly with LSZH copper, shortening commissioning cycles in harsh plant environments. Campus LAN applications expand more slowly because Wi-Fi adoption softens the need for dedicated drops at endpoints, although Power over Ethernet nurse-call systems and hybrid learning labs still draw steady volumes.
Industrial automation’s edge-micro data center model concentrates servers adjacent to production lines, creating localized demand for single-mode fiber spines and Category 8 aggregation switches in ruggedized enclosures. While each factory consumes less cabling than a hyperscale hall, aggregate volume across thousands of plants rivals large data-center rollouts. Data-center projects compress vendor margins due to procurement scale; by contrast, industrial clients value tailored technical support, allowing premium pricing on pre-terminated harnesses and armored fiber.

By Industry Vertical: IT and Telecom Sets the Pace
IT and telecom commanded 32.94% of 2025 revenue and are expected to grow at an 8.14% CAGR, mirroring hyperscale and 5G investments.
Government, utilities, and education round out demand diversity. Grid operators embed fiber in high-voltage power cables, a hybrid Prysmian and Nexans specialty that streams real-time diagnostics into control centers. Universities adopting hybrid learning need 25 Gbps uplinks from lecture halls, but budget cycles fluctuate with public funding. Retail and hospitality favor lower-cost Category 6 for point-of-sale terminals and guest Wi-Fi, yielding modest revenue per site.
Geography Analysis
The United Kingdom generated 38.73% of 2025 revenue as London’s trading floors required dual-diverse 100 Gbps fiber paths and Category 8 aggregation switches to shave microseconds off execution latency. Colt DCS’s Slough expansions and Openreach’s rural fiber-to-premises program keep demand robust, yet higher electricity tariffs versus continental Europe and Brexit-related data-sovereignty questions nudge incremental hyperscale builds toward Frankfurt and Amsterdam. Germany, expanding at an 8.44% CAGR, hosts massive greenfield campuses where structured cabling budgets exceed USD 300 million per site. Data-center projects in Dietzenbach, Hanau, and Lübbenau specify LSZH single-mode fiber exclusively for inter-building links, spurring local demand for fusion splicers and optical time-domain reflectometers. Industrial plants in Bavaria and Baden-Württemberg upgrade to TSN Ethernet, bundling Category 6A with fiber to orchestrate robotics and vision systems.
France’s Très Haut Débit initiative and Colt’s 170 MW Paris pipeline fuel moderate growth, bolstered by EDF’s site-selection drive for low-carbon campuses near nuclear stations. Italy and Spain channel recovery funds into suburban fiber builds yet face costly retrofits in dense city blocks, elongating deployment timelines. The Netherlands capitalizes on new trans-Atlantic cables to Amsterdam, necessitating high-density MPO cassettes that shrink patch-panel real estate. Nordic nations attract capital with carbon-neutral grids; Brookfield’s 750 MW Stockholm project alone will require hundreds of kilometers of outdoor-rated single-mode fiber with low-temperature jackets. Rest-of-Europe markets, from Poland to Portugal, pitch lower land prices and renewable power, luring edge deployments that diversify regional demand.
Regulatory Landscape
EU rules governing in-building and fixed-network deployment are tightening requirements around access, safety, and materials for structured cabling. Regulation (EU) 2024/1309 (Gigabit Infrastructure Act) increases emphasis on faster rollout of very high capacity networks and in-building physical infrastructure access, and BEREC issued guidelines in October 2025 to support dispute resolution and consistent application around access to in-building infrastructure under the Act. Alongside this, EN 50173 and EN 50174 continue to guide structured cabling design and installation practices across Europe.
Product compliance remains a procurement gate, particularly for public buildings, data centers, and multi-tenant commercial projects. The Construction Products Regulation (CPR) 305/2011 drives fire-performance classification (Euroclasses such as B2ca, Cca, Dca, Eca) for permanently installed cables, reinforcing adoption of low-smoke, zero-halogen (LSZH) constructions noted in hyperscale and green-building specifications. Environmental compliance also shapes formulations and connector content, with RoHS and REACH governing restricted substances in cable jackets and connectivity components. This pushes manufacturers toward documented material declarations and traceability across European supply chains.
Value Chain Analysis
The Europe structured cabling value chain covers upstream raw materials (copper, polymers for LSZH jackets, and optical glass), cable and connectivity manufacturing, distribution, design and engineering, and downstream installation, testing, and maintenance for data centers, enterprise buildings, telecom backhaul, and industrial automation networks. Compliance and standards (CPR fire performance, RoHS/REACH, and EN 50173/EN 50174) add qualification steps that influence supplier selection, product labeling, and acceptance testing before handover for permanently installed infrastructure.
Channel models increasingly mix manufacturer-direct hyperscale frameworks with value-added distribution for breadth coverage and local support. Distribution alliances expand reach and availability, including Belden's pan-European alliance with EET Group to enhance supply and technical support across multiple European countries, alongside direct engagements on large data center projects. On the supply side, manufacturers are also reinforcing regional manufacturing and assembly footprints to shorten lead times and reduce logistics risk; Corning's Poland-focused capacity actions in 2026 reflect the nearshoring pull toward Eastern Europe for fiber and connectivity serving AI-ready data center demand. The downstream constraint still centers on certified labor and test equipment availability for higher categories and high-density fiber, which can elongate commissioning cycles even when products are readily available.
Competitive Landscape
Global incumbents Belden, CommScope, and Corning maintain their entrenched positions through multi-year hyperscale frameworks; however, pricing power erodes as operators source multiple assemblies to mitigate supply risk. European specialists Prysmian, Nexans, and Datwyler leverage LSZH manufacturing expertise and proximity to customer sites, shortening lead times for custom fiber counts. Schneider Electric and Siemens bundle cabling with power and cooling in turnkey data center packages, boosting wallet share and locking in customers early in the design cycle. Legrand and Panduit differentiate themselves through intelligent patch panels and cassette ecosystems that enable remote port monitoring, a feature gaining favor among colocation players as they chase operational efficiency.
White-space entrants target edge industrial sites. TE Connectivity and ABB ruggedize transceivers for high-temperature, high-vibration zones, securing early wins in automotive plants. Software-defined connectivity overlays threaten commoditization at the access layer, but latency-sensitive trades and machine-vision lines remain firmly tethered to wired mediums. The Siemon Company and RandM invest in field-terminable Category 8 connectors and advanced certification kits to ease labor bottlenecks in Germany’s construction clusters. Upcoming IEEE 800 GbE and 1.6 TbE standards promise another refresh wave favoring IP-rich stalwarts such as Corning and CommScope.
Europe Structured Cabling Industry Leaders
Belden Inc.
The Siemon Company
Corning Incorporated
CommScope Holding Company, Inc.
Anixter International Inc.
- *Disclaimer: Major Players sorted in no particular order

Market Opportunities and Future Outlook
A key whitespace sits in in-building upgrades tied to fiber-ready requirements and standardized access to in-building infrastructure. With Regulation (EU) 2024/1309 (Gigabit Infrastructure Act) and the implementation push for fiber-ready in-building physical infrastructure, new-build and renovation projects create a pull for compliant pathways, LSZH-rated cables under CPR 305/2011, and documentation that simplifies multi-operator access. BEREC's October 2025 guidelines on in-building infrastructure access also support more consistent dispute handling, which increases the value of standardized cabling plans, labeling, and testing artifacts that reduce friction when multiple service providers and owners operate in the same facilities.
AI-led data center builds and enterprise optical LAN adoption broaden the addressable scope beyond traditional office LAN refreshes. Corning's April 2026 expansion of optical connectivity manufacturing capacity in Strykow, Poland provides a clear signal of strengthening fiber cable and connectivity demand serving AI data centers across EMEA, aligning with the report's focus on single-mode fiber trunks and high-density assemblies in hyperscale campuses. Corning and Nokia's November 2025 collaboration on fibre-to-the-edge and optical LAN solutions further points to an opportunity for structured cabling vendors to package end-to-end enterprise modernization offerings (campus backbone fiber, optical LAN, and pre-terminated assemblies) for sectors such as hospitality, healthcare, and education, where simplified deployment and centralized management influence project selection. Installer constraints for Category 8 certification and high-density fiber testing keep momentum for turnkey, pre-terminated systems and distributor-led technical enablement aimed at shortening time-to-service.
Recent Industry Developments
- May 2026: The Siemon Company launched a portfolio of 200G, 400G, and 800G PAM4 high-speed optical transceivers for AI and data center networks. The release expands Siemon's product lineup to address rising bandwidth demands in hyperscale environments.
- April 2026: Corning Incorporated announced expansion of optical connectivity manufacturing capacity in Strykow, Poland, to serve Europe, the Middle East, and Africa. This capacity addition strengthens supply for European operators and regional partners amid fiber and data center buildouts.
- November 2025: Corning Incorporated partnered with Nokia to provide end-to-end fibre-to-the-edge and optical LAN solutions for enterprise sectors in the EMEA region. The collaboration expands Corning's reach in enterprise connectivity across EMEA, aligning with edge computing and smart building trends.


Research Methodology Framework and Report Scope
Market Definition and Coverage
This market covers revenues earned in Europe from structured cabling used to build or upgrade fixed, standards-based network cabling inside buildings and campuses, including the main cabling media and connectivity that terminate, route, and distribute data signals.
Scope exclusions: It excludes active networking equipment (such as switches and routers), IT services, and ongoing managed network operations.
Segmentation Overview
- By Product Type
- Copper
- Copper Cable
- Copper Connectivity
- Fiber
- Single-Mode Fiber Cable
- Multi-Mode Fiber Cable
- Fiber Connectivity
- Copper
- By Cable Category
- Category 5e
- Category 6
- Category 6A
- Category 7
- Category 8
- By Application
- Local Area Network (LAN)
- Data Center
- Campus Network
- Industrial Automation Networks
- By Industry Vertical
- IT and Telecom
- BFSI
- Healthcare
- Manufacturing
- Government and Public Sector
- Education
- Energy and Utilities
- Other Industry Verticals
- By Country
- United Kingdom
- Germany
- France
- Italy
- Spain
- Netherlands
- Nordics (Denmark, Sweden, Norway, Finland)
- Rest of Europe
Data Sources, Market Sizing, and Validation
Desk Research
Desk research was used to anchor the model to real, observable demand signals in Europe, before interview inputs were layered in. We referenced public statistics and sector indicators such as Eurostat construction output and building permits, national telecom regulator releases for broadband and fiber rollout, and European Commission digital policy publications that shape network upgrades in offices and public buildings.
To keep pricing and supply context realistic, we also reviewed manufacturer technical catalogs and public price lists, and where relevant we checked customs and trade flows using an import and export shipment-level database. We reviewed patent databases to see where copper and fiber design activity is trending. Additional triangulation came from financial filings and investor presentations of key supply chain participants, plus press coverage on European data center builds and commercial retrofit activity. The desk sources listed here are illustrative only, and many other public documents were also used for data collection, validation, and clarification.
Primary Interviews and Surveys
Primary work focused on interviews and structured surveys with installers, distributors, contractors, and product specialists, plus end users involved in commercial building and data center projects across major European countries. These discussions were used to confirm how often fiber versus copper is chosen by building type, to pressure-test movements in average selling price, and to close gaps where public data does not separate structured cabling from adjacent wiring spends.
Distribution of primary research fieldwork respondents
| Company type | Respondent position | Region |
|---|---|---|
| Top tier: 30% | CXOs: 12% | |
| Mid tier: 55% | Functional/Unit leaders: 32% | |
| Smaller Players: 15% | Managers: 56% |
Market-Sizing & Forecasting
Sizing was built using a top-down and bottom-up approach, where the top-down side reconstructed demand by linking Europe building and infrastructure activity to structured cabling intensity. For example, commercial construction and retrofit levels, data center build-outs, and campus network refresh cycles were converted into a demand pool, and then filtered by typical cabling content per project type.
To keep the totals grounded, selective bottom-up checks were run using channel checks and sampled price times volume math by cable type and connectivity, and the results were adjusted when the two views did not align. Inputs treated as key model drivers included the share of fiber versus copper used in new builds, average link speeds that push category upgrades, the mix of new construction versus retrofit work, typical cable length per floor area for common building types, and the direction of raw material pricing that influences product ASPs.
Forecasting relied mainly on scenario analysis, with base, conservative, and high cases tied to construction outlook, data center pipeline visibility, and the pace of enterprise network refresh decisions. When bottom-up coverage was thin for smaller countries, we used proxy indicators such as construction activity and installed base refresh patterns, and then validated the implied spend levels through interviews.
Data Validation & Update Cycle
Outputs were validated through multiple cross-checks that look for mismatches between modeled cabling demand and independent signals like building output trends, data center capacity announcements, and trade movement direction. If a country or application showed an unusual jump, assumptions were reviewed again, and follow-up calls were triggered with installers or distributors to confirm whether it was a real market shift or a modeling artifact.
Before sign-off, the work is reviewed in steps so inputs, formulas, and conversions are checked by another analyst, followed by a final consistency pass across countries and years. Reports are refreshed annually, with interim updates when material events occur, such as sharp copper price swings or major construction cycle changes. Right before delivery, we run a final review so clients receive the most current view available.
Mordor Intelligence's Europe Structured Cabling Market Size Versus Other Published Estimates
Published market sizes for Europe structured cabling can differ even when they appear to cover the same category, because the included products, the geography cut, and how prices are normalized are not always aligned. Differences also show up when one estimate leans more on supplier shipments, while another leans more on construction activity and installation demand.
The main gap comes from whether estimates include adjacent network spending that sits near cabling. In contrast, Mordor Intelligence counts only passive structured cabling components and applies country-level pricing and mix shifts (fiber versus copper) that are rechecked with installer and distributor feedback. Other gaps often come from using global average ASP escalation, mixing current and constant currency years, or not separating data center grade builds from general LAN work, which can move totals up or down in a given year.
Benchmark comparison
| Source | Market Size | Gaps in Research Methodology |
|---|---|---|
| Mordor Intelligence | USD 14.75 B (2026) | |
| Industry Association A | USD 13.90 B (2026) | Uses a narrower capture of installer-delivered value and may undercount connectivity and cabinet related passive components that are bundled into project bills of materials in several countries. |
| Global Consultancy B | USD 16.10 B (2026) | Appears to fold structured cabling into broader network infrastructure spending, which can pull in adjacent low-voltage wiring and some active hardware allocations, and it also applies a more aggressive price progression assumption. |
The spread across the three figures is mainly explained by what gets counted as structured cabling and how price and mix changes are treated year to year. By keeping the scope limited to passive structured cabling, and then validating key variables like fiber share and installed project mix through repeatable checks, the final number stays traceable and easier to update when market conditions change.


Key Questions Answered in the Report
What CAGR is forecast for the Europe structured cabling market to 2031?
The market is projected to expand at a 7.24% CAGR from 2026 to 2031.
Which product type is growing fastest in Europe’s cabling landscape?
Single-mode fiber is set to rise at a 9.02% CAGR as hyperscale data centers migrate to 100-400 Gbps architectures.
Why is Germany outpacing the United Kingdom in new installations?
Mega campuses backed by Google, Schwarz Group, and Data4, along with federal digital-sovereignty policies, are driving an 8.44% CAGR in Germany.
How are PoE trends influencing cable choices?
IEEE 802.3bt 90-watt power budgets make Category 6A the default for new PoE deployments because it balances 10GBASE-T performance with thermal headroom.
What is the main supply-side challenge facing cable vendors?
A shortage of Category 8-certified installers and high-cost test gear is slowing rollouts in Frankfurt and Amsterdam hubs.
Page last updated on:






