
Market Overview
| Study Period | 2020 - 2031 |
|---|---|
| Forecast Data Period | 2026 - 2031 |
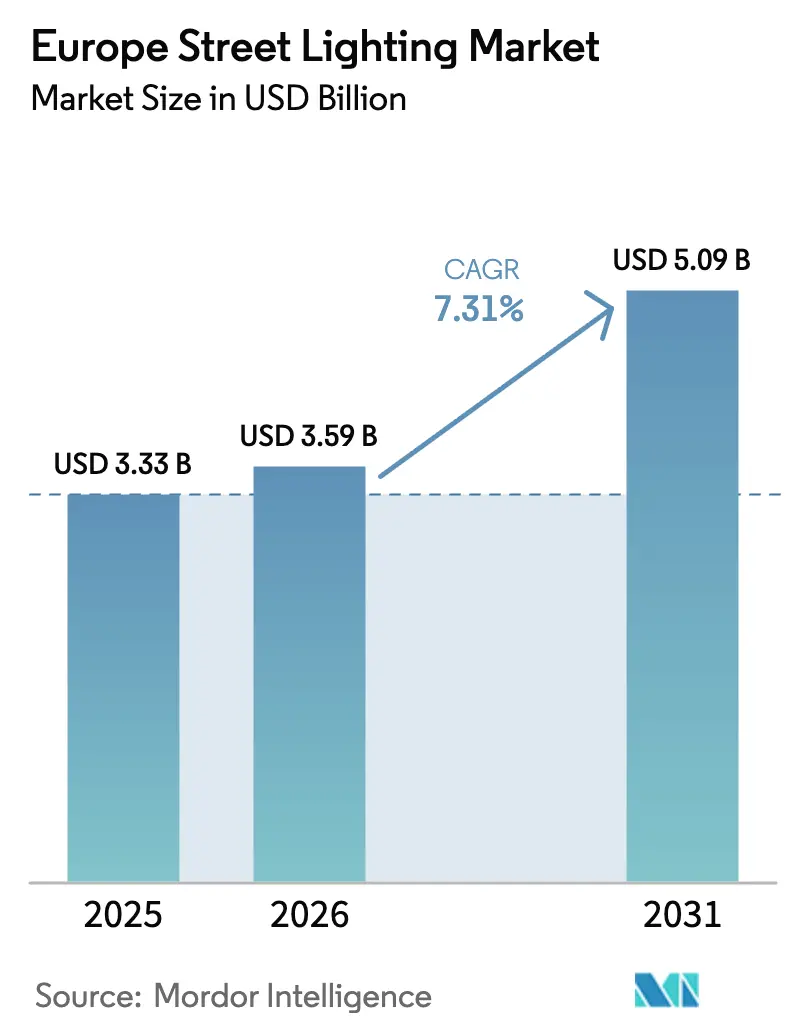
| Base Year Market Size (2025) | USD 3.33 Billion |
| Market Size (2026) | USD 3.59 Billion |
| Market Size (2031) | USD 5.09 Billion |
| Growth Rate (2026 - 2031) | 7.31% CAGR |
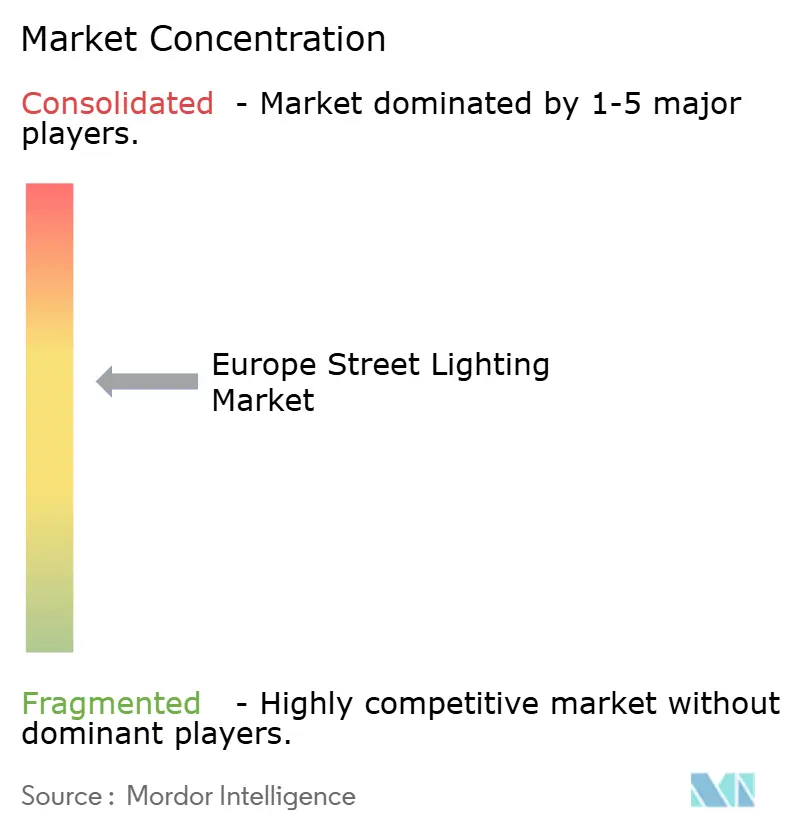
| Market Concentration | Medium |
Major Players
*Disclaimer: Major Players sorted in no particular order Image © Mordor Intelligence. Reuse requires attribution under CC BY 4.0. |
|
Europe Street Lighting Market Analysis by Mordor Intelligence
The Europe street lighting market size is projected to be USD 3.33 billion in 2025, USD 3.59 billion in 2026 and reach USD 5.09 billion by 2031, growing at a CAGR of 7.23% from 2026 to 2031. Energy-efficiency mandates, the 2024 fluorescent-lamp ban and a widening secondary-replacement wave for first-generation LEDs are accelerating tenders across the region. Municipalities are shifting focus from simple lamp swaps to networked platforms that support adaptive dimming, traffic analytics and pole-mounted 5G small cells, thereby turning lighting assets into multi-service gateways. Hardware continues to dominate spending, yet the fastest growth is migrating to software and services as cities favor subscription models that bundle cybersecurity and analytics. Competitive intensity remains elevated as incumbent luminaire makers, connectivity specialists and telecom vendors converge on the same procurement cycles, while smaller towns struggle with up-front capital outlays despite expanded European Investment Bank technical assistance.
Key Report Takeaways
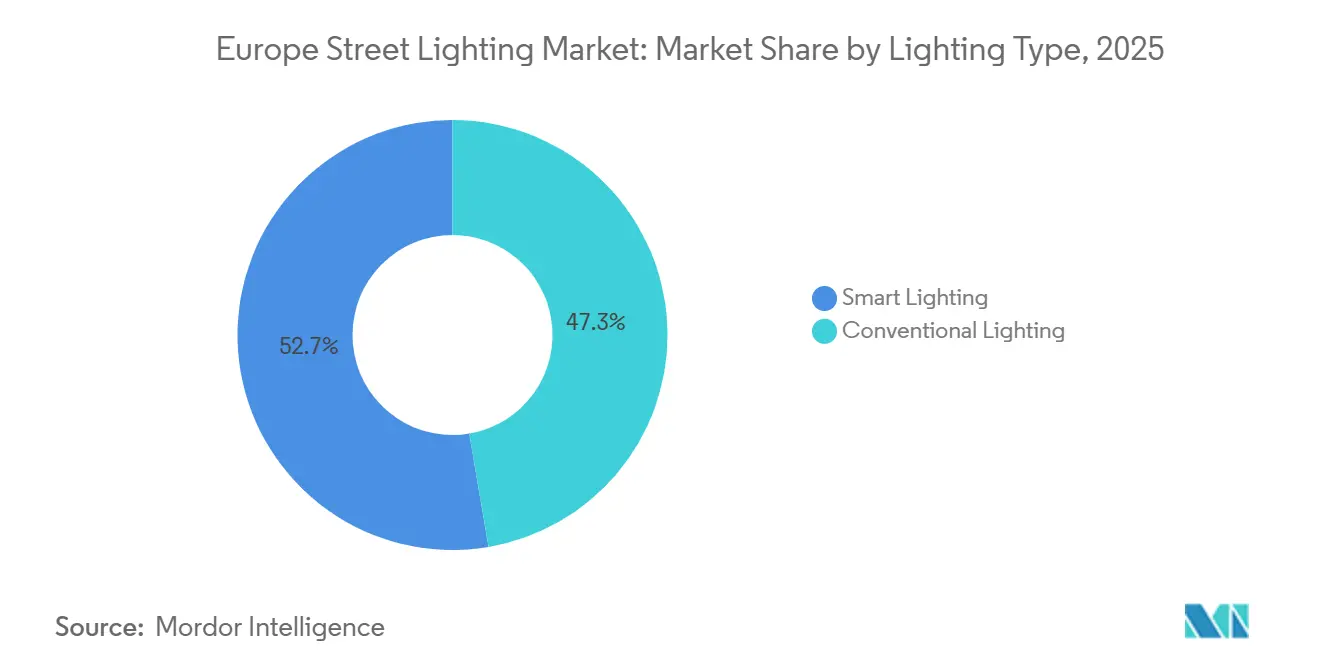
- By lighting type, smart lighting held 52.67% of the Europe street lighting market share in 2025 and is advancing at an 8.12% CAGR through 2031.
- By light source, LEDs accounted for 86.58% of the Europe street lighting market size in 2025 and are expanding at an 8.33% CAGR to 2031.
- By offering, hardware commanded 67.12% of 2025 revenue, while software and services record the highest projected CAGR at 9.04% over 2026-2031.
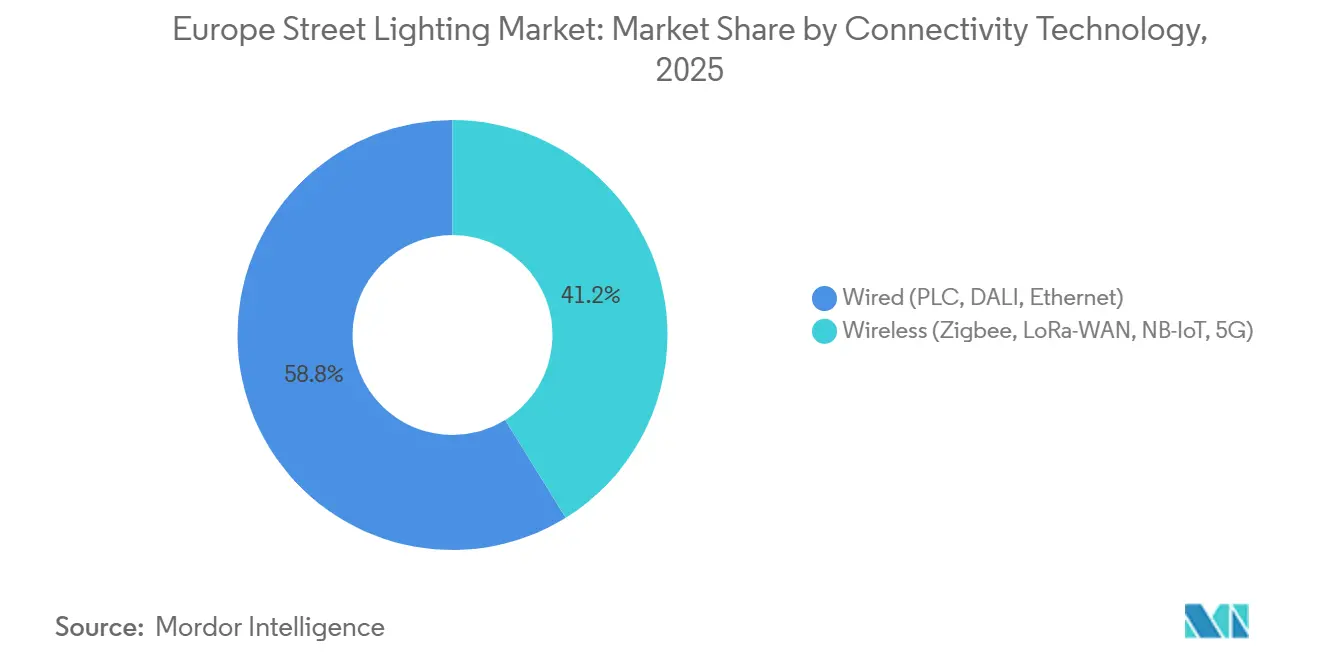
- By connectivity, wired solutions led with 58.83% share in 2025, yet wireless protocols are on track for an 8.93% CAGR through 2031.
- By installation type, retrofit and secondary replacement represented 71.73% of 2025 projects and are forecast to grow at 8.36% to 2031.
- By country, Germany captured 28.73% share in 2025; Italy is forecast to register the fastest national CAGR at 7.97% over 2026-2031.
Note: Market size and forecast figures in this report are generated using Mordor Intelligence’s proprietary estimation framework, updated with the latest available data and insights as of 2026.
Europe Street Lighting Market Trends and Insights
Drivers Impact Analysis*
| Driver | (~) % Impact on CAGR Forecast | Geographic Relevance | Impact Timeline |
|---|---|---|---|
| EU Ban on Fluorescent Lamps and Stricter Ecodesign Targets | +1.8% | EU-wide, with accelerated adoption in Germany, France, Netherlands | Short term (≤ 2 years) |
| Smart-City Stimulus and Pilot Replication Momentum | +1.5% | Germany, France, Italy, Spain, Nordic countries | Medium term (2-4 years) |
| Declining Total Cost of Ownership for LED and Connectivity | +1.4% | EU-wide, with early gains in municipalities >50,000 population | Medium term (2-4 years) |
| EU Recovery and Resilience Facility E-Mobility Corridors | +1.2% | Trans-European Transport Network corridors, priority in Italy, Spain, Eastern Europe | Long term (≥ 4 years) |
| Secondary-Replacement Wave for First-Gen LEDs (2024-2030) | +1.0% | Germany, UK, France, Benelux (early LED adopters 2012-2018) | Medium term (2-4 years) |
| Street-Light Poles Monetised as Edge-IoT Real-Estate | +0.8% | Urban centers in Germany, France, UK, Nordic capitals | Long term (≥ 4 years) |
| Source: Mordor Intelligence | |||
EU Ban on Fluorescent Lamps and Stricter Ecodesign Targets
The European Commission’s Mercury Regulation 2024/1849 mandates a complete phase-out of compact fluorescent lamps by December 2025 and linear fluorescent lamps by December 2026, closing the final loophole for mercury-containing sources. Compliance deadlines have triggered a surge in tender releases as municipalities rush to replace obsolete inventories and retrain crews on LED diagnostics. France has tied EUR 1.5 billion (USD 1.61 billion) of municipal grants to adherence, accelerating take-up in smaller towns. Obsolete ballast write-offs and mandatory recycling add near-term budget pressure, yet they open multiyear demand for connected LED systems that meet updated Ecodesign efficacy thresholds.
Smart-City Stimulus and Pilot Replication Momentum
Horizon Europe labeled 103 cities as climate-neutral demonstrators in 2024 and allocated EUR 41 million (USD 43.9 million) for integrated pilots where lighting forms the digital backbone.[1]European Commission, “EU Recovery and Resilience Facility,” ec.europa.eu Germany’s EUR 10 billion (USD 10.7 billion) climate fund reimburses up to 50% of retrofit costs when projects embed traffic sensing and air-quality nodes, spurring replication in mid-sized municipalities. The RESONANCE project is scaling LoRaWAN-based architectures proven to cut energy use 35% and truck-rolls 42% in Iceland. Funding consistency and published best-practice playbooks continue to shrink decision cycles, propelling the Europe street lighting market toward platform models.
Declining Total Cost of Ownership for LED and Connectivity
Between 2020 and 2024, average LED luminaire prices dropped 20% and narrowband-IoT modules fell below EUR 10 per node, making smart capability almost cost-neutral. A Smart Cities Marketplace audit shows that replacing a 100 W high-pressure sodium lamp with a 40 W LED saves 26,280 kWh over its life, paying back within 3.2 years at prevailing tariffs. Predictive diagnostics cut maintenance labor 30-40%, further widening the lifecycle gap. Italy’s EUR 2.2 billion (USD 2.35 billion) PNRR funding enables bundling with EV chargers, diluting per-pole capital outlays.
EU Recovery and Resilience Facility E-Mobility Corridors
The Recovery and Resilience Facility earmarks street-light upgrades along TEN-T corridors to support fast EV charging, awarding Bulgaria EUR 76 million (USD 81.3 million) in 2024. The United Kingdom’s GBP 1.1 billion (USD 1.39 billion) LEVI fund applies identical photometric standards to on-street chargers. Corridor projects demand higher lumen packages, adaptive dimming and ruggedized enclosures, channeling premium demand toward suppliers with highway-grade portfolios.
Restraints Impact Analysis*
| Restraint | (~) % Impact on CAGR Forecast | Geographic Relevance | Impact Timeline |
|---|---|---|---|
| High Up-Front CAPEX for Smart Retrofits in Small Municipalities | -1.2% | Southern Europe, Eastern Europe, rural municipalities <10,000 population | Short term (≤ 2 years) |
| LED Driver Reliability and Thermal Ageing Failures | -0.9% | EU-wide, particularly in high-ambient-temperature zones (Southern Europe) | Medium term (2-4 years) |
| Cyber-Security and GDPR Compliance Burden | -0.7% | Germany, France, Nordic countries with stringent data-protection enforcement | Medium term (2-4 years) |
| Semiconductor-Component Supply Volatility | -0.6% | EU-wide, with acute impact on custom-control systems | Short term (≤ 2 years) |
| Source: Mordor Intelligence | |||
High Up-Front CAPEX for Smart Retrofits in Small Municipalities
A networked LED unit costs EUR 300-500 versus EUR 150 for a non-connected replacement, a hurdle for towns with annual budgets under EUR 5 million (USD 5.93 million).[2]European Investment Bank, “ELENA Program,” eib.org While the ELENA facility has mobilized EUR 1.1 billion (USD 1.31 billion) for technical assistance since 2009, coverage remains uneven in Southern and Eastern Europe. France’s France 2030 plan bundles lighting with broader infrastructure upgrades, effectively sidelining stand-alone bids from cash-strapped communes. Cyclic grant windows further delay adoption, constraining early volume in the Europe street lighting market.
LED Driver Reliability and Thermal Ageing Failures
Field data show 15-20% failure rates in first-generation LED drivers after eight years, far earlier than the promised 15-year life, with Mediterranean pavement temperatures pushing junctions beyond 70 °C. Premature outages erode lifecycle savings and fuel skepticism during second-wave procurements. Research now recommends silicon-carbide devices and liquid-cooled heat sinks, but municipalities remain wary, slowing conversion in Spain, Italy and Greece.
*Our forecasts treat driver/restraint impacts as directional, not additive. The impact forecasts reflect baseline growth, mix effects, and variable interactions.
Segment Analysis
By Lighting Type: Smart Platforms Capture Majority Share
Smart platforms accounted for 52.67% of 2025 revenue, demonstrating that the Europe street lighting market is steadily migrating from commodity lamp replacement to network intelligence. Remote diagnostics and adaptive dimming lower lifecycle costs, while pole-mounted radios support add-on services such as traffic analytics and environmental monitoring. Municipal bundling with 5G small cells opens incremental lease income, reinforcing platform economics. Conventional lighting retains relevance in rural zones where debt capacity is limited, yet declining component prices and widening grant access are set to narrow its addressable pocket by 2030.
Continued stimulus from Horizon Europe and evidence from pilots such as LORIOT’s 6,000-node Iceland deployment have validated energy and maintenance savings, shortening payback periods below four years. As cities publish open-data dashboards powered by lighting networks, civic appetite for sensor integration is rising, anchoring future procurement specifications firmly in favor of smart infrastructure.


By Light Source: LEDs Dominate with Accelerating Growth
LEDs commanded an 86.58% share in 2025 and are advancing at an 8.33% CAGR to 2031 as the Europe street lighting market size shifts wholesale toward solid-state sources. Mercury Regulation 2024/1849 makes the purchase of fluorescent lamps illegal after 2026, while high-pressure sodium remains in slow retirement due to poor dimming compatibility. Secondary replacement of early LED vintages further lifts unit volumes without adding new poles.
Advances in chip-scale packaging and silicon-carbide drivers are extending usable life under high-ambient conditions, directly addressing the primary restraint of thermal driver failures. As ballast inventories and technician skill sets for legacy lamps vanish, post-2026 tenders are expected to specify LED-only solutions, cementing the technology’s near-total dominance.
By Offering: Software and Services Expand Fastest
Hardware maintained a 67.12% share in 2025 because every retrofit begins with a luminaire and controller. Even so, software and services are on track for a 9.04% CAGR as municipalities shift toward lighting-as-a-service, rolling cybersecurity updates and data analytics subscriptions. The EU Cyber Resilience Act obliges ongoing patch support, catalyzing multi-year platform contracts and stable recurring revenue streams.
Signify’s Interact and Telensa’s PLANet platforms illustrate the pivot, offering APIs for traffic flow or air-quality modules that can be turned on without swapping the fixture. Hardware margins compress as Asian vendors commoditize LED engines, further motivating incumbents to upsell analytics and value-added services.
By Connectivity Technology: Wireless Protocols Gain Ground
Power-line communication and DALI-over-mains kept wired systems at a 58.83% share in 2025, but cellular narrowband-IoT, LoRaWAN and early 5G are accelerating at an 8.93% CAGR as the Europe street lighting market embraces radio links to avoid conduit digs. Wireless units are particularly appealing in historical city centers where trenching is prohibited or in sprawling suburbs where pole spacing exceeds 50 m.
EN 303 645 V3.1.3 from ETSI created a clear security baseline, reducing risk-perception barriers. Early concerns about latency and interference are subsiding as pilot data confirm stable performance and over-the-air firmware updates. Wired systems remain favored for highway corridors requiring deterministic latency and for municipalities with existing broadband-over-power infrastructure, yet wireless momentum is unmistakable.
By Installation Type: Retrofit Dominates Amid Secondary-Replacement Wave
Retrofits represented 71.73% of 2025 activity, underscoring the vast aging installed base and the onset of second-cycle replacements for first-generation LEDs. Mandatory fluorescent phase-out dates and EU financing windows converge to keep retrofit volumes high through 2031. New installations are confined to highway expansions and greenfield developments concentrated in Eastern Europe, resulting in lower share despite solid CAGR.
Complexity in retrofit projects drives demand for modular fixtures with tool-free driver swap capability, trimming truck time and extending asset value. The learning curve from first-wave LED rollouts informs tighter procurement specifications on thermal management, cybersecurity and open APIs.
Geography Analysis
Germany led with 28.73% of 2025 revenue, anchored by USD 10.7 billion in federal climate and transformation funds and mature energy-performance contracting know-how. Early LED adopters now face wide-scale driver failures, spurring secondary replacements that almost always include smart controls and sensor docks. The United Kingdom and France follow, each leveraging national EV-charging funds and renewable microgrid incentives that mandate compliant lighting upgrades.[3]Gouvernement Français, "France 2030 Investment Plan," gouvernement.fr
Italy is projected as the fastest climber at a 7.97% CAGR to 2031, propelled by USD 2.35 billion in PNRR urban mobility allocations. Historically low LED penetration leaves ample room for catch-up, and bundled e-mobility corridor projects along the Autostrada network are accelerating award volume. Spain, Portugal and Greece confront harsher thermal stress and tighter municipal budgets, tilting demand toward cost-optimized LED replacements unless multilateral funding is secured.
Nordic countries exhibit the highest per-capita spend on smart lighting due to steep electricity tariffs and progressive climate goals, reinforcing premium demand for advanced analytics. Eastern European member states benefit from Recovery and Resilience Facility corridors, yet smaller municipalities still depend heavily on ELENA technical assistance to navigate complex procurement formats and performance contracts.
Regulatory Landscape
EU product access for street-light sources and control gear is anchored by Ecodesign rules under Regulation (EU) 2019/2020, in force since 1 September 2021, which sets minimum energy-efficiency and functional requirements for light sources and separate control gear used in outdoor luminaires. Energy labelling obligations apply at the light-source level under Delegated Regulation (EU) 2019/2015, while luminaires as complete products remain outside specific EU energy-label scope. This shapes how municipalities compare offers and how suppliers configure replaceable engines and drivers.
CE conformity processes manage compliance, including maintaining technical documentation and Declarations of Conformity aligned to harmonised standards referenced in the Official Journal of the EU. For vendors and integrators, standard updates and withdrawal timings can affect tender eligibility and after-sales obligations for smart control gear in long-duration municipal frameworks.
Competitive Landscape
The Europe street lighting market is moderately concentrated around global incumbents such as Signify, Zumtobel Group and Schréder that combine broad luminaire portfolios with vertically integrated optics, drivers and control stacks. Signify leverages its Interact platform and BrightSites pole-monetization model to sell outcome-based contracts, while Zumtobel emphasizes architectural optics for heritage districts and Schréder targets ruggedized highway fixtures.
Controls specialists including Telensa, Itron and Cisco Systems decouple software intelligence from luminaire hardware, allowing municipalities to upgrade algorithms without ripping out fixtures. Systems integrators and energy-service companies bundle lighting with broadband, charging or surveillance networks, transferring capital risk through performance-based agreements and placing further pressure on traditional product margins.
White-space opportunities are most evident in the secondary-replacement cycle and in edge-IoT monetization. ETSI’s EN 303 645 and the EU Cyber Resilience Act give an advantage to vendors able to resource multi-year patch management, penalizing low-cost entrants that cannot sustain compliance. Thermal-management startups offering liquid-cooled heat sinks or silicon-carbide driver modules address the reliability restraint, while LoRaWAN network operators secure contracts by shouldering connectivity deployment.
Europe Street Lighting Industry Leaders
-
Signify N.V.
-
Zumtobel Group AG
-
Schréder SA
-
Eaton Corporation plc
-
OSRAM GmbH
- *Disclaimer: Major Players sorted in no particular order

Market Opportunities and Future Outlook
A visible whitespace sits in procurement formats that reduce up-front CAPEX for smaller municipalities while still enabling networked upgrades. Energy Performance Contracting and ESCO structures are moving from pilots into contracted rollouts. Umbrete’s long-term energy services contract with Veolia includes replacing 2,368 luminaires and modernizing telemanagement, while Sofia Municipality published an ESCO-model procurement notice for outdoor lighting modernization in its Vitosha District. Together, these actions expand the addressable pipeline for vendors that can package hardware, controls, installation, and guaranteed savings.
Compliance-led differentiation is also gaining traction in smart lighting supply, with public buyers increasingly requesting verified sustainability and lifecycle data alongside interoperability and maintenance readiness. In Ireland, the EPA updated Green Public Procurement criteria for lighting in 2024, tightening requirements around circularity and end-of-life handling. At the same time, EU ecodesign and labelling rules keep pressure on efficacy and documentation. Demonstrator and replication programmes such as Interreg Europe RESONANCE and EU-backed smart-city pilots further pull demand toward vendor-neutral architectures (TALQ, Zhaga, DALI) and service layers that support remote monitoring, cybersecurity patching, and analytics without full fixture replacement.
Recent Industry Developments
- May 2026: Signify completed a smart, traffic-adaptive street lighting project for Liverpool City Council in the United Kingdom using LumiStreet Gen2 luminaires and Interact City management software connected to real-time traffic sensors. The deployment reinforces procurement pull for adaptive dimming and sensor-linked control as cities shift beyond lamp swaps into data-driven operations and measurable energy optimization.
- April 2025: Signify and Cornerstone agreed to deploy a citywide multi-operator wireless network through existing street-lighting infrastructure in the United Kingdom. Using lighting assets as host sites expands pole monetization pathways and increases the value of luminaires designed for integrated connectivity and ongoing service contracts.
- December 2024: Zumtobel Group signed a financing agreement with the European Investment Bank to support investments linked to its sustainability and innovation agenda. Lower-cost capital for upgrades and product development strengthens vendor capacity to compete on next-generation LED optics, controls, and compliance documentation demanded in large municipal tenders.


Research Methodology Framework and Report Scope
Market Definition and Coverage
For this study, the market covers street and roadway lighting systems sold and deployed across Europe, including luminaires, related controls, and associated software and services used to light public roads and streets.
Scope exclusions: We exclude indoor lighting, decorative architectural facade lighting that is not meant for roadway illumination, and privately owned small-area outdoor lighting used only within building premises.
Segmentation Overview
-
By Lighting Type
- Conventional Lighting
- Smart Lighting
-
By Light Source
- LEDs
- Fluorescent Lamps
- HID Lamps
-
By Offering
-
Hardware
- Lights and Bulbs
- Luminaires
- Control Systems
- Software and Services
-
Hardware
-
By Connectivity Technology
- Wired (PLC, DALI, Ethernet)
- Wireless (Zigbee, LoRa-WAN, NB-IoT, 5G)
-
By Installation Type
- New Installation
- Retrofit, Secondary Replacement
-
By Country
- Germany
- United Kingdom
- France
- Italy
- Rest of Europe
Data Sources, Market Sizing, and Validation
Desk Research
Desk research was used to set the market perimeter and to anchor key inputs that can be checked repeatedly year after year. We relied on public sources such as Eurostat for energy and construction indicators, the European Commission and EUR-Lex for lighting-related policy signals, and CEN/CENELEC references for standards that influence product adoption. Where available, we also reviewed tender portals run by cities and national procurement bodies because these often show the move from conventional replacements to LED retrofits.
To connect supply and demand, we reviewed annual reports and investor presentations of active lighting and controls suppliers, along with reputable trade press and association websites that track municipal infrastructure programs. Patent databases were used selectively to spot where smart controls and connectivity features are seeing higher activity, which helped when stress-testing the pace of upgrades. We also used paid subscriptions for company financials and news screening, plus public procurement and tenders tracking, so the model could be cross-checked against contract timing. These desk research sources are illustrative, and other public references were also used for data collection, validation, and clarification.
Primary Interviews and Surveys
Primary work focused on validating what is actually being bought and installed, and how pricing and upgrade cycles are moving across Europe. We spoke with a mix of municipalities and local authorities, utilities and maintenance contractors, and lighting and controls stakeholders, then used those inputs to confirm assumptions on retrofit shares, smart adoption, and service attach rates across major sub-regions.
Distribution of primary research fieldwork respondents
| Company type | Respondent position | Region |
|---|---|---|
| Top tier: 32% | CXOs: 18% | |
| Mid tier: 49% | Functional/Unit leaders: 25% | |
| Smaller Players: 19% | Managers: 57% |
Market-Sizing & Forecasting
Market sizing was built from a top-down approach where public infrastructure upgrade activity and replacement cycles are reconstructed, and then translated into annual spending by applying adoption and pricing assumptions. To keep the totals realistic, we corroborated the output with selective bottom-up checks, such as sampled average selling prices times likely unit volumes in retrofit programs, plus supplier revenue exposure checks from disclosures and channel feedback.
A few inputs that mattered in the model were the retrofit versus new-install split, the speed of LED conversion, the share of smart lighting within new awards, and the attach rate of software and services linked to controls. We also tracked the typical refresh cycle of luminaires and control nodes, and the mix shift across connectivity options (wired versus wireless) because it affects system value per point. Where country-level data was not equally available, gaps were handled through proxy indicators like public capex intensity, road network development signals, and tender cadence, which were then normalized using expert feedback.
For forecasting, scenario analysis was used because municipal budgets, energy-cost expectations, and policy timelines can push upgrades forward or delay them. Each scenario was anchored to a consistent set of drivers, and the final view was selected after checking whether it aligns with the ranges shared by interviewees on project pipelines and awarded contract timing.
Data Validation & Update Cycle
Validation was done by comparing the model totals against independent signals, such as the implied spend per lighting point, the pace of retrofit announcements, and the portion of smart deployments visible in awarded projects. When a country or year showed an unusual jump, we revisited the pricing curve, the assumed conversion rate, and any one-time contract effects, then rechecked them with additional expert follow-ups.
Before sign-off, the full dataset is reviewed in multiple steps so that inputs, formulas, and outputs reconcile cleanly across countries and time periods. Reports are refreshed annually, and interim updates are completed when there are material events like major regulation changes, procurement slowdowns, or large program launches. Right before delivery, a final analyst pass is completed so the client receives the most current update.
Mordor Intelligence's Europe Street Lighting Market Size Compared With Other Published Estimates
Published market sizes for Europe street lighting can look far apart because each publisher draws the market line differently and applies different timing and price assumptions. The biggest differences usually come from what is counted as street lighting spending, how smart controls and services are treated, and whether the numbers reflect awarded projects or broader planned budgets.
The main gap comes from whether smart lighting software and services are counted alongside hardware, where Mordor Intelligence includes these spend lines only when they are linked to street lighting deployments and active connectivity, rather than being treated as a general smart city software pool. Other gaps also come from how retrofit waves are timed, how fast LED adoption is assumed after policy changes, and how currency conversion timing is handled when national procurement spending is translated into USD.
Benchmark comparison
| Source | Market Size | Gaps in Research Methodology |
|---|---|---|
| Mordor Intelligence | USD 3.33 B (2025) | |
| Regional Consultancy A | USD 3.75 B (2026) | Often inflates totals by treating multi-year municipal program budgets as near-term revenue and by assuming higher smart-control penetration without tender-level checks, which can pull forward demand. |
| Trade Journal B | USD 2.90 B (2025) | Typically stays closer to luminaire-only hardware and may exclude controls software and ongoing services, and it can undercount retrofit replacements when secondary replacements are not tracked consistently. |
The spread in published figures is mainly explained by scope around smart controls and services, and by how retrofit timing is translated into annual spend. Our approach keeps the estimate traceable to repeatable inputs like retrofit share, LED and smart adoption, and realistic pricing steps that can be checked against disclosed activity and market feedback.


Key Questions Answered in the Report
How large is the Europe street lighting market today?
The sector generated USD 3.59 billion in 2026 and is projected to reach USD 5.09 billion by 2031.
What CAGR is forecast for European street lighting through 2031?
The market is expected to grow at a healthy 7.23% compound annual rate over 2026-2031.
Which segment is expanding fastest?
Software and services are projected to rise at 9.04% CAGR as cities adopt lighting-as-a-service models.
Why are smart platforms gaining share?
Falling connectivity costs, EU funding for smart-city pilots and new revenue from pole-mounted 5G small cells are driving adoption.
Which country will post the quickest growth?
Italy leads with a forecast 7.97% CAGR thanks to sizable PNRR mobility allocations and low prior LED penetration.
What is the main risk for municipalities deploying LEDs?
Premature driver failures under high heat conditions can raise lifecycle costs unless robust thermal management is specified.
Page last updated on:






