
Europe Solar Tracker Market Size and Share
Market Overview
| Study Period | 2021 - 2031 |
|---|---|
| Forecast Data Period | 2026 - 2031 |
| Base Year Market Size (2025) | USD 4.96 Billion |
| Market Size (2026) | USD 5.96 Billion |
| Market Size (2031) | USD 16.08 Billion |
| Growth Rate (2026 - 2031) | 21.95 % |
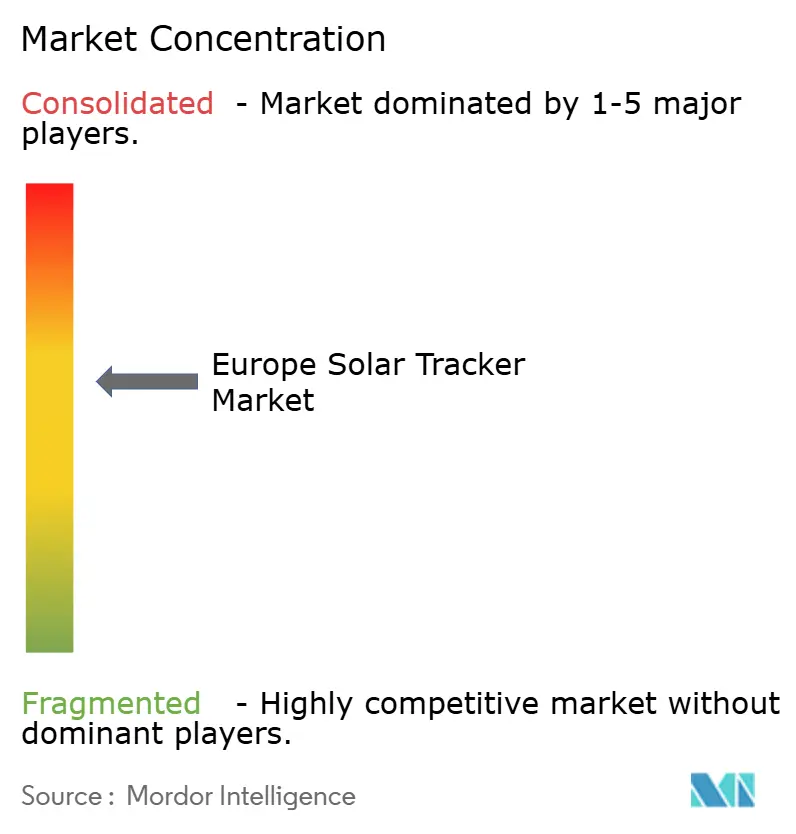
| Market Concentration | Medium |
Major Players *Disclaimer: Major Players sorted in no particular order Image © Mordor Intelligence. Reuse requires attribution under CC BY 4.0. | |
Europe Solar Tracker Market Analysis by Mordor Intelligence
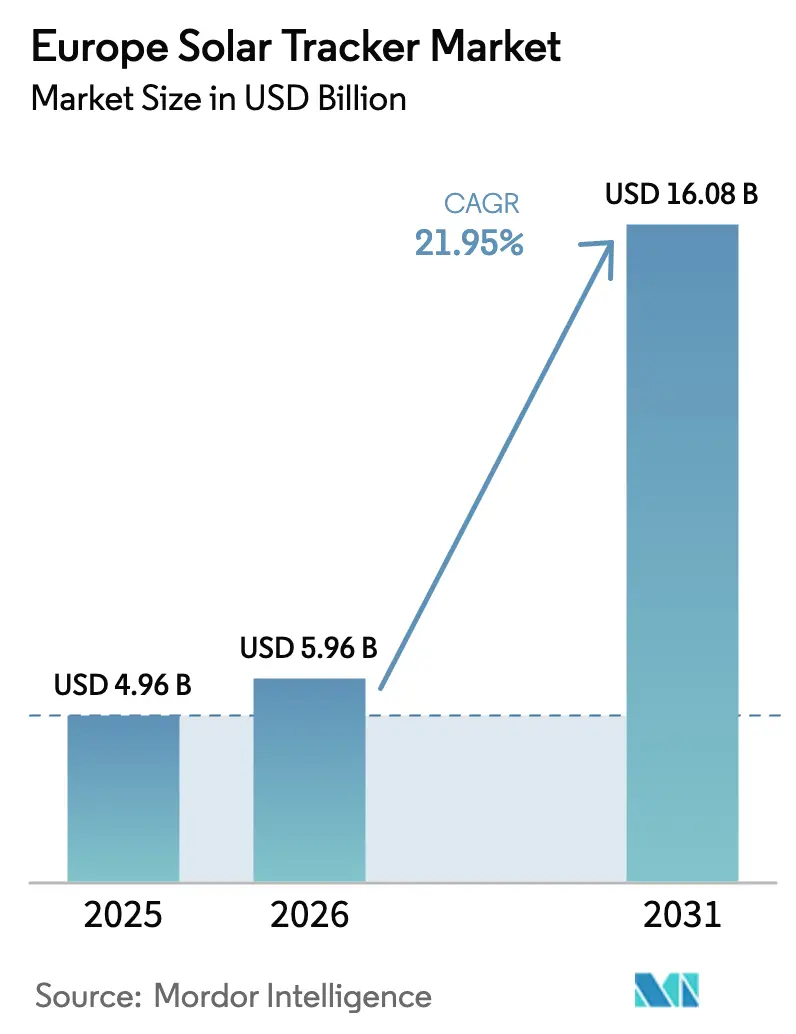
The Europe Solar Tracker Market size is projected to be USD 4.96 billion in 2025, USD 5.96 billion in 2026, and reach USD 16.08 billion by 2031, growing at a CAGR of 21.95% from 2026 to 2031.
Momentum is driven by the EU Net-Zero Industry Act’s 40% local-content mandate, rapid utility-scale build-outs under REPowerEU’s 700 GW solar objective, and technological shifts toward predictive-maintenance software that compresses operating costs. Single-axis designs remain the volume workhorse thanks to lower upfront outlays, yet dual-axis and terrain-adaptive models are scaling quickly in agrivoltaic and brownfield sites that fixed-tilt arrays cannot monetize. Supply-chain localization is accelerating: 38 European factories now provide 121 GWDC of annual tracker capacity, insulating the region from geopolitical disruptions and shortening logistics lead times. At the same time, curtailment incidents in Spain and Italy underscore the need for grid reinforcement and storage pairing to protect yield economics.
Key Report Takeaways
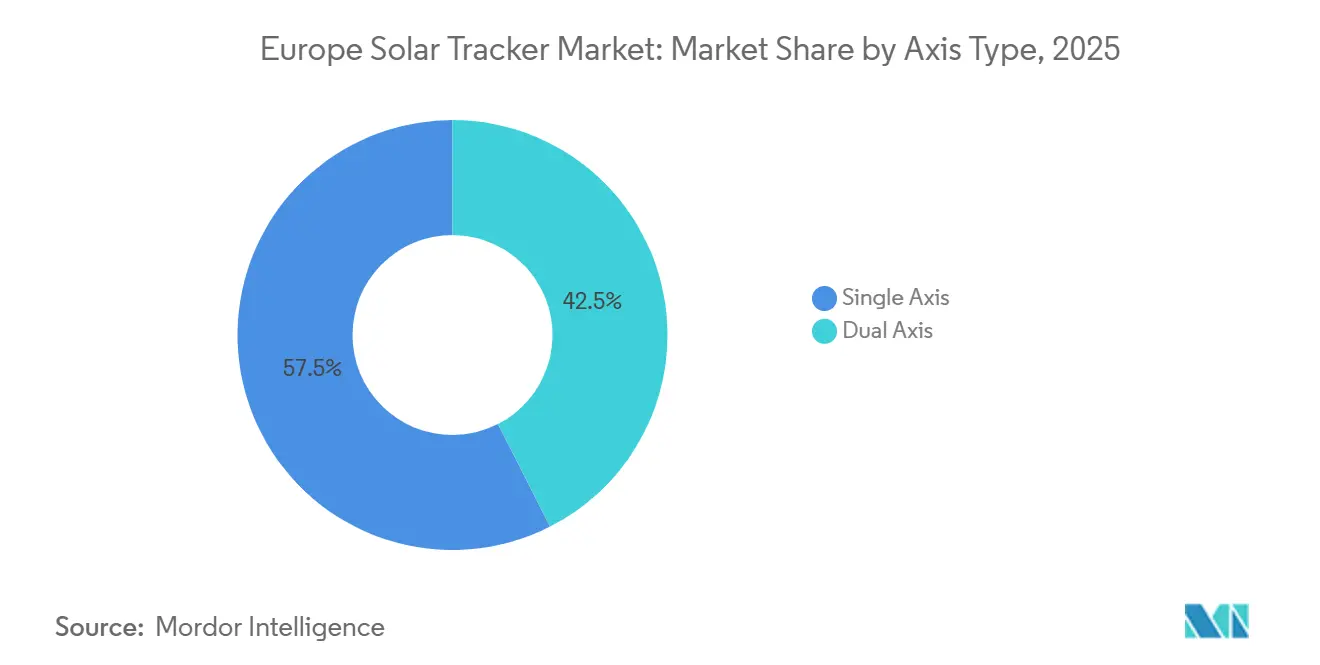
- By axis type, single-axis trackers held 57.5% of the European solar tracker market share in 2025. Dual-axis systems are forecast to record the fastest expansion, advancing at a 23.0% CAGR to 2031.
- By technology, photovoltaic trackers dominated with an 87.1% share in 2025, while CPV trackers are set to grow at a 27.1% CAGR through 2031.
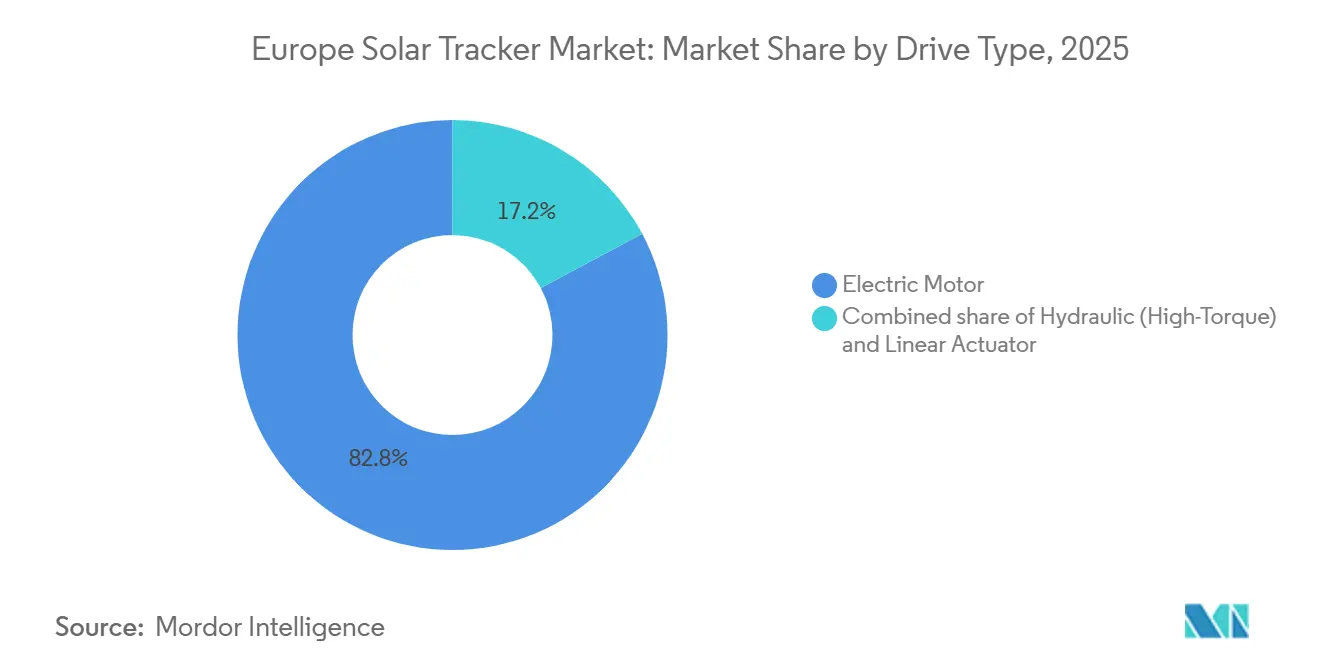
- By drive type, electric motor drives represented 82.8% of installations in 2025; hydraulic drives are expected to post a 23.9% CAGR to 2031.
- By application, utility-scale projects captured 83.3% of deployments in 2025, yet the commercial and industrial segment is projected to surge at a 23.2% CAGR through 2031.
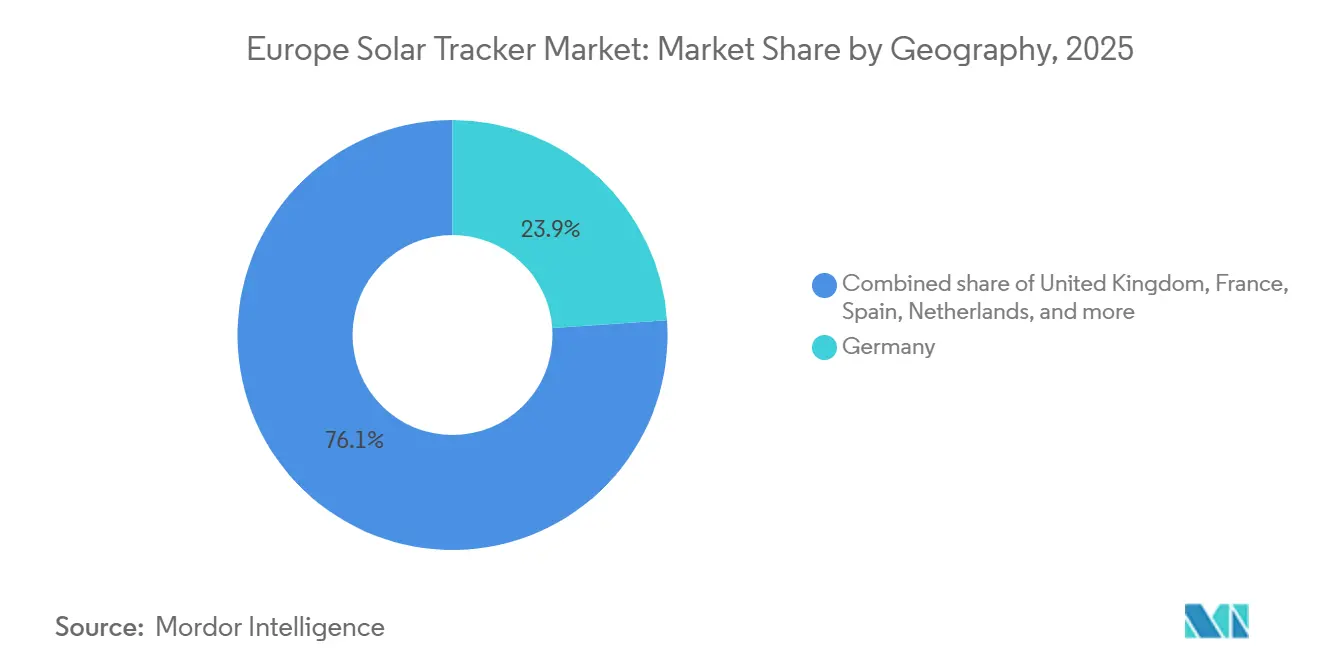
- By geography, Germany accounted for 23.9% of 2025 revenue, whereas Spain is projected to expand at a 26.5% CAGR and outpace all other geographies.
Note: Market size and forecast figures in this report are generated using Mordor Intelligence’s proprietary estimation framework, updated with the latest available data and insights as of January 2026.
Europe Solar Tracker Market Trends and Insights
Drivers Impact Analysis*
| Driver | (~) % Impact on CAGR Forecast | Geographic Relevance | Impact Timeline |
|---|---|---|---|
| Abundant solar irradiation across Southern Europe | +3.8% | Spain, Italy, Greece, Southern France | Long term (≥ 4 years) |
| EU Green Deal & REPowerEU solar targets | +5.2% | Pan-European, with concentration in Germany, Spain, Netherlands | Medium term (2-4 years) |
| Declining tracker hardware costs & improved reliability | +4.1% | Pan-European, strongest in utility-scale segments across Spain, Germany, Italy | Medium term (2-4 years) |
| Terrain-following trackers for agrivoltaics/brownfields | +2.9% | France, Italy, Germany (agrivoltaic zones), Spain (brownfield sites) | Long term (≥ 4 years) |
| AI-enabled predictive maintenance lowering LCOE | +3.4% | Pan-European, early adoption in Spain, Germany, UK | Medium term (2-4 years) |
| EU Net-Zero Industry Act incentives for local production | +4.6% | Pan-European manufacturing hubs (Spain, Germany, Italy, Netherlands) | Short term (≤ 2 years) |
| Source: Mordor Intelligence | |||
Abundant Solar Irradiation Across Southern Europe
Annual irradiation above 1,800 kWh/m² in Andalusia and Sicily lifts tracker energy yield 15-20% versus fixed-tilt and compresses payback to under two years.[1]Joint Research Centre, “Photovoltaic Geographical Information System,” jrc.ec.europa.eu Spain added 9.4 GW of new solar capacity in 2024, spearheaded by the 590 MW Francisco Pizarro plant that employs single-axis trackers to harvest peak summer output.[2]Iberdrola, “Francisco Pizarro 590 MW Plant Factsheet,” iberdrola.com Italy’s 5.3 GW of 2024 additions included multiple bifacial-with-tracker projects that maximize rear-side gain on light-colored soils. Greece is following suit: in June 2025, Nextracker won a 550 MW order for the Oricheio PPC Ptolemaida redevelopment, underscoring how trackers unlock value on reclaimed coal land. Northern Europe’s lower irradiation and heavier snow loads moderate this driver’s influence, but Southern Europe’s isolation edge remains a long-term growth pillar.
EU Green Deal & REPowerEU Solar Targets
REPowerEU raises the bloc’s cumulative solar objective to 700 GW by 2030, translating into an annual build-rate near 60 GW, double the 2023 pace.[3]SolarPower Europe, “EU Market Outlook 2024–2028,” solarpowereurope.org Permitting reforms in Germany trimmed approval cycles for >1 MW ground-mount arrays to nine months, unlocking sizable tracker-ready parcels. Spain cleared 3.8 GW of capacity in its June 2024 auction with winning bids averaging EUR 0.029/kWh, reinforcing trackers as the default choice to honor low-priced PPAs. France’s CRE-7 tender allocated 3.7 GW but still battles local opposition, illustrating divergent national execution speeds. Fast-track “renewable acceleration areas” mandated by the revised Renewable Energy Directive are expected to release fresh land banks by 2027, sustaining demand for tracker systems that can maximize energy density.
Declining Tracker Hardware Costs & Improved Reliability
Steel-optimization, large-format modules, and controller miniaturization collectively shaved 12-15% from tracker bill-of-materials between 2020 and 2024. Gross-margin expansion to 28.3% in Nextracker’s fiscal 2025 results signals the scale advantage enjoyed by leading vendors. Bifacial modules, forecast to comprise 60% of global shipments by 2026, further elevate tracker value by capturing 5-10% rear-side gain in high-albedo zones. Mean time between failures for electric drives now exceeds 25 years, lowering O&M reserves and improving bankability. Remaining volatility is tied to commodity cycles; 2024’s 8-12% spike in European hot-rolled coil prices temporarily offset these cost efficiencies but did not derail procurement plans.
Terrain-Following Trackers for Agrivoltaics/Brownfields
Italy’s EUR 1.1 billion agrivoltaic fund requires 70% of land to remain agriculturally productive, pushing developers toward variable-height, dual-axis systems that optimize both crop growth and solar output. Soltec’s June 2024 partnership with TSE deploys vineyard-specific trackers that regulate shading in tune with phenological cycles. TrinaTracker’s Vanguard line accommodates slopes up to 15° without extensive grading, unlocking brownfields and mine-reclamation sites. Aggregate agrivoltaic pipelines now exceed 2.5 GW across Germany, France, and Spain, with trackers specified in roughly two-thirds of announced tenders.
Restraints Impact Analysis*
| Restraint | (~) % Impact on CAGR Forecast | Geographic Relevance | Impact Timeline |
|---|---|---|---|
| High upfront CAPEX vs. fixed-tilt | -2.7% | Pan-European, most acute in price-sensitive markets (Poland, Romania, Balkans) | Short term (≤ 2 years) |
| Wind & snow-load engineering in Northern Europe | -1.4% | Nordic countries, Germany (northern regions), Netherlands, UK | Medium term (2-4 years) |
| Steel-price volatility inflating BoM costs | -2.1% | Pan-European, supply-chain exposure in Spain, Italy, Germany | Short term (≤ 2 years) |
| Grid-curtailment risk reducing yield economics | -1.9% | Spain, Italy, Greece (congested transmission zones) | Medium term (2-4 years) |
| Source: Mordor Intelligence | |||
High Upfront CAPEX vs. Fixed-Tilt
Single-axis trackers carry a 15-25% premium (USD 0.08-0.12/WDC) over fixed-tilt, extending payback by up to a year in lower-irradiation or higher-interest-rate markets.[4]International Renewable Energy Agency, “Utility-Scale Solar Cost Drivers 2025,” irena.org Polish and Romanian developers keep tracker penetration below 30% as they seek to minimize debt service costs. Germany’s rooftop-heavy market likewise favors simpler fixed systems. A monetary-policy pivot by the European Central Bank would soften this drag by lowering discount rates, but near-term headwinds persist.
Wind & Snow-Load Engineering in Northern Europe
Wind speeds above 25 m/s and snow loads exceeding 2.5 kN/m² in Scandinavia and the North Sea coast demand reinforced torque tubes, hydraulic brakes, and rapid stow protocols that add 10-15% to structural cost. Hydraulic drives meet these specifications yet are 20-30% more expensive than electric motors and require cold-weather fluids, capping adoption to sites where risk justifies the premium.
*Our forecasts treat driver/restraint impacts as directional, not additive. The impact forecasts reflect baseline growth, mix effects, and variable interactions.
Segment Analysis
By Axis Type: Dual-Axis Gains on Terrain Flexibility
Dual-axis installations captured 42.5% of incremental revenue in 2025 and are poised to rise at a 23.0% CAGR, outpacing the overall European solar tracker market by roughly 1 percentage point. Single-axis systems nonetheless dominate headline volumes because they cost 15-20% less and offer simpler maintenance protocols. Spain deployed single-axis trackers on roughly 70% of its 9.4 GW 2024 build, leveraging flat terrain and high irradiation. Italy’s agrivoltaic subsidies tilt the scales toward dual-axis, which can orient away from crops during sensitive growth stages.
Economies of scale still favor single-axis giants; Nextracker shipped 33.6 GW globally in fiscal 2025, while no dual-axis supplier breached 1 GW. Even so, terrain-adaptive hybrids are blurring classification: Greece’s 550 MW Ptolemaida rehabilitation relies on articulated single-axis rows that contour subsidence zones, capturing many benefits of dual-axis without incurring full incremental cost. In lower-irradiation geographies such as Northern Germany, developers continue to prioritize fixed-tilt or basic single-axis to protect return profiles.


By Technology: CPV Trackers Exploit Southern Europe’s DNI
Standard PV dominated with 87.1% share in 2025, yet CPV is projected to post a 27.1% CAGR through 2031 by monetizing Southern Europe’s >2,000 kWh/m² DNI corridors. CPV’s 30-35% module efficiency offsets its 40-50% CAPEX premium only in Spain, Greece, and parts of Italy. Iberdrola’s Francisco Pizarro plant illustrates how bifacial PV trackers capture 8-10% rear-side gain, crowding out CPV in many bids.
The European solar tracker market size for CPV remains below USD 0.5 billion, but early-stage pilots by research institutes and EPCs signal a niche future for ultra-high-efficiency arrays where land is scarce. CSP trackers, in contrast, remain sidelined because their USD 0.10-0.15/kWh LCOE cannot match PV-plus-storage. As CPV supply chains mature and standardization improves, dual-axis tracking precision will be indispensable, anchoring their future expansion.
By Drive Type: Hydraulic Systems Answer Nordic Demands
Electric drives accounted for 82.8% of 2025 shipments, reflecting unit costs near USD 200 per row and abundant component sourcing from Asian vendors. The European solar tracker market size for hydraulic configurations is smaller today but is growing briskly at a 23.9% CAGR through 2031 as wind-prone Nordic and North Sea projects demand fail-safe stow and high torque.
Cold-weather innovations are easing adoption barriers: bio-based hydraulic fluids maintain viscosity to -40 °C, and sealed systems reduce maintenance overhead. Spain and Portugal continue to favor electric drives because design wind speeds rarely exceed 20 m/s. In agrivoltaic zones, linear electric actuators that simultaneously modulate height and tilt are becoming standard, illustrating how application demands rather than geography alone shape drive-type choice.
By Application: C&I Trackers Ride Corporate PPA Wave
Utility-scale projects still accounted for 83.3% of 2025 revenue, yet the commercial and industrial sub-segment is on track to expand at 23.2% CAGR as EU climate policy compels large consumers to procure on-site renewables. The European solar tracker market size for C&I applications remains modest but is closing the gap as third-party ownership models offload capital from corporate balance sheets.
Tracker suppliers report that C&I represented 12-15% of their European shipments in fiscal 2025, up from the single-digit share seen two years earlier. Agrivoltaic hybrids straddle utility and C&I distinctions; many Italian vineyard projects fall into this category, coupling power sales with agricultural resilience. Financing hurdles persist for <10 MW arrays, but standard-form corporate PPAs and bundled storage offerings are unlocking new demand pockets.
Geography Analysis
Spain leads growth with a 26.5% CAGR forecast as its 3.8 GW auction pipeline converges with abundant irradiation. Germany retained 23.9% of 2025 revenue, aided by Solar-Package permitting reforms that shaved bureaucracy for ground-mount assets. Italy’s EUR 1.1 billion agrivoltaic incentives make it the top adopter of dual-axis systems among major markets.
France delivered 3.7 GW in 2024 but continues to battle protracted local-consultation requirements that elongate build timelines. The United Kingdom, Netherlands, and Nordic countries together added nearly 7 GW in 2024, yet keep tracker penetration below 25% because of wind engineering and planning constraints. Greece’s brownfield conversions, such as the 550 MW Ptolemaida plant, showcase how terrain-adaptive trackers open new geographic niches.
Rest-of-Europe markets, Portugal, Poland, Romania, and the Western Balkans, registered 4.2 GW of combined capacity in 2024. Price sensitivity and limited project-finance depth cap tracker uptake, but EU cohesion funds and cross-border PPA frameworks are gradually improving bankability. Grid reinforcement remains imperative: Spain’s EUR 6.5 billion upgrade plan and Italy’s 400 kV extensions are essential to translate theoretical yield gains into realizable revenue.
Regulatory Landscape
The European solar tracker market operates within the EU policy stack that accelerates permitting and emphasizes manufacturing resilience for clean-tech supply chains. Renewable Energy Directive III (Directive 2023/2413) required transposition by 21 May 2025, strengthening member-state obligations around renewable deployment and supporting faster siting under the updated permitting framework. Alongside this, the European Commission has continued to frame solar as a core REPowerEU pillar, while the EU Net-Zero Industry Act has shifted industrial-policy attention toward local manufacturing and strategic project designation, reinforcing the market move toward Europe-based tracker supply.
Trade policy also increasingly shapes tracker bills of materials and procurement decisions. The Carbon Border Adjustment Mechanism (CBAM) moved into its full financial obligation phase on 1 January 2026, which raises the value of traceable, compliant sourcing for emissions-intensive inputs such as steel used in tracker structures. Tender specifications commonly draw on European structural and cybersecurity requirements, including EN 1090 for structural steel and IEC 62443 for industrial cybersecurity in control systems, which can lift qualification thresholds for tracker suppliers serving utility-scale and public-procurement-linked projects.
Competitive Landscape
The European solar tracker market is moderately concentrated. Global majors such as Nextracker, Array Technologies, and GameChange ship more than half of the worldwide volume, yet regional champions like Soltec and Gonvarri Solar Steel capture a meaningful share in Southern Europe owing to localization advantages. The February 2025 merger of Kinematics with Spain’s P4Q created the world’s largest motion-control supplier, securing 134 GW of installed tracker capacity under unified diagnostics software.
Strategic themes cluster around reshored manufacturing, AI-enabled yield optimization, and agrivoltaic specialization. Soltec inaugurated an additional Spanish plant in 2024, while TrinaTracker’s Viana facility reached 8 GW nameplate capacity. Proprietary software is the new battleground: TrueCapture, SmarTrack, and Kinematics' forthcoming algorithms leverage vast performance datasets to cut outages and insurance premiums.
White-space opportunities include retrofitting pre-2015 fixed-tilt parks across Spain and Italy, an addressable 15-20 GW, and hybridizing PV with storage to mitigate curtailment. Barriers to entry are rising: EN 1090 structural-steel and IEC 62443 cybersecurity certificates are now standard tender prerequisites, disadvantaging low-cost importers lacking European compliance pedigrees. Steel-price hedging and local mill ownership further differentiate vertically integrated incumbents from component assemblers that rely on spot procurement.
Europe Solar Tracker Industry Leaders
PV Hardware (PVH)
Soltec Power Holdings SA
Nextracker Inc.
Arctech Solar Holding Co. Ltd.
Array Technologies Inc.
- *Disclaimer: Major Players sorted in no particular order

Market Opportunities and Future Outlook
Near-term demand is most evident in utility-scale pipelines and repowering activity, where trackers translate land and grid access into higher energy yield. Spain and Italy anchor the current evidence base, with Spain adding 9.4 GW of new solar capacity in 2024 and clearing 3.8 GW in its June 2024 auction, while curtailment incidents in Iberia and parts of Italy are pushing developers toward configurations that protect merchant value through stronger generation profiles and pairing strategies. Trackers that include advanced controls and performance software (including predictive maintenance and row-level optimization) are also being specified to reduce downtime and stabilize output under tighter PPA pricing.
Agrivoltaics and brownfield redevelopment are a second opportunity set where terrain-adaptive and higher-clearance designs help developers monetize sites that fixed-tilt systems do not. Italy’s EUR 1.1 billion agrivoltaic fund, with requirements to keep land agriculturally productive, has created a defined tender pathway for variable-height designs and, in some cases, dual-axis solutions. Project awards in Southern Europe also point to continued supplier investment in localized offerings, including Nextracker’s 550 MW order for the Oricheio PPC Ptolemaida redevelopment in Greece (June 2025) and Arctech’s tracker-supplied projects in Sardinia, Italy (including a 45 MW plant completed in 2026), which target reclaimed land and island grids with site-specific tracker engineering and localized commercial footprints.
Recent Industry Developments
- June 2026: The AGM marks the consolidation of Soltec's transition into a technology company focused on solar trackers. The shift strengthens Soltec's technology credentials and supports broader uptake of tracker solutions in Europe.
- June 2026: Nextpower launched the NX Gemini two-in-portrait (2P) solar tracker and NX Anchor foundation system to support diverse geotechnical conditions across European markets. The product expansion in 2P trackers broadens Nextpower's offering in Europe and diversifies geotechnical capability, supporting agriPV and diverse sites.
- April 2026: PV Hardware (PVH) provided AxoneDuo INFINITY solar trackers for an 84 MW solar project in Spain. The deployment highlights project-scale execution and Europe-ready tracker capability.


Research Methodology Framework and Report Scope
Market Definition and Coverage
For this methodology, the market covers revenue generated from solar tracker systems used to orient PV or concentrated solar installations toward the sun across Europe, counted where the tracker is specified for a project and delivered into the region.
Scope exclusions: We exclude fixed-tilt mounting structures and general balance-of-system items that are not specific to tracking functionality.
Segmentation Overview
- By Axis Type
- Single Axis
- Dual Axis
- By Technology
- Photovoltaic (PV)
- Concentrated Solar Power (CSP)
- Concentrated Photovoltaic (CPV)
- By Drive Type
- Electric Motor
- Linear Actuator
- Hydraulic
- By Application
- Utility-Scale
- Commercial and Industrial (CandI)
- Residential and Micro-grid
- Agrivoltaics/Agri-solar
- By Geography
- United Kingdom
- Germany
- France
- Italy
- Spain
- NORDIC Countries
- Netherlands
- Russia
- Rest of Europe
Data Sources, Market Sizing, and Validation
Desk Research
Desk research was first used to frame the European demand pool and to keep the market model tied to observable build activity. We relied on public energy and deployment statistics, plus policy and auction context, from sources such as Eurostat, the European Commission energy publications, national grid and energy regulator releases, and International Energy Agency datasets.
We then reviewed project pipelines and tracker adoption signals using sources such as transmission operator updates, tender and contract announcements, company annual reports and investor presentations, and credible trade press coverage. Where it helped with consistency checks, we also used paid subscriptions for company financials and intelligence, patent databases, and global contracts and tenders tracking. The sources listed here are illustrative only, and additional references were used for data collection, validation, and clarification during the research process.
Primary Interviews and Surveys
Primary work centered on interviews and surveys with EPC-facing stakeholders, component and subsystem participants, and project developers active in utility-scale and commercial installations across key European solar markets. The discussions focused on tracker attach rates by project type, typical pricing and warranty expectations, and near-term constraints such as permitting pace and delivery lead times, which were then used to confirm and adjust desk-based assumptions.
Distribution of primary research fieldwork respondents
| Company type | Respondent position |
|---|---|
| Top tier: 35% | CXOs: 15% |
| Mid tier: 43% | Functional/Unit leaders: 33% |
| Smaller Players: 22% | Managers: 52% |
Market-Sizing & Forecasting
Sizing started with a top-down reconstruction of tracker demand by linking annual solar build activity in Europe to tracker penetration by application, then converting the results into value using typical system pricing. To keep the totals grounded, we cross-checked them with selective bottom-up approximations such as sampled project bills of materials, channel checks on tracker shipments into Europe, and a price times volume sanity check for high-activity countries.
Key inputs used in the model include utility-scale solar capacity additions, the mix of ground-mount versus other deployment types, tracker adoption rates by site type (including agrivoltaic builds), typical tracker pricing per installed capacity, and the share split between single-axis and dual-axis systems. We also tracked variables that affect buying behavior, such as permitting timelines, steel and actuator cost movement, and the share of projects using bifacial modules where tracking can be more attractive.
Forecasting used scenario analysis supported by primary feedback, with a base case reflecting expected solar build-out and tracker attach rates by country group. Where bottom-up detail was missing for smaller markets, we used proxy ratios from similar countries and adjusted them based on grid connection activity and known project announcements.
Data Validation & Update Cycle
Outputs are validated through triangulation across independent signals, including installation activity, country pipeline visibility, and price benchmarks gathered during interviews. Variance checks are run at country and application levels, and outliers are reviewed in a second analyst pass before final sign-off.
The model is refreshed annually so assumptions like attach rates and pricing stay current, and interim updates are triggered when material policy changes, major award cycles, or supply disruptions shift the near-term outlook. Before delivery, a final review is completed so clients receive the latest updated view aligned to the most recent public releases and interview feedback.
Mordor Intelligence's Europe Solar Tracker Market Size Versus Other Published Estimates
Published market numbers for Europe solar trackers can look far apart because each estimate picks its own definition of what a tracker includes, how far the geography runs, and which year of pricing it assumes. Differences also show up when one model relies mainly on announcements, while another ties value to installed capacity and realistic attach rates.
The main gap comes from whether tracker revenues are counted only for large utility projects or also for commercial sites and emerging uses like agrivoltaics. Mordor Intelligence counts agrivoltaics when trackers are actually specified for European installations, then prices them using country-level assumptions that get re-checked through interviews. Another common driver is the axis and technology mix, since single-axis versus dual-axis and PV versus CSP-linked trackers can carry different price points, and some published figures apply one blended price across all countries.
Benchmark comparison
| Source | Market Size | Gaps in Research Methodology |
|---|---|---|
| Mordor Intelligence | USD 4.96 B (2025) | |
| Regional Consultancy A | USD 2.21 B (2024) | Uses a shorter historical lens and often centers on utility-scale builds, which can undercount commercial and agrivoltaic tracker demand, and it may apply older pricing before recent cost and specification shifts. |
| Trade Journal B | USD 2.23 B (2024) | Typically reports a narrower definition (tracker systems grouped as tracking solutions), with limited visibility on country mix and axis split, which can compress value when a single average price is assumed. |
The table shows that most of the spread can be traced back to what project types are included and how pricing is carried into the base year. By keeping attach rates, axis mix, and country pricing checks explicit, the estimate stays easier to audit and repeat when new build data and policy signals change.


Key Questions Answered in the Report
How large is the Europe solar tracker market in 2026 and how fast is it growing?
The market is valued at USD 5.96 billion in 2026 and is expanding at 21.95% CAGR toward USD 16.08 billion by 2031.
Which axis type is gaining share most quickly?
Dual-axis systems are rising fastest, projected to grow at a 23.0% CAGR by unlocking agrivoltaic and irregular-terrain sites.
Why are hydraulic drives relevant for Northern Europe?
High wind speeds and heavy snow loads demand torque and passive safety features that hydraulic actuators deliver more reliably than electric motors.
What policy initiatives support local tracker manufacturing?
The 2024 Net-Zero Industry Act requires 40% EU content for strategic clean-tech components and has already triggered 121 GWDC of annual European tracker manufacturing capacity.
How does grid curtailment affect tracker economics in Spain and Italy?
Curtailment events trim 5-8% of potential revenue by forcing midday output reductions, reducing the payback advantage trackers normally provide.
What growth opportunities exist beyond new-build projects?
Retrofitting pre-2015 fixed-tilt parks and pairing trackers with battery storage can boost internal rates of return by up to two percentage points.
Page last updated on:


 Your data is secure and never sold or shared.


