
Market Overview
| Study Period | 2020 - 2031 |
|---|---|
| Forecast Data Period | 2026 - 2031 |
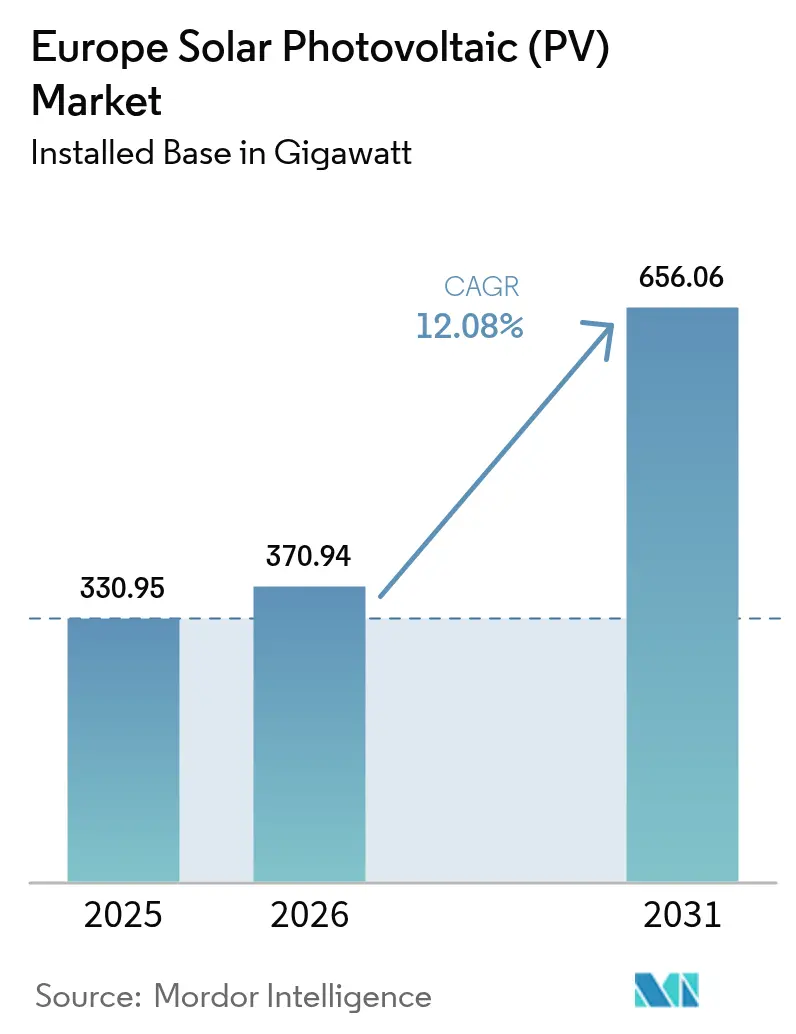
| Base Year Market Size (2025) | 330.95 gigawatt |
| Market Volume (2026) | 370.94 gigawatt |
| Market Volume (2031) | 656.06 gigawatt |
| Growth Rate (2026 - 2031) | 12.08 % |
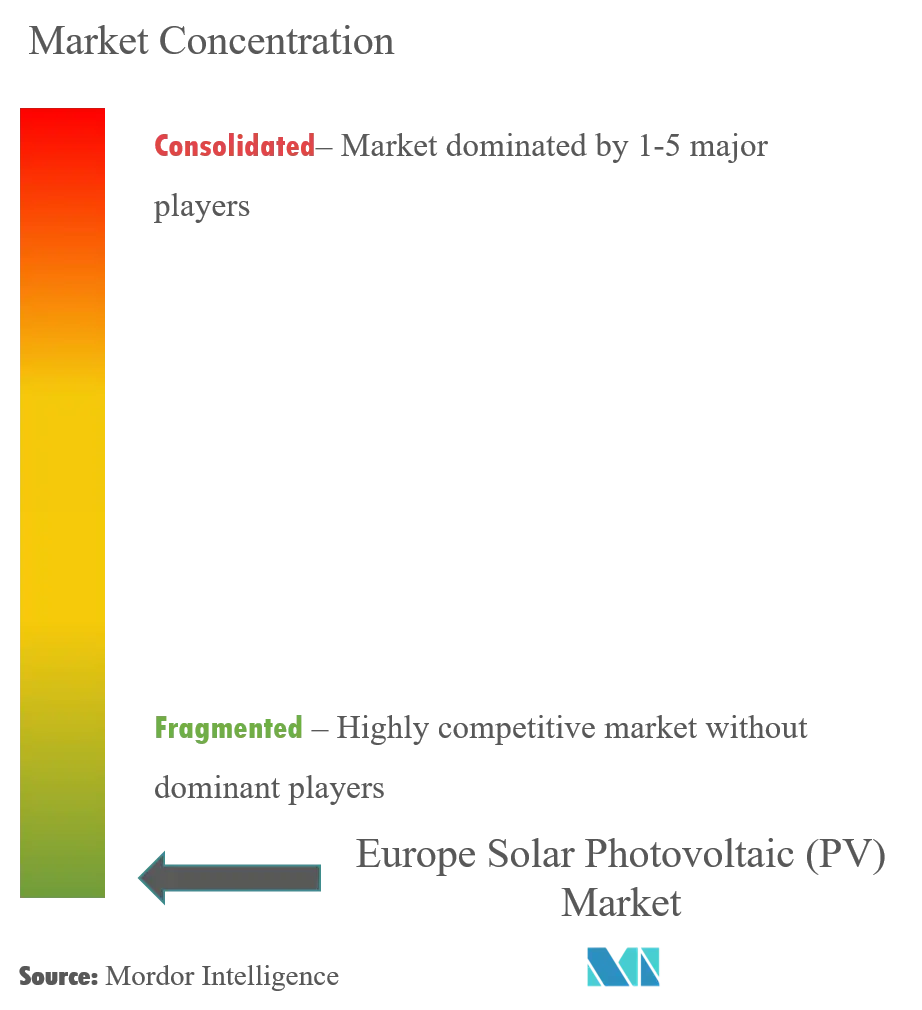
| Market Concentration | Low |
Major Players *Disclaimer: Major Players sorted in no particular order Image © Mordor Intelligence. Reuse requires attribution under CC BY 4.0. | |
Europe Solar Photovoltaic (PV) Market Analysis by Mordor Intelligence
Europe Solar Photovoltaic (PV) Market size in 2026 is estimated at 370.94 gigawatt, growing from 2025 value of 330.95 gigawatt with 2031 projections showing 656.06 gigawatt, growing at 12.08% CAGR over 2026-2031.
- Over the medium term, factors such as rising demand for electricity across the region, increasing investments in solar energy projects, and producing most of the electricity from renewable sources have driven the growth of the market.
- On the other hand, the rising emphasis on natural gas power generation and the availability of natural gas at lower prices for power generation restrain the market growth in the European region.
- However, the ambitious solar energy targets implemented to boost solar PV installation are expected to create lucrative opportunities for the market during the forecast period.
- Germany, with the largest installed capacity of solar photovoltaics, is expected to dominate the European solar photovoltaics (PV) market during the forecast period.
Note: Market size and forecast figures in this report are generated using Mordor Intelligence’s proprietary estimation framework, updated with the latest available data and insights as of 2026.
Europe Solar Photovoltaic (PV) Market Trends and Insights
The Rooftop Segment Anticipated to Witness Significant Market Growth
- The rooftop segment is estimated to witness significant growth during the forecast period in Europe. The European region's rooftop installation has lots of potential as most of Europe's roof surfaces are unused. Several countries in Europe are working on modifying their policies to assess remuneration levels.
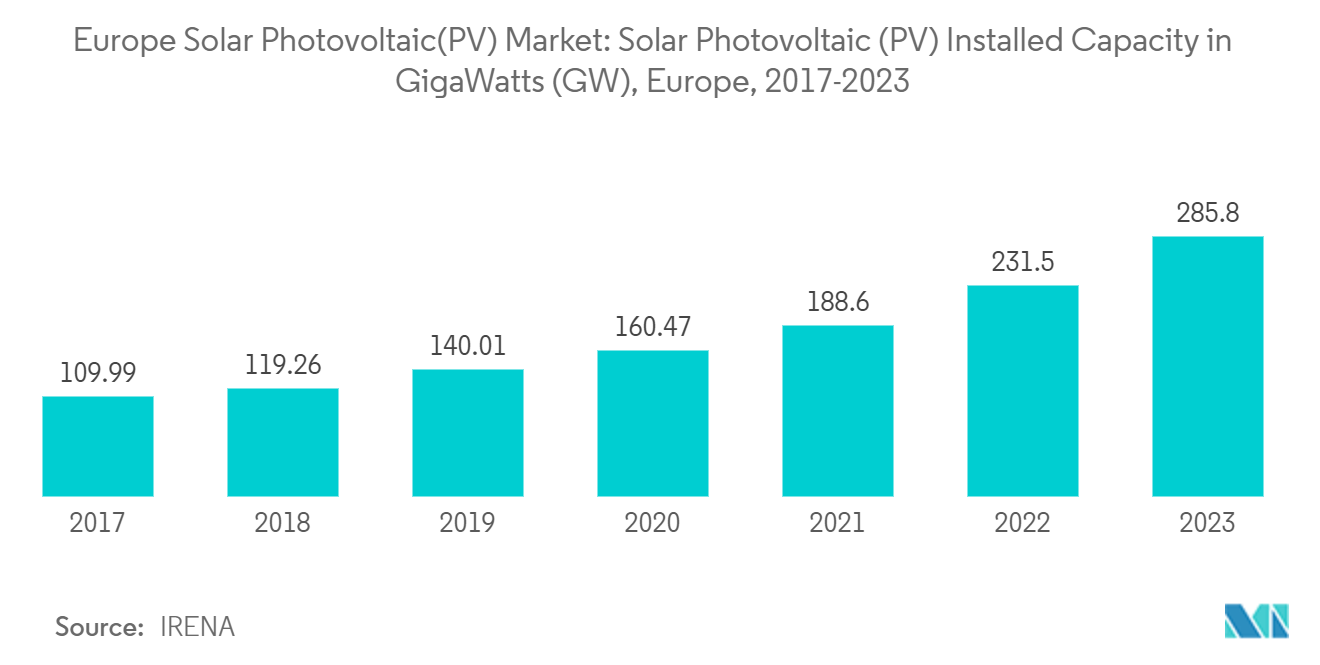
- Norway, the Baltic region, Ireland, and others have geographical conditions favorable to rooftop PV installation. This is expected to increase rooftop solar PV installation in Europe during the forecast period. Also, in several countries, homeowners are willing to install rooftop PV modules to reduce their electricity bills. According to the International Renewable Energy Agency (IRENA), in 2023, Europe's solar PV installed reached 285.80 GW, with a growth rate of 23.45% over the previous year.
- In December 2023, the European Parliament and the European Council reached an interim agreement on the strengthened Energy Performance of Buildings Directive (EPBD), aspiring to stimulate the energy performance of buildings and requiring new buildings to be solar-ready. The EPBD also mandates that EU member states ensure new buildings are fit to host rooftop solar PV or thermal installations. Existing public and non-residential building solar will require to be installed commencing from 2027.
- Governments in several countries have adopted supportive policies to increase the deployment of rooftop PV arrays within the region. For instance, in March 2023, the European government adopted the revised Energy Performance of Business Directive mandating rooftop solar systems for all new buildings by 2028 and renovating residential buildings by 2032.
- In 2023, Germany achieved a milestone by installing a record 14GW of solar energy capacity, facilitated by adding over a million new solar power systems, a significant portion of which were residential rooftop installations. This surge reflects an impressive 85% increase in capacity compared to the previous year, as the German Solar Association (BSW) reported. The surge in capacity was primarily fueled by residential demand, particularly for rooftop solar power systems. The BSW noted a substantial increase, with 159,000 PV systems operational in the first quarter of 2023, more than double the number recorded during the same period in 2022.
- Therefore, from the above points, the rooftop solar photovoltaic segment is anticipated to witness significant growth in the European solar photovoltaic market during the forecast period.
Germany Expected to Dominate the Market
- Germany is one of the most lucrative markets in the European region for renewable energy production, including solar. The country has experienced significant developments in solar PV installation due to its target of reducing carbon emissions, and it is likely to continue witnessing growth in solar installation.
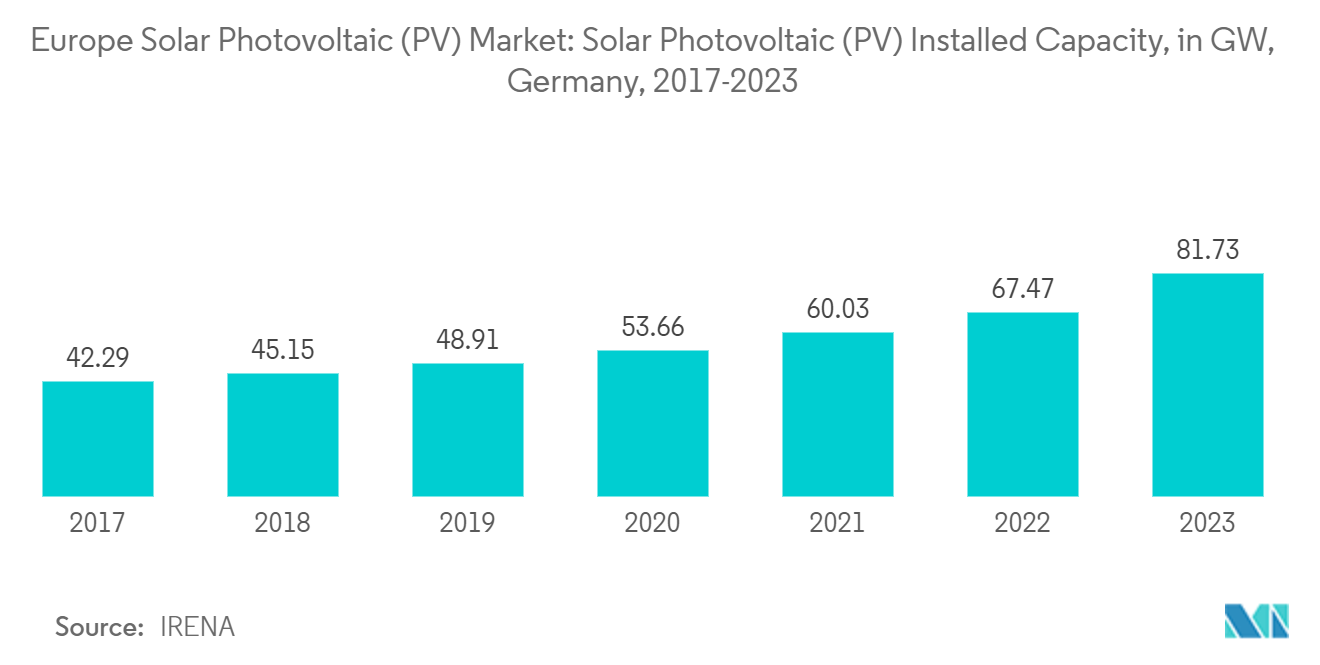
- The country's solar PV installed capacity has witnessed massive growth in recent years. In 2023, the installed solar PV was around 81.73 GW compared to 67.47 GW in 2022, registering a CAGR of over 21%, signifying the country's growing penetration of solar PV systems.
- The country has implemented several regulations and incentive schemes to promote the installation of solar modules in cities. In June 2023, Germany’s economy ministry announced new government funding to rebuild the country’s solar industry. The economy ministry is expected to present the new funding instrument soon and is preparing a tender in line with a new EU subsidy framework in the future.
- The mandates for solar photovoltaic installation on new buildings in a few German cities have helped expand the market in Germany. In December 2022, the European Union approved a EUR 28 billion German renewable energy scheme. The policy aims to increase the use of renewables, including solar power rapidly. It is designed to deliver Germany's target of producing 80% of its electricity from renewable sources by 2030.
- Therefore, based on the above points, solar photovoltaic in Germany will dominate the European solar photovoltaic market during the forecast period.
Regulatory Landscape
At the EU level, solar PV deployment and manufacturing are increasingly shaped by binding legislation and procurement rules, alongside voluntary coordination mechanisms. The Net-Zero Industry Act (Regulation (EU) 2024/1735) sets an EU target of 30 GW of operational solar PV manufacturing capacity by 2030, while the European Solar Charter (signed on 15 April 2024 by 23 EU countries) promotes earlier use of resilience-oriented procurement approaches to support domestic PV manufacturing.
On the demand side, the recast Energy Performance of Buildings Directive (Directive (EU) 2024/1275) creates a building-compliance pull for rooftop solar. It requires Member States to ensure solar installations on all new public and non-residential buildings larger than 50 m2 by 31 December 2026. For utility-scale procurement, Commission Implementing Regulation (EU) 2025/1176 requires Member States to apply non-price criteria to at least 30% of the yearly auctioned renewable energy volume, adding resilience, sustainability, and cybersecurity factors into solar auction and tender design.
Value Chain Analysis
The Europe solar PV value chain covers upstream materials and components (polysilicon, ingots/wafers, cells, glass, encapsulants, backsheets), module assembly, and balance of system (inverters, mounting structures/trackers, cables). Downstream, it runs through development, EPC, grid connection, and O&M across residential, C&I, and utility-scale deployments. Domestic manufacturing strength is clearer in selected segments, with inverter manufacturing capacity cited at nearly 70 GW annually and polysilicon capacity above 23 GW, while cells, wafers, and modules remain tighter versus installation demand.
Cost and supply concentration continue to shape sourcing decisions across the chain. Imported Chinese components are cited as accounting for roughly 81-93% of European supply in key PV hardware, and comparisons show utility-scale systems using EU-made solar cells at around USD 0.608/W versus about USD 0.50/W for Chinese-made systems, widening the competitiveness gap for locally produced inputs. Execution on the downstream side is also affected by non-hardware bottlenecks, particularly grid capacity availability and permitting timelines, which can delay energization even after equipment is secured.
Competitive Landscape
The European solar photovoltaic (PV) market is fragmented. Some of the major companies in the market (in no particular order) include Hanwha Q CELLS Technology Co. Ltd, Iberdrola SA, SunPower Corporation, JinkoSolar Holding Co. Ltd, and Lightsource BP Renewable Energy Investments Limited.
Europe Solar Photovoltaic (PV) Industry Leaders
-
Lightsource BP Renewable Energy Investments Limited
-
Hanwha Q CELLS Technology Co., Ltd
-
SunPower Corporation
-
Iberdrola, S.A
-
JinkoSolar Holding Co., Ltd
- *Disclaimer: Major Players sorted in no particular order
Market Opportunities and Future Outlook
EU policy and compliance mechanisms create a clearer path for rooftop and public or commercial building solar. The recast Energy Performance of Buildings Directive (Directive (EU) 2024/1275) requires Member States to ensure solar installations on all new public and non-residential buildings larger than 50 m2 by 31 December 2026. This shifts part of PV demand away from purely economics-driven adoption toward building-code compliance, supporting activity across rooftop engineering, permitting, installation services, and building-integrated electrical upgrades.
Large-scale project pipelines and hybridization add another opportunity layer, particularly where developers pair PV with storage or focus on grid-accessible nodes. Examples in 2026 include Enery starting construction of the 761 MWp Ogrezeni hybrid PV-battery project in Romania, and Plenitude bringing the full 330 MW Renopool project online in Spain (with the final 200 MW block commissioned in June 2026). On the investment side, the Net-Zero Industry Act framework and the European Solar Charter (15 April 2024) support cases for European manufacturing and supply-chain localization, while auctions that incorporate non-price criteria under Commission Implementing Regulation (EU) 2025/1176 can improve bankability for projects using resilient and sustainable supply chains.
Recent Industry Developments
- July 2026: Lightsource bp secured planning approval for the 102 MW Straboe Solar and Energy Storage Project in County Carlow, Ireland, including a 60 MW battery energy storage system. The approval advances a hybrid PV-plus-storage buildout model that addresses grid flexibility needs and helps developers diversify revenue and dispatch capability beyond standalone solar generation.
- November 2025: Lightsource bp began construction on the 330 MWp Valle 3 and 4 solar cluster in Wamba, Valladolid, Spain, including an agrivoltaic pilot facility. The project adds scale in a core European solar market while testing land-use and permitting-friendly configurations that can be replicated across large ground-mounted portfolios.
- January 2025: Lightsource bp completed the sale of the 130 MW ready-to-build Cibele solar park in Portugal to Exus Renewables. The transaction highlights active secondary-market liquidity for late-stage PV assets, enabling developers to recycle capital into new project pipelines while allowing buyers to accelerate capacity additions through ready-to-build acquisitions.
Research Methodology Framework and Report Scope
Market Definition and Coverage
For this methodology, the Europe solar photovoltaic market is defined as grid connected PV capacity installed and operating across European countries, measured in gigawatts (GW) and tracked across new additions and the cumulative installed base.
Scope exclusions: This sizing does not treat PV as a revenue market, and it excludes non-PV generation technologies and purely off-grid systems where they are not captured in national grid statistics.
Segmentation Overview
- Type
- Thin Film
- Crystalline Silicon
- End User
- Residential
- Commercial and Industrial (including SMEs)
- Deployment
- Ground-Mounted
- Rooftop Solar
- Geography Regional Market Analysis {Market Size and Demand Forecast till 2029 (for regions only)}
- Germany
- United Kingdom
- France
- Italy
- Spain
- Netherlands
- Belgium
- Nordic
- Turkey
- Rest of Europe
Data Sources, Market Sizing, and Validation
Desk Research
Desk research sets the factual base for the model and keeps country level estimates consistent. We rely on public energy statistics and policy trackers such as Eurostat, the European Commission energy and climate publications, the IEA PVPS program outputs, IRENA renewable capacity series, and national transmission system operator dashboards where available.
To translate these signals into a workable market view, we also review grid connection and permitting updates from regulators, customs and trade releases where equipment flows explain short term swings, and technical publications and peer reviewed papers that clarify DC versus AC reporting. Company filings, investor presentations, and reputable press are used to cross check installation pipelines and commissioning timing. A paid subscription focused on company financials and patent databases is used selectively to validate supply and technology direction. The sources listed here are illustrative only, and many other public documents were also used for data collection, cross checking, and clarification.
Primary Interviews and Surveys
Primary work is used to confirm what the numbers mean in practice and to close gaps that public datasets do not explain well. We speak with installers and EPC firms, developers and asset owners, component distributors, and policy and grid stakeholders across major European markets. This helps align assumptions on commissioning lags, repowering, and rooftop versus ground mounted mix.
Respondent input is also used to sanity check country pipelines, typical project sizes, and how fast capacity moves from awarded to connected. This then tightens the forecast range we present.
Distribution of primary research fieldwork respondents
| Company type | Respondent position |
|---|---|
| Top tier: 34% | CXOs: 14% |
| Mid tier: 52% | Functional/Unit leaders: 32% |
| Smaller Players: 14% | Managers: 54% |
Market-Sizing & Forecasting
Sizing starts from a top down reconstruction of installed PV capacity by country, using official capacity series and grid connection signals to separate the cumulative base from annual additions. We then corroborate the totals through selective bottom up approximations, where sampled project counts, typical system size ranges, and installer throughput checks are used to adjust years that show reporting breaks.
Inputs used in the model include annual commissioned capacity (GW), cumulative installed base (GW), rooftop versus ground mounted split, country level policy milestones that change demand pull, and grid and permitting constraints that shift commissioning into later quarters. Where country reporting differs on DC versus AC, unit treatment is kept consistent year to year and corrected using technical conversion guidance and interview feedback.
Forecasting is built using scenario analysis. Here, country policy direction, grid readiness, and project pipeline maturity are translated into realistic annual additions, then rolled up to Europe. If bottom up checks are incomplete for smaller markets, gaps are handled by applying country specific adoption rates and historical variance bands, and then re tested against the regional total.
Data Validation & Update Cycle
Model outputs are validated through triangulation across independent signals, including official capacity series, grid connection updates, and pipeline announcements that can be checked publicly. When a country shows a sudden jump or dip, the driver is traced before sign off. Follow up calls are triggered if the cause looks like a definition change or a reporting delay.
Each estimate goes through a multi step analyst review where inputs, formulas, and unit consistency are rechecked, followed by a final variance scan against prior year patterns and peer country behavior. Reports are refreshed annually, with interim updates when material policy changes or installation shocks occur. Before delivery, we do a fresh pass so clients receive the latest updated view.
Mordor Intelligence's Europe Solar Photovoltaic Market Sizing Compared With Other Published Estimates
Published estimates for Europe solar PV often diverge because the market is sometimes treated as dollars for equipment sales, and other times as gigawatts of installed capacity. That creates a different answer even before forecasting begins. Differences also come from whether the number is EU only or broader Europe, and whether DC and AC capacity are mixed.
The main gap comes from mixing hardware revenue with installed capacity, where Mordor Intelligence keeps the market strictly in GW of operating PV capacity and aligns country totals using official capacity series plus grid connection timing checks.
Benchmark comparison
| Source | Market Size | Gaps in Research Methodology |
|---|---|---|
| Mordor Intelligence | USD 330.95 B (2025) | |
| Industry Association A | USD 338.00 B (2024) | Uses EU fleet capacity only and reports in GWdc, so the geography and unit basis differ from a broader Europe roll up. |
| Trade Journal B | USD 65.50 B (2024) | Reports annual new installations instead of the installed base, which compresses the number and shifts it to a flow metric. |
The spread in the table is mainly explained by whether the figure represents annual additions versus the installed base, and whether coverage is EU only or pan Europe. By keeping the unit logic consistent across countries and tying adjustments to observable commissioning and reporting behavior, the resulting market size stays traceable and repeatable year to year.
Key Questions Answered in the Report
How big is the Europe Solar Photovoltaic Market?
The Europe Solar Photovoltaic Market size is expected to reach 370.94 gigawatt in 2026 and grow at a CAGR of 12.08% to reach 656.06 gigawatt by 2031.
What is the current Europe Solar Photovoltaic Market size?
In 2026, the Europe Solar Photovoltaic Market size is expected to reach 370.94 gigawatt.
Who are the key players in Europe Solar Photovoltaic Market?
Lightsource BP Renewable Energy Investments Limited, Hanwha Q CELLS Technology Co., Ltd, SunPower Corporation, Iberdrola, S.A and JinkoSolar Holding Co., Ltd are the major companies operating in the Europe Solar Photovoltaic Market.
What years does this Europe Solar Photovoltaic Market cover, and what was the market size in 2025?
In 2025, the Europe Solar Photovoltaic Market size was estimated at 330.95 gigawatt. The report covers the Europe Solar Photovoltaic Market historical market size for years: 2020, 2021, 2022, 2023, 2024 and 2025. The report also forecasts the Europe Solar Photovoltaic Market size for years: 2026, 2027, 2028, 2029, 2030 and 2031.