Market Overview
| Study Period | 2018 - 2030 |
|---|---|
| Base Year For Estimation | 2024 |
| Forecast Data Period | 2025 - 2030 |
| Market Size (2025) | USD 3.9 Billion |
| Market Size (2030) | USD 5.64 Billion |
| Growth Rate (2025 - 2030) | 7.67% CAGR |
| Market Concentration | Low |
Major Players*Disclaimer: Major Players sorted in no particular order Image © Mordor Intelligence. Reuse requires attribution under CC BY 4.0. |
|

Europe Snack Bar Market Analysis by Mordor Intelligence
The Europe Snack Bar Market size is estimated at 3.9 billion USD in 2025, and is expected to reach 5.64 billion USD by 2030, growing at a CAGR of 7.67% during the forecast period (2025-2030).
The European snack bar industry is experiencing significant transformation driven by evolving consumer lifestyle patterns and snacking behaviors. Recent consumer studies indicate that snacking between meals has become increasingly prevalent across major European markets, with 58% of UK consumers, 44% of Germans, and 30% of French consumers incorporating snack bars into their daily routines in 2022. This shift in consumption patterns has led manufacturers to diversify their product portfolios with innovative offerings that cater to different dayparts and consumption occasions. The industry has responded by developing products that balance convenience with nutritional value, leading to the emergence of new product categories and flavor combinations.
The distribution landscape for snack bars continues to evolve, with retail channels adapting to changing consumer preferences and shopping habits. Major retailers are expanding their physical presence, exemplified by Tesco and Asda's combined network of 3,456 stores across the United Kingdom as of March 2023. Supermarkets and hypermarkets are implementing strategic shelf positioning and category management techniques to enhance visibility and drive impulse purchases. The convenience store sector is gaining prominence, with projections indicating these outlets will account for 33.22% of volume share by 2024, reflecting consumers' increasing preference for accessible shopping locations near homes and workplaces.
Health and wellness considerations are significantly influencing product development and marketing strategies in the snack bar sector. The rapid expansion of fitness facilities across Europe, illustrated by Germany's network of 535 climbing gyms, has created a robust market for nutrition bars. Manufacturers are responding by reformulating products with enhanced nutritional profiles, incorporating functional ingredients, and developing variants that align with specific dietary requirements. This health-conscious approach has led to innovations in ingredients, with companies focusing on natural sweeteners, plant-based proteins, and functional additives.
Product innovation and diversification have become crucial drivers of market dynamics, with manufacturers expanding their portfolios to meet diverse consumer preferences. Recent consumption data reveals that 96% of the UK population consumed granola/cereal/snack bars occasionally during 2021-2022, indicating the category's mainstream appeal. Companies are investing in research and development to create products that offer unique flavor combinations while maintaining nutritional benefits. The industry is witnessing a surge in premium offerings, clean-label products, and sustainable packaging solutions, reflecting consumers' growing sophistication and environmental consciousness.
Europe Snack Bar Market Trends and Insights
The adoption of a healthy lifestyle, along with the increasing number of sports enthusiasts, resulted in higher sales across Europe
- The convenience trend continued to grow in Europe, and increasingly busy lifestyles meant consumers were grabbing a few snack bars such as cereal bars, protein bars, nut bars, and others whenever and wherever they could.; In 2022, 58% of consumers in the United Kingdom claimed that they frequently consume snack bars.
- Snack bars are available in different formats in the region, including protein bars, fruit and nut bars, and cereal bars. Many manufacturers in the region are launching snack bars with innovative flavors to meet consumer preferences.
- Snack bar sales in Europe witnessed growth in 2022. As the demand for snack bars grows in the region, major key players are increasing their sales with their innovations; Germany is the leading country in the sales of protein bars in the region. The top brands in German protein bars include Myprotein, Multipower, Champ, PowerBar, and Power System.
- Consumers in the region are increasingly turning to snack bars such as cereal bars, protein bars, and fruit and nut bars as a perceived healthier option. Many Snack bars are formulated to provide a balance of nutrients, including carbohydrates, protein, and healthy fats.
Understand The Key Trends Shaping This Market
Download PDF
OTHER KEY INDUSTRY TRENDS COVERED IN THE REPORT
- Inclusion of superfood into the snack bar are driving the segment sales in the market
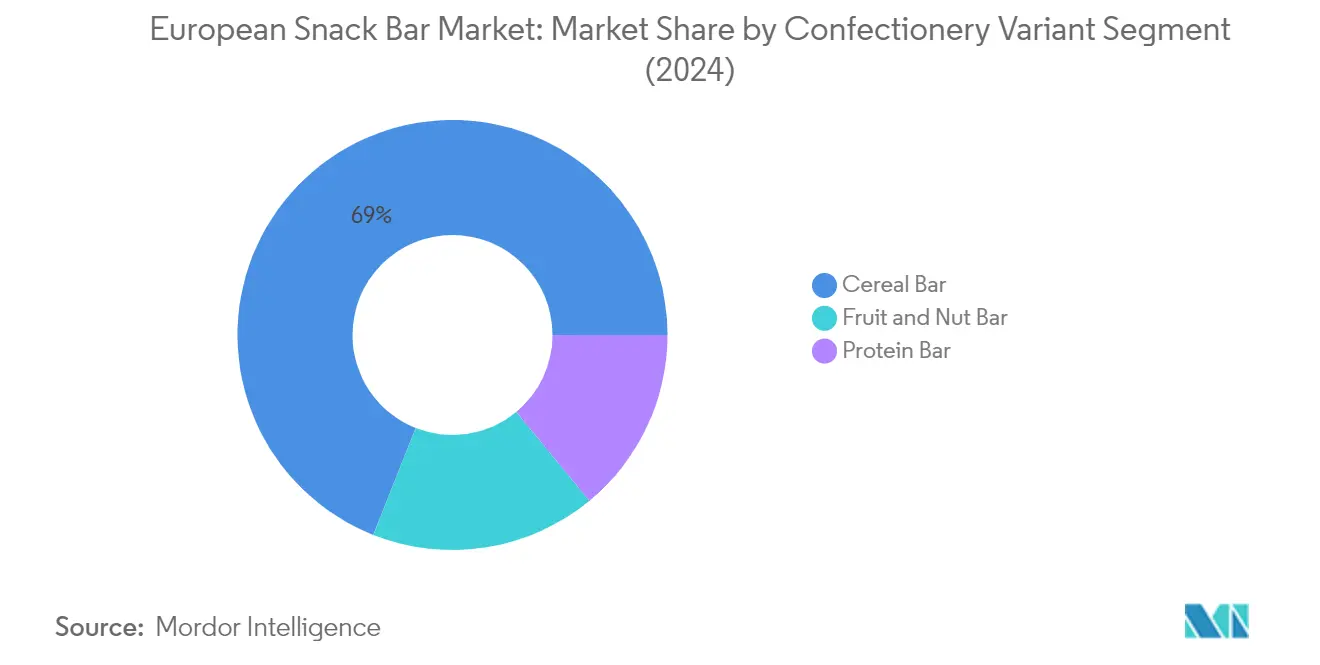
Segment Analysis: Confectionery Variant
Cereal Bar Segment in European Snack Bar Market
The cereal bar segment dominates the European snack bar market, commanding approximately 69% of the total market share in 2024. This significant market position is driven by the growing popularity of cereal bars as a convenient and nutritious snacking option among European consumers. The segment's strong performance is attributed to increasing consumer preference for grab-and-go solutions suitable for busy individuals, students, and fitness enthusiasts seeking quick nutrition during their day. The demand is particularly strong among health-conscious consumers who appreciate the higher fiber and energy content these bars provide. Manufacturers have responded to this demand by introducing innovative flavors and reducing sugar content while maintaining nutritional value. Popular European brands offering low-sugar and wide flavor selections in cereal bars include Nakd, Trek, Eat Natural, Alpen, Grenade, and Nature Valley.
Fruit & Nut Bar Segment in European Snack Bar Market
The fruit and nut bar segment is emerging as the fastest-growing category in the European snack bar market, projected to experience robust growth of approximately 9% between 2024 and 2029. This accelerated growth is primarily driven by increasing consumer awareness of the health benefits associated with nuts and dried fruits. The segment's expansion is supported by Europe's position as the largest importer of key ingredients like cashew nuts, accounting for 35-40% of global cashew imports by value. Manufacturers are capitalizing on this trend by introducing innovative products that combine various nuts and dried fruits, offering consumers healthy, portable snacking options that require no preparation. These bars are increasingly popular due to their association with heart health benefits, improved cholesterol levels, and effective weight management properties.
Remaining Segments in Confectionery Variant
The protein bar segment represents a significant portion of the European snack bar market, catering to a growing demographic of fitness enthusiasts and health-conscious consumers. This segment has gained substantial traction due to its appeal among millennials and active lifestyle consumers who seek high-protein, low-carb, and functional nutrition options. Manufacturers in this segment focus on developing products with varied protein content, innovative flavors, and clean label ingredients to meet evolving consumer preferences. The segment's growth is particularly notable in key markets like the United Kingdom, Germany, and France, where fitness and wellness trends continue to drive demand for protein-enriched snacking options.
Segment Analysis: Distribution Channel
Supermarket/Hypermarket Segment in European Snack Bar Market
Supermarket and hypermarket channels dominate the European snack bar market, commanding approximately 49% of the total market value in 2024. The segment's strong performance is attributed to strategic product positioning on dedicated shelves for the snack bar category, which significantly influences impulse purchase behavior among potential consumers. Major retail chains like Carrefour, Super U, Tesco, Asda, and Lidl have established extensive networks across the region, offering consumers a wide variety of snack bar options. These channels provide platforms for key brands to strategically position their products while consistently upgrading their infrastructure and distribution capabilities in response to consumer preferences for in-store purchases. The success of this segment is further enhanced by attractive discount offers, loyalty program schemes, and cashback initiatives that encourage repeat purchases.
Online Retail Store Segment in European Snack Bar Market
The online retail channel is experiencing remarkable growth in the European snack bar market, with an anticipated growth rate of approximately 9% during 2024-2029. This growth trajectory is driven by the increasing consumer preference for convenient shopping experiences and the rising penetration of internet users across Europe. The channel's expansion is further supported by various services such as store-to-door delivery, on-demand ordering, and click-and-collect in-store pickup options, making it increasingly attractive for convenience-seeking customers. Major snack bar brand manufacturers like Nakd, Trek, Clif Bar, Kind Snacks, and Grenade are actively expanding their e-commerce presence with diverse product ranges, particularly in the protein bars segment. The growth is also bolstered by the consumer shift toward online shopping platforms that offer detailed product information, competitive pricing, and convenient delivery options.
Remaining Segments in Distribution Channel
The convenience store channel maintains a significant presence in the European snack bar market, offering consumers easy access and extended operating hours compared to traditional stores. These stores generally operate in numerous locations and provide friendly services with competitive prices, allowing high brand visibility due to the larger volume of consumers visiting the outlets. The 'Others' category, comprising warehouse club stores, vending machines, discount stores, specialty stores, variety stores, and departmental stores, serves specific consumer segments with unique purchasing preferences and requirements. These channels collectively contribute to the market's diversity by catering to different consumer needs and shopping patterns across various locations and demographics.
Europe Snack Bar Market Geography Segment Analysis
Snack Bar Market in the United Kingdom
The United Kingdom dominates the European snack bars landscape, commanding approximately 43% of the total market value in 2024. The country's leadership position is driven by evolving consumer preferences toward healthier snacking alternatives and on-the-go food options. British consumers show a strong inclination toward protein-rich and low-sugar variants, with high-protein snack bars emerging as the fastest-growing segment. The market's robustness is further strengthened by the widespread presence of established retail channels, including supermarkets and convenience stores, which provide extensive product visibility and accessibility. The country's snack bar industry benefits from innovative product launches focusing on diverse nutritional profiles, including high-fiber, low-carb, and gluten-free options. Consumer awareness about health and wellness has particularly influenced purchasing decisions, with a significant portion of the population actively seeking meal replacement bars or fitness supplements. The market also sees strong demand from millennials and fitness enthusiasts who prefer convenient, nutrition-rich snacking options.
Snack Bar Market in Russia
Russia emerges as the most dynamic market in the European snack bar industry, projected to grow at approximately 14% annually from 2024 to 2029. The market's exceptional growth trajectory is fueled by increasing health consciousness among Russian consumers, particularly in urban areas. The country's snack bar industry is witnessing a significant transformation with the rising popularity of nutrition bars and cereal bars among young consumers. Local retailers are expanding their product portfolios to include international brands while also promoting domestic manufacturers, creating a diverse and competitive market environment. The consumer base is increasingly gravitating toward nutritious snacking options, with a particular emphasis on products offering functional benefits. Russian consumers show a strong preference for fruit and nut bars, which account for a substantial portion of the market share. The market's growth is further supported by the expansion of modern retail formats and the increasing penetration of online retail channels, making snack bars more accessible to consumers across different regions.
Snack Bar Market in Germany
Germany's snack bar market demonstrates strong potential, driven by the country's robust health and wellness trends. German consumers exhibit a strong preference for experimenting with new flavors and variants, particularly in cereal bars and protein-enriched products. The market is characterized by high consumer engagement in fitness activities, which drives demand for energy bars and protein bars. Manufacturers in Germany focus on clean label products, responding to the growing consumer demand for transparent ingredient lists and natural components. The country's distribution network is well-developed, with supermarkets and hypermarkets playing a crucial role in product accessibility. German consumers particularly value sustainable packaging and environmentally conscious production methods, influencing manufacturer strategies and product development. The market also benefits from innovative product launches that cater to specific dietary requirements, including vegan and organic options.
Snack Bar Market in Italy
Italy's snack bar market showcases distinctive characteristics shaped by the country's unique consumer preferences and eating habits. The market is witnessing increased adoption of snack bars as convenient meal alternatives, particularly among urban professionals and younger consumers. Italian consumers show a strong preference for products that combine nutrition with traditional flavors, leading to innovative product developments in the category. The country's retail landscape effectively supports market growth through well-established distribution networks and strategic product positioning. Health-oriented products, such as high-fiber, low-calorie, and high-protein variants, are gaining significant traction among Italian consumers. The market also benefits from the growing trend of snacking between meals, particularly among health-conscious consumers seeking nutritious alternatives to traditional snacks. Manufacturers in Italy are increasingly focusing on premium positioning and quality ingredients to meet consumer expectations.
Snack Bar Market in Other Countries
The snack bar market in other European countries, including France, the Netherlands, Belgium, Spain, Switzerland, and Turkey, exhibits diverse growth patterns and consumer preferences. These markets are characterized by varying levels of maturity and distinct consumer behaviors influenced by local dietary habits and health awareness. Countries like France and the Netherlands show a strong preference for innovative flavors and functional benefits, while markets such as Belgium and Switzerland focus on premium positioning and quality ingredients. Spain's market is driven by the growing health and wellness trend, particularly among urban consumers. Turkey's market shows promising growth potential with increasing consumer awareness about healthy snacking options. These markets collectively contribute to the dynamic nature of the European snack bar industry, each offering unique opportunities for market players to expand their presence and introduce innovative products.
Get Analysis on Important Geographic Markets
Download PDF
Competitive Landscape
Top Companies in Europe Snack Bar Market
The European snack bar market is characterized by continuous product innovation and strategic expansion initiatives by major players. Companies are heavily investing in developing new flavors, healthier formulations, and functional variants to meet evolving consumer preferences, particularly in protein-enriched and plant-based offerings. Operational agility is demonstrated through sophisticated manufacturing capabilities and robust distribution networks spanning multiple countries. Strategic moves predominantly focus on strengthening market presence through acquisitions of specialized nutrition bars brands and expansion of production facilities. Companies are also emphasizing sustainability initiatives, including recyclable packaging development and responsible sourcing practices, while simultaneously expanding their digital presence and direct-to-consumer channels to enhance market reach.
Global Leaders Dominate Regional Snack Market
The European snack bar market exhibits a relatively consolidated structure dominated by global food and beverage conglomerates with diverse product portfolios. These multinational players leverage their extensive research and development capabilities, established distribution networks, and strong brand recognition to maintain market leadership. The presence of regional specialists and local manufacturers adds competitive dynamics, particularly in specific market segments like protein bars and organic offerings, though their market share remains comparatively smaller than global leaders.
The market is characterized by frequent merger and acquisition activities as larger companies seek to expand their presence in growing segments and gain access to innovative products and technologies. Global players are particularly interested in acquiring companies with strong positions in health-focused and premium segments, while also pursuing strategic partnerships with local distributors to enhance market penetration. The competitive landscape is further shaped by the presence of private label offerings from major retailers, which compete primarily on price points while maintaining quality standards.
Innovation and Distribution Drive Market Success
Success in the European snack bar market increasingly depends on companies' ability to innovate across product formulations, packaging, and marketing strategies. Manufacturers need to focus on developing products that align with current health and wellness trends while maintaining taste and convenience attributes. Building strong relationships with retailers and investing in multiple distribution channels, including e-commerce platforms, has become crucial for maintaining market share. Companies must also demonstrate commitment to sustainability and transparency in their supply chains to meet growing consumer expectations.
For new entrants and smaller players, success lies in identifying and serving niche market segments with specialized products that address specific dietary needs or preferences. Developing unique value propositions through innovative ingredients, functional benefits, or sustainable practices can help differentiate offerings in a crowded market. Companies must also navigate potential regulatory changes regarding nutritional content and labeling requirements while maintaining flexibility to adapt to shifting consumer preferences. Building strong digital capabilities and establishing direct connections with consumers through social media and online platforms has become increasingly important for market success.
Europe Snack Bar Industry Leaders
-
General Mills Inc.
-
Kellogg Company
-
Mondelēz International Inc.
-
Nestlé SA
-
Post Holdings Inc.
- *Disclaimer: Major Players sorted in no particular order

Need More Details on Market Players and Competitors?
Download PDF
Recent Industry Developments
- May 2023: Nature Valley added a new level of flavor with the first savory snack option in Nature Valley's savory nut crunch bars.
- April 2023: Ferrero bought a snack bar factory in Germany. This acquisition will support the Ferrero Group’s growth strategy in the ‘better-for-you’ snacks category.
- November 2022: Mars Incorporated repackages snack bars in plastic acquired through advanced recycling. In a ‘closed loop’ collaboration with SABIC, Landbell, Plastic Energy, Taghleef, and SIT, the new wrapper is made from mono-material propylene, which is thought to make it fully recyclable and negate the need for multi-material layers or laminated plastics.
Europe Snack Bar Market Report Scope
Cereal Bar, Fruit & Nut Bar, Protein Bar are covered as segments by Confectionery Variant. Convenience Store, Online Retail Store, Supermarket/Hypermarket, Others are covered as segments by Distribution Channel. Belgium, France, Germany, Italy, Netherlands, Russia, Spain, Switzerland, Turkey, United Kingdom are covered as segments by Country.
Confectionery Variant
| Cereal Bar |
| Fruit & Nut Bar |
| Protein Bar |
Distribution Channel
| Convenience Store |
| Online Retail Store |
| Supermarket/Hypermarket |
| Others |
Country
| Belgium |
| France |
| Germany |
| Italy |
| Netherlands |
| Russia |
| Spain |
| Switzerland |
| Turkey |
| United Kingdom |
| Rest of Europe |
| Confectionery Variant | Cereal Bar |
| Fruit & Nut Bar | |
| Protein Bar | |
| Distribution Channel | Convenience Store |
| Online Retail Store | |
| Supermarket/Hypermarket | |
| Others | |
| Country | Belgium |
| France | |
| Germany | |
| Italy | |
| Netherlands | |
| Russia | |
| Spain | |
| Switzerland | |
| Turkey | |
| United Kingdom | |
| Rest of Europe |
Need A Different Region or Segment?
Customize Now
Market Definition
- Milk and White Chocolate - Milk chocolates is a solid chocolate made with milk (in the form of either milk powder, liquid milk, or condensed milk) and cocoa solids. White chocolate is made from cocoa butter and milk and contains no cocoa solids whatsoever. The scope includes regular chocolates, low-sugar, and sugar-free variants
- Toffees & Nougats - Toffees include hard, chewy, and small or one-bite candies marketed with labels as toffee or toffee-like confectionery. Nougat is a chewy confection with almond, sugar, and egg white as a basic ingredient; and it originated in Europe and Middle East countries.
- Cereals Bars - A snack composed of breakfast cereal that has been compressed into a bar shape and is held together with a form of edible adhesive. The scope includes snack bars made with cereals such as rice, oats, corn, etc. mixed with a binding syrup. These also include products labeled as cereal bars, cereal treat bars, or grain bars.
- Chewing Gum - This is a preparation for chewing, usually made of flavored and sweetened chicle or such substitutes as polyvinyl acetate. The types of chewing gums included in the scope are sugar-chewing gums and sugar-free chewing gums
| Keyword | Definition |
|---|---|
| Dark Chocolate | Dark chocolate is a form of chocolate containing cocoa solids and cocoa butter without the milk. |
| White Chocolate | White chocolate is the type of chocolate containing the highest percentage of milk solids, typically around or over 30 percent. |
| Milk Chocolate | Milk chocolate is made from dark chocolate that has a low cocoa solid content and higher sugar content, plus a milk product. |
| Hard Candy | A candy made of sugar and corn syrup boiled without crystallizing. |
| Toffees | A hard, chewy, often brown sweet that is made from sugar boiled with butter. |
| Nougats | A chewy or brittle candy containing almonds or other nuts and sometimes fruit. |
| Cereal bar | A cereal bar is a bar-shaped food product, made by pressing cereals and usually dried fruit or berries, which are in most cases held together by glucose syrup. |
| Protein bar | Protein bars are nutrition bars that contain a high proportion of protein to carbohydrates/fats. |
| Fruit & Nut bar | These are often based on dates with other dried fruit and nut additions and, in some cases, flavorings. |
| NCA | The National Confectioners Association is an American trade organization that promotes chocolate, candy, gum and mints, and the companies that make these treats. |
| CGMP | Current good manufacturing practices are those conforming to the guidelines recommended by relevant agencies. |
| Unstandardized foods | Unstandardized foods are those that do not have a standard of identity or that deviate from a prescribed standard in any manner. |
| GI | The glycemic index (GI) is a way of ranking carbohydrate-containing foods based on how slowly or quickly they are digested and increase blood glucose levels over a period of time |
| Skimmed milk powder | Skimmed milk powder is obtained by removing water from pasteurized skim milk by spray-drying. |
| Flavanols | Flavanols are a group of compounds found in cocoa, tea, apples, and many other plant-based foods and beverages. |
| WPC | Whey protein concentrate- the substance obtained by the removal of sufficient nonprotein constituents from pasteurized whey so that the finished dry product contains greater than 25% protein. |
| LDL | Low density Lipoprotein- the bad cholesterol |
| HDL | High density Lipoprotein- the good cholesterol |
| BHT | butylated Hydroxytoluene is a lab-made chemical that is added to foods as a preservative. |
| Carrageenan | Carrageenan is an additive used to thicken, emulsify, and preserve foods and drinks. |
| Free form | Not containing certain ingredients, such as gluten, dairy, or sugar. |
| Cocoa butter | It is a fatty substance obtained from cocoa beans, used in the manufacture of confectionery. |
| Pastellies | A type of of Brazilian candy made from sugar, eggs, and milk. |
| Draggees | Small, round candies that are coated with a hard sugar shell |
| CHOPRABISCO | Royal Belgian Association of the chocolate, pralines, biscuit, and confectionery industry- A trade association that represents the Belgian chocolate industry. |
| European Directive 2000/13 | A European Union directive that regulates the labeling of food products |
| Kakao-Verordnung | The German chocolate ordinance, a set of regulations that define what can be labeled as "chocolate" in Germany. |
| FASFC | Federal Agency for the Safety of the Food Chain |
| Pectin | A natural substance that is derived from fruits and vegetables. It is used in confectionery to create a gel-like texture. |
| Invert sugars | A type of sugar that is made up of glucose and fructose. |
| Emulsifier | A substance that helps to mix to liquids that does not mix together. |
| Anthocyanins | A type of flavonoid that is responsible for the red, purple, and blue colors of confectionery. |
| Functional Foods | Foods that have been modified to provide additional health benefits beyond basic nutrition. |
| Kosher certificate | This certification verifies that the ingredients, production process including all machinery, and/or food-service process complies with the standards of Jewish dietary law |
| Chicory root extract | A natural extract from the chicory root that is a good source of fiber, calcium, phosphorous, and folate |
| RDD | Recommended daily dose |
| Gummies | A chewy gelatin-based candy that is often flavored with fruit. |
| Nutraceuticals | Food or dietary supplements that are claimed to have health benefits. |
| Energy bars | Snack bars that are high in carbohydrates and calories are designed to provide energy on the go. |
| BFSO | Belgian Food Safety Organization for the food chain. |
Need More Details on Market Definition?
Ask a Question
Research Methodology
Mordor Intelligence follows a four-step methodology in all our reports.
- Step-1: Identify Key Variables: In order to build a robust forecasting methodology, the variables and factors identified in Step 1 are tested against available historical market numbers. Through an iterative process, the variables required for market forecast are set, and the model is built on the basis of these variables.
- Step-2: Build a Market Model: Market-size estimations for the forecast years are in nominal terms. Inflation is not a part of the pricing, and the average selling price (ASP) is kept constant throughout the forecast period for each country.
- Step-3: Validate and Finalize: In this important step, all market numbers, variables, and analyst calls are validated through an extensive network of primary research experts from the market studied. The respondents are selected across levels and functions to generate a holistic picture of the market studied.
- Step-4: Research Outputs: Syndicated Reports, Custom Consulting Assignments, Databases & Subscription Platforms

Get More Details On Research Methodology
Download PDF


