
Europe Semiconductor Device Market Size and Share
Market Overview
| Study Period | 2020 - 2031 |
|---|---|
| Forecast Data Period | 2026 - 2031 |
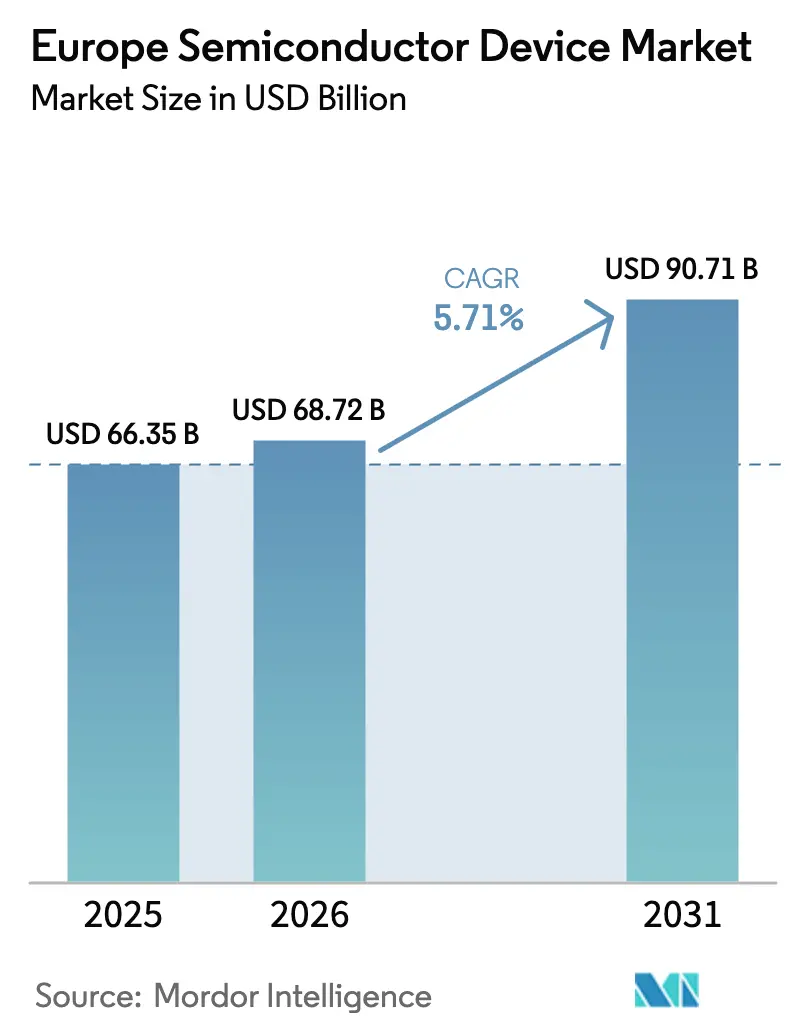
| Base Year Market Size (2025) | USD 66.35 Billion |
| Market Size (2026) | USD 68.72 Billion |
| Market Size (2031) | USD 90.71 Billion |
| Growth Rate (2026 - 2031) | 5.71% CAGR |
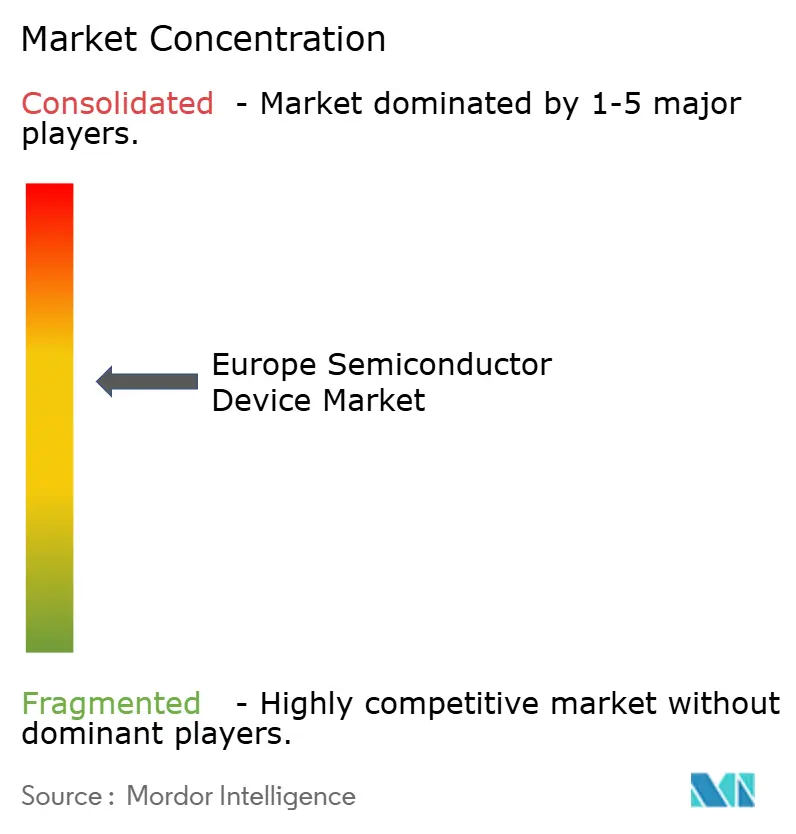
| Market Concentration | Medium |
Major Players *Disclaimer: Major Players sorted in no particular order Image © Mordor Intelligence. Reuse requires attribution under CC BY 4.0. | |
Europe Semiconductor Device Market Analysis by Mordor Intelligence
The Europe Semiconductor Device Market size is projected to be USD 66.35 billion in 2025, USD 68.72 billion in 2026, and USD 90.71 billion by 2031, growing at a CAGR of 5.71% from 2026 to 2031. This advance is underwritten by the EU Chips Act, which is mobilizing EUR 43 billion (USD 48.6 billion) in combined public and private funding to double the region’s global production share by 2030. Four Integrated Production Facilities and Open EU Foundries (ESMC and Infineon in Dresden, ams-OSRAM in Regensburg, and STMicroelectronics in Catania) were designated in October 2025, strengthening local capacity for logic, power, and sensor fabrication. Mature-node automotive microcontrollers, silicon carbide traction inverters, and wide-bandgap power discretes continue to anchor volumes, yet hyperscale datacenters, quantum-computing pilot lines, and photonics-enabled medical sensors are expanding the addressable base of high-margin applications. Competitive intensity remains pronounced as incumbents race to secure EU Chips Act subsidies and lock in multi-year automotive design wins, while fabless start-ups exploit X-FAB and GlobalFoundries' open foundry services to prototype application-specific integrated circuits.
Key Report Takeaways
- Integrated circuits commanded 61.72% of Europe semiconductor device market share in 2025. Sensors and microelectromechanical systems are forecast to expand at a 6.11% CAGR through 2031.
- Integrated device manufacturers held 67.33% of Europe semiconductor device market share in 2025. Design and fabless vendors are projected to grow at a 5.89% CAGR through 2031.
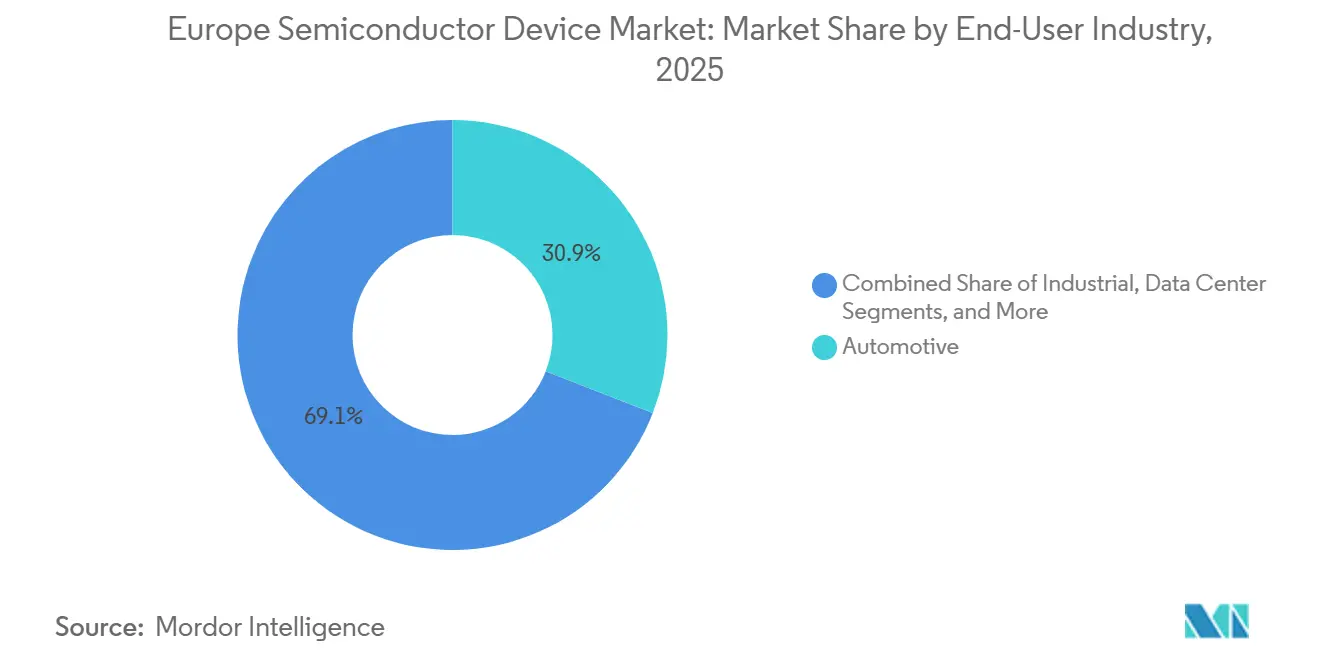
- Automotive captured 30.91% of Europe semiconductor device market share in 2025. Artificial-intelligence workloads are forecast to expand at a 7.02% CAGR through 2031.
- Technology nodes of 28 nm and above accounted for 36.08% of Europe semiconductor device market size in 2025. Five-nanometer processes are projected to grow at a 6.43% CAGR through 2031.
- Germany held 27.89% of Europe semiconductor device market share in 2025. The Netherlands is forecast to register the fastest 6.06% CAGR through 2031.
Note: Market size and forecast figures in this report are generated using Mordor Intelligence’s proprietary estimation framework, updated with the latest available data and insights as of January 2026.
Proportional positioning is established by comparing regional contributions against the global total, including that of Europe. The semiconductor device market share in our global report expresses these relative weights.
Europe Semiconductor Device Market Trends and Insights
Drivers Impact Analysis*
| Driver | (~) % Impact on CAGR Forecast | Geographic Relevance | Impact Timeline |
|---|---|---|---|
| AI-optimized logic IC demand from European hyperscale data centers | +1.2% | Germany, Netherlands, Ireland, France | Medium term (2-4 years) |
| Electric vehicle power electronics pulling SiC devices in Germany and France | +1.0% | Germany, France, Italy, Spain | Medium term (2-4 years) |
| Rapid 5G SA roll-outs elevating RF front-end module content per smartphone | +0.8% | Germany, United Kingdom, France, Spain | Short term (≤ 2 years) |
| EU Chips Act-funded 300mm fab expansions lowering local sourcing risk | +0.9% | Germany, France, Italy, Netherlands | Long term (≥ 4 years) |
| Quantum computing pilot lines spurring cryogenic CMOS controller demand in Finland and Netherlands | +0.4% | Finland, Netherlands, Germany | Long term (≥ 4 years) |
| Silicon photomultiplier adoption in medical imaging start-ups accelerating niche sensor volumes | +0.3% | Germany, France, United Kingdom, Netherlands | Medium term (2-4 years) |
| Source: Mordor Intelligence | |||
AI-Optimized Logic IC Demand From European Hyperscale Datacenters
Hyperscale operators are tripling artificial-intelligence server capacity across Europe, consolidating clusters in Germany and the Netherlands where renewable-energy credits and dense fiber interconnects reduce total cost of ownership.[1]Financial Times. “Europe to Triple AI Datacenter Capacity by 2027.” ft.com Nvidia’s June 2025 “sovereign AI” pitch persuaded policymakers to prioritize on-premise inference accelerators, reducing dependence on extra-regional clouds. Infineon expects AI-related power-management revenue to reach EUR 1.5 billion (USD 1.7 billion) in fiscal 2026 as silicon-carbide uninterrupted-power-supply modules scale to hyperscale deployments. By targeting the power and mixed-signal periphery rather than leading-edge logic, European fabs secure higher value capture even when wafer volumes migrate offshore. This dynamic also enlarges design-win opportunities for regional analog specialists that co-engineer thermal and voltage-regulation stacks with datacenter architects.
Electric-Vehicle Power Electronics Pulling SiC Devices in Germany and France
Automotive semiconductor content rose sharply after major German and French brands adopted 800-volt battery-electric architectures that mandate silicon-carbide traction inverters for fast-charging and reduced cable mass. Infineon and Stellantis signed a memorandum of understanding in 2025 to co-develop SiC power modules, accelerating CoolSiC ramp-up at Infineon’s Dresden expansion backed by EU Chips Act incentives.[2]Infineon Technologies. “CoolSiC Modules Target Datacenter UPS.” infineon.com France-based Soitec supplies Power-SOI substrates that remain foundational for low-loss power management despite fiscal-2025 inventory corrections. Multi-year wafer-supply agreements now bundle raw-wafer, epitaxy, and device procurement in a bid to secure scarce SiC capacity, tightening supplier lock-in and raising switching costs across the Europe semiconductor device market.
Rapid 5G SA Roll-outs Elevating RF Front-End Module Content per Smartphone
More than 10 European countries launched commercial 5G standalone networks by late 2025, and Ericsson, together with EE, demonstrated Advanced RAN Coordination in the United Kingdom, dynamically aggregating mid-band and millimeter-wave spectrum. Standalone deployments boost filter, switch, and power-amplifier counts per handset, lifting average selling prices for RF front-end modules. European handset brands source RF-SOI wafers from Soitec and gallium-arsenide dies from regional design houses, thereby shortening lead times and localizing value-addition. Analog IC providers further monetize this shift by integrating envelope-tracking and impedance-tuning circuits that cut power draw in spectrum-sharing scenarios.
EU Chips Act–Funded 300 mm Fab Expansions, Lowering Local Sourcing Risk
The European Semiconductor Manufacturing Company joint venture- supported by EUR 5 billion (USD 5.65 billion) in German aid- broke ground in Dresden in August 2024 and will ship 40,000 300 mm wafers monthly of 28 nm and 22 nm automotive logic by 2027. Infineon secured EUR 920 million to EUR 1 billion (USD 1.04 billion–USD 1.13 billion) for its contiguous 300 mm power-semiconductor expansion in February 2025, targeting silicon-carbide module output. While Intel’s Magdeburg project endured subsidy cuts, aggregate capacity additions meaningfully derisk long-haul supply chains for European automakers and industrial OEMs, compressing lead times and limiting exposure to geopolitical shipping disruptions.
Restraints Impact Analysis*
| Restraint | (~) % Impact on CAGR Forecast | Geographic Relevance | Impact Timeline |
|---|---|---|---|
| Tight EU27 Talent Pipeline for Analog and Mixed-Signal Design Engineers | -0.6% | Germany, France, Netherlands, Italy | Medium term (2-4 years) |
| Capital-intensity barrier for new SiC and GaN substrate lines | -0.4% | Germany, France, United Kingdom | Long term (≥ 4 years) |
| PFAS phase-out under REACH raising dielectric material re-qualification costs | -0.5% | EU27-wide | Medium term (2-4 years) |
| Fragmented sub-200mm foundry ecosystem limiting IoT prototyping scalability | -0.3% | Germany, France, Italy, Spain | Short term (≤ 2 years) |
| Source: Mordor Intelligence | |||
Tight EU27 Talent Pipeline for Analog and Mixed-Signal Design Engineers
SEMI Europe’s October 2024 “Skills for Chips” report warned that 1 million semiconductor jobs must be filled by 2030, with analog and mixed-signal specialists in shortest supply.[3]SEMI. “SEMI Europe Skills for Chips Report.” semi.org Although the European Chips Skills Academy targets 100,000 trainees, the curriculum refresh lags rapid shifts toward cryogenic CMOS and wide-bandgap power modeling. German automotive suppliers cite 18-month hiring lead times for senior analog engineers, compelling reliance on contract design houses outside the region. The scarcity inflates acquisition premiums, exemplified by STMicroelectronics paying USD 950 million for NXP’s MEMS unit partly to secure 200 sensor-design engineers. Absent accelerated workforce development, fab ramps may be bottlenecked by IP validation cycles rather than equipment installations.
Capital-Intensity Barrier For New SiC And GaN Substrate Lines
Wolfspeed paused construction of its Ensdorf 200 mm SiC wafer fab in October 2024 owing to funding gaps, resuming only in January 2025 after bridge financing was secured. A greenfield SiC substrate line requires USD 1 billion-USD 1.5 billion in up-front capital, deterring venture-backed entrants. Infineon’s 300 mm GaN pilot leverages brownfield infrastructure, but full-scale GaN production still requires dedicated crystal-growth and epitaxy capacity. EU Chips Act allocations prioritize logic and sensor lines, leaving wide-bandgap substrate funding comparatively thin and forcing European device makers to import wafers from Asia-Pacific vendors, embedding currency-translation and geopolitical risk into bills of material.
*Our forecasts treat driver/restraint impacts as directional, not additive. The impact forecasts reflect baseline growth, mix effects, and variable interactions.
Segment Analysis
By Device Type: Integrated Circuits Anchor Revenue, Sensors Outpace Growth
Integrated circuits held 61.72% of Europe semiconductor device market share in 2025, supported by entrenched design wins in automotive body control, industrial PLCs, and datacenter voltage regulation. STMicroelectronics’ STM32V8 microcontroller family, launched in November 2025 on an 18 nm process, targets advanced driver-assistance and electric-vehicle zone controllers.[4]STMicroelectronics. “STM32V8 Microcontroller Family Launches on 18 nm.” st.com Optoelectronics maintained a mid-teens slice, buoyed by ams-OSRAM’s EUR 5 billion (USD 5.65 billion) in 2025 design-win announcements for 2D direct time-of-flight sensing. Discrete power devices continued migrating from silicon IGBTs to silicon-carbide MOSFETs as 800-volt battery-electric platforms scale.
Sensors and microelectromechanical systems are projected to grow at a 6.11% CAGR, the fastest among device classes. Melexis posted EUR 222.2 million (USD 251.1 million) in Q3-2025 revenue, driven by rising demand for magnetic-position and current sensors. Fraunhofer IMS crossed the 1-million-unit mark for its digital silicon-photomultiplier in December 2025, validating research-institute-to-fab transfer pathways. As centralized vehicle architectures proliferate, distributed sensing becomes the primary data source, explaining why the Europe semiconductor device market size attached to sensor content is expanding faster than logic or memory subsectors.


By Business Model: IDMs Retain Scale, Fabless Vendors Gain Agility
Integrated device manufacturers controlled 67.33% of 2025 revenues. Infineon’s Dresden expansion, backed by EU Chips Act grants, underscores the sovereign-manufacturing advantage inherent in the IDM model. ON Semiconductor’s Czech site serves image-sensor and SiC-diode demand for European automakers, contributing to USD 1.76 billion Q3-2025 corporate revenue.
Design and fabless vendors will nonetheless expand at a 5.89% CAGR as X-FAB and GlobalFoundries open foundry portals democratize application-specific integrated circuit tape-outs. X-FAB’s Q3-2025 revenue reached USD 166.4 million despite soft consumer end markets, a testament to sustained automotive and industrial prototype demand. The European semiconductor device industry is witnessing hybrid strategies: Renesas’ 2024 acquisition of design-automation firm Altium illustrates vertical integration moves by microcontroller suppliers, while fabless start-ups negotiate forward-capacity contracts to protect margins in tight allocation cycles.
By End-User Industry: Automotive Dominates, Artificial Intelligence Surges
Automotive applications captured 30.91% of 2025 revenues, reinforcing Europe’s legacy in premium vehicle platforms. Melexis derived 91% of Q3-2025 revenue from automotive clients, while Elmos secured EUR 289.9 million (USD 327.6 million) in nine-month 2025 sales from ultrasonic parking-assist ICs. Analog front-ends for radar and battery-management systems drove Texas Instruments’ USD 4.15 billion Q3-2025 worldwide revenue, a meaningful portion of which flowed to European OEMs.
Artificial-intelligence datacenters represent the fastest-growing vertical at a 7.02% CAGR. Nvidia’s sovereign-AI strategy is accelerating the procurement of inference accelerators in Germany, the Netherlands, and Ireland. Infineon targets EUR 1.5 billion (USD 1.7 billion) AI-power revenue by fiscal 2026, confirming that power-management and thermal solutions, rather than digital logic, capture the incremental value pool. The Europe semiconductor device market size tied to datacenter power discretes is therefore converging with that of automotive modules.
By Technology Node: Mature Nodes Anchor Volume, Advanced Nodes Gain Share
Technology nodes greater than or equal to 28 nm produced 36.08% of 2025 revenue, reflecting automotive and industrial customers’ preference for long-lifecycle processes. The ESMC venture will ship 28 nm and 22 nm wafers beginning in 2027, consolidating Europe’s hold on mature-node automotive controllers. X-FAB remains the go-to for 180-nm to 350-nm analog prototypes, favoring design flexibility over transistor density.
Five-nanometer processes are forecast to expand at a 6.43% CAGR, driven by AMD’s Instinct MI300 accelerators and Intel’s Gaudi 3 AI chips, which are sampling with European hyperscalers. While sub-3-nm production remains concentrated in Asia-Pacific, Europe secures margins via power, analog, and sensor devices that tolerate larger geometries- even as it chips away at its leading-edge dependence through ASML’s EUV equipment monopoly.
Geography Analysis
Germany generated 27.89% of 2025 regional revenue thanks to a tight automotive-semiconductor cluster within a 200-km radius of Stuttgart and Munich. Infineon’s Dresden power-device expansion, funded by up to EUR 1 billion (USD 1.13 billion), will supply silicon-carbide modules to Volkswagen and Mercedes-Benz beginning 2026. The ESMC 28 nm-22 nm fab strengthens Germany’s dominance in mature nodes, yet documented talent shortages by SEMI Europe risk delaying volume ramps. The United Kingdom captured a mid-teens share on the back of Ericsson’s 5G infrastructure deployments and ams-OSRAM’s Regensburg optoelectronics output.
France matched the United Kingdom’s mid-teens share in 2025, propelled by STMicroelectronics’ Crolles 300 mm logic line and Soitec’s RF-SOI production. Soitec’s fiscal-2025 Q2 revenue fell to EUR 185 million (USD 209.0 million), yet Power-SOI substrates remain non-substitutable for automotive electrification. Italy and Spain each held mid-single-digit stakes, with STMicroelectronics’ Catania facility receiving Integrated Production Facility status under the EU Chips Act to reinforce power-discrete independence.
The Netherlands is forecast to advance at a 6.06% CAGR through 2031, driven by ASML’s EUR 7.5 billion (USD 8.48 billion) Q3-2025 revenue from EUV tools and ASM International’s EUR 747 million (USD 844.1 million) contribution from atomic-layer-deposition systems. Eindhoven-based NXP anchors RF and automotive-MCU design, while SemiQon’s EUR 15 million (USD 16.95 million) grant for cryogenic controllers highlights quantum-computing momentum. Smaller markets- Belgium, Finland, Austria- delivered a combined low-double-digit share, each carving defensible niches such as Melexis’ magnetic sensors and VTT’s Q50 quantum-computer pilot.
Mordor Intelligence examines the semiconductor device market across diverse other regional markets as well, including Asia, while also offering granular country-level perspectives for South Korea, China, and Japan and more.
Regulatory Landscape
The European Commission-led EU Chips Act remains the central policy framework shaping Europe’s semiconductor-device investment pipeline, supported by EUR 43 billion in combined public and private funding and coordinated through the European Semiconductor Board. In October 2025, the Commission designated four Integrated Production Facilities and Open EU Foundries (ESMC and Infineon in Dresden, ams-OSRAM in Regensburg, and STMicroelectronics in Catania), linking access to public support with commitments on capacity availability, collaboration, and resilience planning.
In 2026, the Commission widened the scope via its June 3, 2026 proposal for Chips Act 2.0 (COM/2026/504), which adds tighter monitoring and crisis-preparedness tools. These include a Business-to-Business Semiconductor Supply Chain Platform and permitting streamlining targeted at 12 months. A Joint Declaration by the European Parliament and Council on April 24, 2026 elevated the initiative as a high-priority file with a target adoption window in Q2 2027, reinforcing the policy emphasis on domestic manufacturing capacity and supply-chain transparency for critical semiconductor devices.
Value Chain Analysis
Europe’s semiconductor device value chain runs from design (automotive MCU, analog, power, RF, and sensor IP) to wafer manufacturing and processing through IDMs and specialty foundries, followed by assembly, test, and packaging. Downstream integration then feeds automotive, industrial, communications, and datacenter systems. The chain is anchored by strong analog and power design capabilities and sensor competencies, with IDMs such as Infineon, STMicroelectronics, and NXP supported by open foundry access from X-FAB and GlobalFoundries to support prototype-to-production pathways in mature nodes.
Recent moves also show a pattern of vertical integration and resilience-oriented coordination across segments. STMicroelectronics’ completion of the NXP MEMS sensors business acquisition on February 2, 2026 adds in-region sensor design and productization capability for automotive safety and industrial sensing. On the supply assurance side, Infineon’s One Virtual Fab approach, linking Dresden and Villach, pools capacity operationally across sites to manage demand swings, while the ICOS2 project launch in July 2026 creates a structured mechanism to map dependencies and provide supply-chain intelligence that can support procurement and investment decisions across materials, equipment, wafer processing, and device manufacturing.
Competitive Landscape
Top-five IDMs- Infineon, STMicroelectronics, NXP, ams-OSRAM, ON Semiconductor- together captured most of 2025 revenue, indicating moderate concentration. STMicroelectronics’ planned USD 950 million acquisition of NXP’s MEMS unit bolsters its sensor depth for automotive and industrial-Internet-of-Things platforms. Infineon is reallocating R&D toward AI datacenter power modules, aiming for EUR 1.5 billion (USD 1.7 billion) in fiscal-2026 AI power sales. Research institutes keep pressure on incumbents: Fraunhofer IMS has already produced 1 million digital SiPM dies, while SemiQon targets 200-qubit cryogenic CMOS controllers by 2027, hinting at future fabless IDM alliances.
Technology differentiation centers on wide-bandgap power devices, cryogenic analog design, and silicon photonics. Infineon began 300 mm GaN sampling in Q4-2025 to halve die cost for 48-volt converters, whereas ASML’s EUV systems extend Europe’s choke-point leverage in global logic scaling. Regulatory changes pose downside risks as SEMI forecasts EUR 500 million to EUR 1 billion in dielectric requalification costs due to the PFAS phase-out, and fragmented sub-200 mm capacity still hampers Internet-of-Things prototyping. Overall, the Europe semiconductor device market balances sovereign-manufacturing ambitions with a rich ecosystem of specialty fabs and design houses.
Europe Semiconductor Device Industry Leaders
Infineon Technologies AG
STMicroelectronics N.V.
NXP Semiconductors N.V.
ON Semiconductor Corporation
Texas Instruments Incorporated
- *Disclaimer: Major Players sorted in no particular order

Market Opportunities and Future Outlook
Power semiconductors and analog or mixed-signal devices form a clear expansion lane in Europe, backed by both industrial policy and new manufacturing capacity. Infineon’s opening of its EUR 5 billion Smart Power Fab in Dresden on July 2, 2026 is a concrete anchor for higher local output of power semiconductors and related analog or mixed-signal technologies, which fits the region’s strengths in automotive electrification, industrial power conversion, and datacenter power management.
Opportunities also extend into upstream and midstream supply-chain segments where Europe has targeted support for equipment and wide-bandgap materials. In May 2026, the European Commission approved EUR 288 million for semiconductor supply-chain projects, including funding for Carl Zeiss to expand equipment manufacturing and for Zadient Materials Europe GmbH to establish a silicon carbide facility. In July 2026, it approved EUR 659 million in German State aid for four first-of-a-kind projects spanning power semiconductors, SiC materials, equipment, and detectors. Separately, the proposed Chips Act 2.0 includes Grand Challenges to accelerate industrial development in areas such as AI chips, creating openings for device makers and design houses that can pair Europe’s analog, power, sensor, and specialty-process capabilities with sovereign compute and infrastructure programs.
Recent Industry Developments
- July 2026: Infineon Technologies AG opened the Smart Power Fab in Dresden, Germany, following a 5 billion euro investment, creating 1,000 direct jobs. The launch expands European power and analogue device manufacturing capacity and supply resilience under the EU Chips Act, reinforcing regional capability to serve automotive and industrial segments. It strengthens Europe’s industrial footprint by adding high value fabrication capacity in a strategic hub.
- July 2026: Intel Corporation announced a 5 billion euro capital investment at its Leixlip, Ireland campus to scale capacity for Intel Xeon 6 and next-gen processors. The expansion increases Europe capacity for advanced compute and expands the regional manufacturing footprint for high performance chips. It enhances European semiconductor production capabilities for data center AI workloads by enlarging local fabrication and assembly capabilities.
- February 2026: STMicroelectronics N.V. completed the acquisition of NXP Semiconductors N.V. MEMS sensors business, enhancing automotive and industrial sensor capabilities. The consolidation strengthens STMicroelectronics MEMS portfolio for automotive and industrial applications. It broadens STMicroelectronics sensors depth and expands offerings for automotive and industrial IoT platforms.


Research Methodology Framework and Report Scope
Market Definition and Coverage
For this study, the Europe semiconductor device market includes revenues earned from semiconductor devices sold into European demand, across major device categories used in electronics, automotive, industrial, and communication applications.
Scope exclusions: We exclude downstream finished electronic systems and related services, and we do not count raw materials that are not sold as semiconductor devices.
Segmentation Overview
- By Device Type
- Discrete Semiconductors
- Diodes
- Transistors
- Power Transistors
- Rectifier and Thyristor
- Other Discrete Semiconductors
- Optoelectronics
- Light-Emitting Diodes (LEDs)
- Laser Diodes
- Image Sensors
- Optocouplers
- Other Optoelectronics
- Sensors and MEMS
- Pressure
- Magnetic Field
- Actuators
- Acceleration and Yaw Rate
- Other Sensors and MEMS
- Integrated Circuits
- By IC Type
- Analog
- Micro
- Microprocessors (MPU)
- Microcontrollers (MCU)
- Digital Signal Processors
- Logic
- Memory
- By IC Type
- Discrete Semiconductors
- By Business Model
- Integrated Device Manufacturer (IDM)
- Design / Fabless Vendor
- By End-user Industry
- Automotive
- Communication (Wired and Wireless)
- Consumer
- Industrial
- Computing / Data Storage
- Data Center
- Artificial Intelligence
- Government
- By Technology Node
- Less than or Equal to 3nm
- 5 nm
- 7 nm
- 16 nm
- Less than or Equal to 28nm
- By Country
- Germany
- United Kingdom
- France
- Italy
- Netherlands
- Spain
- Rest of Europe
Data Sources, Market Sizing, and Validation
Desk Research
Desk research is used to map the demand backdrop and set practical boundaries for what should be counted as a semiconductor device sale in Europe. We rely on public industry statistics and policy releases that clarify regional production, consumption, and investment plans, and then we check the resulting assumptions against company-reported trends.
Common inputs include sources such as World Semiconductor Trade Statistics releases used by European industry bodies, Eurostat industrial and external trade series, OECD manufacturing indicators, and European Commission publications linked to the Chips Act. We also review corporate annual reports, investor presentations, and reputable press coverage, and then we cross-check financial context using paid subscriptions that compile company financials and patent databases for technology direction. This list is illustrative only, and other sources were also referenced for data collection, validation, and clarification.
Primary Interviews and Surveys
Primary work is used to confirm which device families are driving spending in Europe and how pricing and inventory cycles are being handled in current contracts. We spoke with device suppliers, distribution-facing executives, and demand-side stakeholders across electronics manufacturing and automotive supply chains in major European hubs, and used these inputs to tighten assumptions that were weak or missing in public datasets.
Distribution of primary research fieldwork respondents
| Company type | Respondent position | Region |
|---|---|---|
| Top tier: 37% | CXOs: 20% | |
| Mid tier: 43% | Functional/Unit leaders: 21% | |
| Smaller Players: 20% | Managers: 59% |
Market-Sizing & Forecasting
Sizing starts from a top-down demand reconstruction where Europe-level semiconductor sales are built up using regional shipment and consumption signals, and then allocated into device groupings using observed mix shifts. Once the first cut is formed, we apply selective bottom-up approximations to keep totals realistic, including sampled device family revenue roll-ups, distributor channel checks, and ASP times volume sanity checks for high-visibility categories.
Key model inputs include Europe semiconductor sales trend lines from industry statistics, automotive production and electrification intensity as a pull factor for power and sensing devices, industrial automation activity as a driver for analog and embedded components, and data center and telecom capex as a reference point for compute and memory demand. Technology transitions are also tracked through wafer capacity announcements, node migration discussions, and lead-time and inventory commentary, which helps avoid overstating rebound years.
For forecasting, we apply scenario analysis supported by time-series smoothing on the base demand indicators, then adjust the path using primary feedback on pricing resets, customer de-stocking duration, and contract renewal timing. Where bottom-up pieces are missing for smaller device lines, we handle the gaps with ratio-based allocation from comparable device families, then recheck against total Europe sales control totals.
Data Validation & Update Cycle
Outputs are validated through several passes that compare the computed market value with independent signals such as regional semiconductor sales releases, end-market production trends, and disclosed capacity ramp timelines. Large variances are flagged, assumptions are reworked, and follow-up calls are triggered when pricing or mix shifts look inconsistent with what suppliers and buyers report.
Before sign-off, the model and narrative are reviewed by another analyst to catch unit errors, timing mismatches, and currency conversion issues. Reports are refreshed annually, and interim updates are made when material events occur, such as sharp inventory corrections, major fab investment changes, or policy-driven demand shifts. Right before delivery, a final refresh pass is completed so clients receive the latest updated view.
Mordor Intelligence's Europe Semiconductor Device Market Size Compared With Other Published Estimates
It is normal to see different market values for Europe semiconductor devices because each publisher draws the boundary in its own way and then selects its own timing for price, currency, and inventory cycle assumptions. In this study, we keep the steps repeatable so a reader can trace how demand signals translate into a revenue number.
Key gaps usually come from whether the estimate reflects Europe-only sales or mixes in global shipments tied to European HQs, and whether the value includes adjacent electronics content beyond semiconductor devices. By tracking sales-control totals and refreshing device-mix assumptions during model review, Mordor Intelligence keeps the market value aligned with Europe demand rather than counting double through system-level electronics value.
Benchmark comparison
| Source | Market Size | Gaps in Research Methodology |
|---|---|---|
| Mordor Intelligence | USD 66.35 B (2025) | |
| Trade Journal A | USD 52.03 B (2024) | Uses Europe semiconductor sales release totals for a calendar year, which can sit lower during correction years and does not always align with the study base year and device-only boundary used here. |
| Regional Consultancy B | USD 70.00 B (2024) | Often presented as a broad semiconductor market value that may blend device revenues with wider electronics scope or apply more aggressive rebound pricing, which lifts the total versus a device-only, demand-tied model. |
The spread is mainly explained by year alignment and what is counted as a semiconductor device sale versus a wider semiconductor or electronics value chain. When the scope is kept tight and the inputs are anchored to observable Europe sales and end-market signals, the final number is easier to defend and to update in a consistent way year after year.


Key Questions Answered in the Report
Which country generated the highest semiconductor-device revenue in Europe in 2025?
Germany led with 27.89% share, powered by its automotive-centric ecosystem.
What CAGR is forecast for sensors and MEMS through 2031?
Sensors and MEMS are projected to grow at 6.11% annually, outpacing all other device types.
How will the EU Chips Act influence regional capacity?
Chips Act incentives are funding multiple 300 mm fabs that will reduce sourcing risk for automotive and industrial customers from 2027 onward.
Which end-user segment is expected to grow fastest?
Artificial-intelligence datacenters are forecast to register a 7.02% CAGR as hyperscale operators triple server capacity.
What is the main restraint on Europe’s semiconductor expansion?
A shortage of analog and mixed-signal design engineers is slowing IP validation and new-product ramps.
Page last updated on:


