Market Overview
| Study Period | 2017 - 2030 |
|---|---|
| Base Year For Estimation | 2024 |
| Forecast Data Period | 2025 - 2030 |
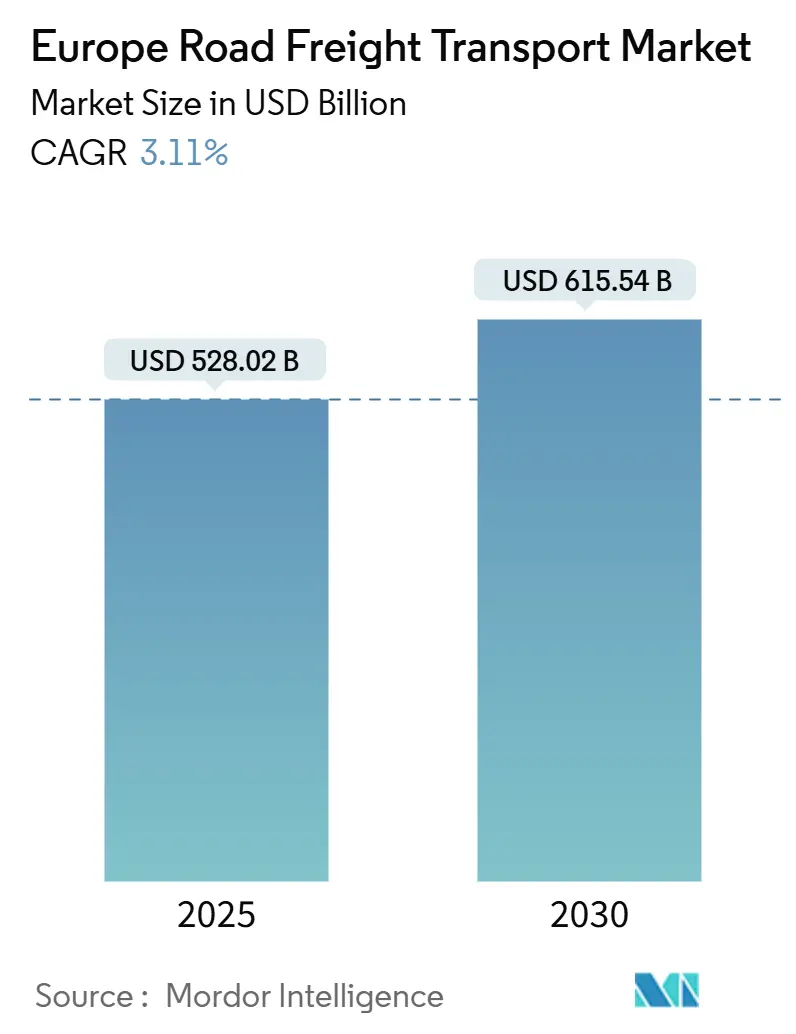
| Market Size (2025) | USD 528.02 Billion |
| Market Size (2030) | USD 615.54 Billion |
| Growth Rate (2025 - 2030) | 3.11% CAGR |
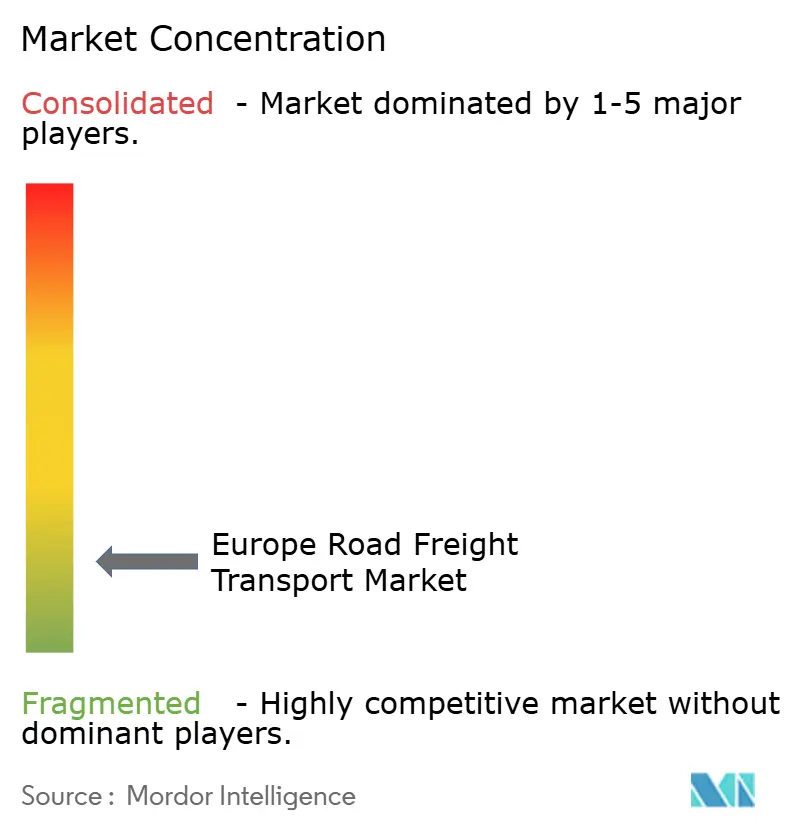
| Market Concentration | Low |
Major Players *Disclaimer: Major Players sorted in no particular order Image © Mordor Intelligence. Reuse requires attribution under CC BY 4.0. | |
Europe Road Freight Transport Market Analysis by Mordor Intelligence
The Europe road freight transport market size stands at USD 528.02 billion in 2025 and is on course to reach USD 615.54 billion by 2030, reflecting a 3.11% CAGR between 2025 and 2030. This expansion underscores the resilience of the Europe road freight transport market despite structural headwinds such as driver shortages and fuel-price volatility. E-commerce, manufacturing reshoring to Central and Eastern Europe, and the commercial rollout of digital freight matching platforms are jointly sustaining freight volumes, while autonomous truck corridors are poised to recalibrate long-haul capacity utilization patterns. Robust parcel demand, incentives for low-emission fleets, and consolidation among top logistics providers further bolster the competitive environment.
Key Report Takeaways
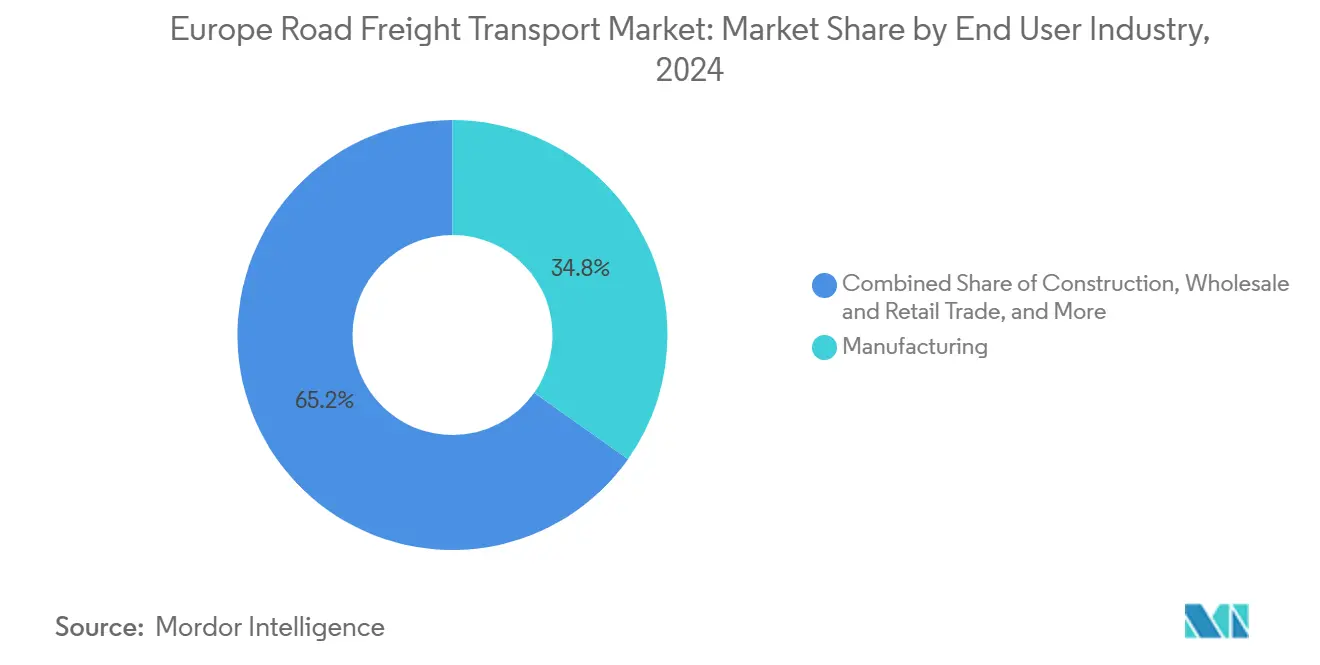
- By end user industry, manufacturing led with 34.77% of the Europe road freight transport market share in 2024, while wholesale and retail trade is projected to post the fastest 3.59% CAGR between 2025 and 2030.
- By destination, domestic movements accounted for 59.65% of the Europe road freight transport market size in 2024, whereas international flows are forecast to grow at a 3.53% CAGR between 2025 and 2030.
- By truckload specification, full-truck-load services controlled 82.44% of the revenue share in 2024, while less-than-truck-load operations are expected to expand at a 3.49% CAGR between 2025 and 2030.
- By containerization, non-containerized freight dominated with 88.31% of the revenue share in 2024, as containerized transport is set to advance at a 3.22% CAGR between 2025 and 2030.
- By distance, long-haul lanes commanded 73.62% of the revenue share in 2024 and are projected to continue growing at a 3.28% CAGR between 2025 and 2030.
- By goods configuration, solid goods held 73.05% of the revenue share in 2024, whereas fluid goods are anticipated to register the highest 3.37% CAGR between 2025 and 2030.
- By temperature control, non-temperature-controlled transport represented 94.38% of the revenue share in 2024, while temperature-controlled logistics is forecast to rise at a 3.41% CAGR between 2025 and 2030.
- By country, the United Kingdom captured 13.57% of the revenue share in 2024, yet the Netherlands is expected to record the strongest 4.07% CAGR between 2025 and 2030.
Europe Road Freight Transport Market Trends and Insights
Drivers Impact Analysis
| Driver | (~) % Impact on CAGR Forecast | Geographic Relevance | Impact Timeline |
|---|---|---|---|
| E-commerce parcel volume boom post-2025 | +0.8% | Western Europe, expanding to CEE | Medium term (2-4 years) |
| Re-industrialization stimulus funds in CEE | +0.6% | Poland, Czech Rep., Slovakia, Hungary, Romania | Long term (≥ 4 years) |
| EU Green Deal fleet-renewal incentives | +0.4% | EU-wide, strongest in Germany, Netherlands, France | Long term (≥ 4 years) |
| Digital freight matching platforms at scale | +0.5% | Germany, Netherlands, France; expanding east | Short term (≤ 2 years) |
| Cross-border autonomous truck corridors | +0.3% | Germany-Netherlands-Nordics | Long term (≥ 4 years) |
| Near-shoring to Eastern Europe | +0.2% | CEE, notably Poland and Czech Rep. | Medium term (2-4 years) |
| Source: Mordor Intelligence | |||
Understand The Key Trends Shaping This Market
Download PDF
E-commerce Parcel Volume Boom Post-2025
Double-digit parcel growth is set to continue through 2025, compelling carriers to densify last-mile networks and spurring demand for micro-fulfillment hubs of 10,000–15,000 m²[1]European Commission, “Transport and Mobility,” ec.europa.eu. Knight Frank estimates that every EUR 1 billion (USD 1.10 billion) in online sales adds 108,000 m² of warehouse space, translating into 10.2 million m² across the five largest European markets by 2027[2]Knight Frank, “Future Gazing – Industrial and Logistics for Europe’s Future,” knightfrank.com. Distributed inventory strategies and elevated return rates—three times higher than in-store purchases—reshape route density and require specialized reverse-logistics capacity.
Re-industrialization Stimulus Funds in CEE
Central and Eastern Europe are benefiting from EU and national incentives that back the reshoring of automotive, battery, and electronics manufacturing, lifting regional GDP growth to twice the EU average. Poland’s manufacturing PMI stayed above 50 in 2024, while the Czech industry contributed 26% of the national GDP, both generating steady inbound raw-material and outbound finished-goods flows.
EU Green Deal–Linked Fleet-Renewal Incentives
Alternative-fuel truck registrations increased markedly in 2024, aided by purchase subsidies and distance-based tolling with CO₂ differentiation, introduced first in Denmark in January 2025[3]ACEA, “Commercial Vehicle Statistics,” acea.auto. From 2027, the inclusion of road transport in the EU ETS will push carbon pricing higher, incentivizing further fleet electrification.
Digital Freight Matching Platforms Reach Scale
Germany and the Benelux region have seen escalating adoption of digital load-matching tools that reduce empty kilometers and enhance real-time capacity visibility. Rhenus’ Groupage Network 2.0 offers daily cross-border LTL services, illustrating platform-enabled frequency improvements.
Restraints Impact Analysis
| Restraint | (~) % Impact on CAGR Forecast | Geographic Relevance | Impact Timeline |
|---|---|---|---|
| Driver shortage and aging workforce | −0.4% | EU-wide, acute in Germany, Netherlands, UK | Short term (≤ 2 years) |
| Volatile diesel and CO₂ pricing under EU ETS | −0.3% | EU-wide, long-haul exposed | Medium term (2-4 years) |
| Urban low-emission zones and congestion charges | −0.2% | Major EU cities | Short term (≤ 2 years) |
| Secure truck-parking deficit and cargo-theft risk | −0.1% | Pan-European, acute Italy and France | Medium term (2-4 years) |
| Source: Mordor Intelligence | |||
Driver Shortage and Aging Workforce
Vacancies exceed 400,000 positions across Europe, raising wage pressure and causing contract-load rejections as carriers chase higher spot rates[4]International Road Transport Union, “Driver Shortage Report,” iru.org. Aging demographics in Germany and the United Kingdom intensify the problem, while Brexit complicates cross-channel driver mobility.
Volatile Diesel and CO₂ Pricing Under EU ETS
Quarter-to-quarter diesel swings in 2024, coupled with a EUR 45 (USD 49.66) per-ton CO₂ floor from 2027, make cost forecasting difficult for SMEs lacking hedging capabilities. Alternative-fuel supply constraints further restrict quick mitigation.
Segment Analysis
By End User Industry: Manufacturing Volume Leadership with Retail Momentum
Manufacturing generated 34.77% of the Europe road freight transport market size in 2024, reflecting the continent’s diversified industrial base that requires steady inbound raw-material flows and outbound finished-goods distribution. Automotive, machinery, and electronics plants clustered in Germany, Italy, Poland, and Czechia anchor full-truck-load (FTL) demand along east-west corridors that link factory districts to seaports and consumer hubs. Wholesale and retail trade, backed by double-digit parcel expansion, is projected to grow at a 3.59% CAGR between 2025 and 2030, fragmenting shipment profiles and increasing less-than-truck-load (LTL) frequencies into urban fulfillment centers. Construction sustains constant bulk-material flows, while agriculture and forestry add seasonal peaks that digital load boards are now smoothing through dynamic pricing and rapid capacity calls.
Manufacturing incumbents prefer long-term contracts that stabilize capacity and hedge fuel surcharges, whereas e-commerce retailers embrace spot platforms to secure flexible LTL slots at scale. Chemical, oil, and mining cargoes occupy high-margin niches that rely on ADR-certified tankers and route-specific safety protocols, shielding operators from commoditized rate pressure. Rising pharmaceutical output in Belgium and Switzerland intensifies temperature-controlled capacity needs, nudging fleets to install real-time telematics that verify lane integrity during cross-border journeys. Collectively, these trends keep the Europe road freight transport market anchored in industrial volumes while accelerating services that match omnichannel retail requirements.
Note: Segment shares of all individual segments available upon report purchase
Get Detailed Market Forecasts at the Most Granular Levels
Download PDF
By Destination: Domestic Density Dominates as International Lanes Accelerate
Domestic haulage accounted for 59.65% of the Europe road freight transport market share in 2024, supported by dense national distribution networks and same-day parcel requirements. Germany’s Autobahn grid, France’s national road upgrades, and Spain’s radial highway model underpin high vehicle productivity inside borders. International flows, forecast at a 3.53% CAGR between 2025 and 2030, are gaining traction as near-shoring shifts output from Asia to Central and Eastern Europe, prompting daily cross-channel and Benelux-CEE lane growth. The Netherlands leverages Rotterdam’s port connectivity to stage trans-shipment cargo into Germany and Scandinavia, illustrating how gateway infrastructure multiplies cross-border runs.
Cabotage ceilings, driver rest-time rules, and divergent toll systems still complicate longer routes, driving smaller carriers to partner with digital freight exchanges that automate documentation in multiple languages. Brexit-related customs checks add cost to UK-EU lanes, yet dedicated consolidation hubs in Kent and Calais are shortening clearance windows to preserve service reliability. For the medium term, EU “smart borders” and e-CMR adoption promise to standardize paperwork and cut idle border time, keeping international freight competitive. As a result, the Europe road freight transport market is tilting toward integrated networks that blend domestic density with cross-border reach via technology-enabled compliance.
By Truckload Specification: FTL Scale Advantages Versus LTL Network Innovation
FTL services commanded 82.44% of the Europe road freight transport market size in 2024, favored by manufacturers shipping palletized auto parts, steel coils, and white goods directly to assembly or retail centers with minimal handling risk. Predictable lane lengths and fixed pickup windows let carriers maximize hours-of-service utilization, yielding a competitive cost per kilometer. LTL consignments, advancing at a 3.49% CAGR between 2025 and 2030, flourish on e-commerce parcel densities that justify daily cross-dock departures from hub-and-spoke terminals across Germany, Benelux, and Poland. Digital matching tools are cutting empty back-haul mileage by pairing complementary partial loads in real time, strengthening LTL margins.
Hybrid models are emerging in which operators sell FTL capacity to anchor legs of multi-stop milk-run routes before topping off unused cube with spot LTL pallets, maximizing asset yield. In temperature-controlled niches, multi-compartment reefers handle mixed frozen and chilled SKUs within a single LTL routing plan, meeting grocery e-retail delivery promises. Dynamic routing engines factor urban congestion and low-emission zone windows to align LTL arrival times with store replenishment cycles. Consequently, service differentiation now hinges on API-based visibility, self-billing accuracy, and predictive ETA alerts that extend beyond basic line-haul pricing in the Europe road freight transport market.
By Containerization: Trailer Tradition Prevails Yet Box Volumes Inch Up
Non-containerized cargo retained 88.31% share in 2024, highlighting Europe’s entrenched curtain-sider and mega-trailer fleets that accommodate mixed pallet heights and direct dock loading without crane lifts. Containerized traffic, forecast at a 3.22% CAGR between 2025 and 2030, advances as inland terminals in Duisburg, Antwerp, and Budapest blend rail, barge, and truck transfers under EU modal-shift mandates. Germany’s Rhine-Ruhr region channels Asian imports through combined transport corridors, boosting twenty-foot-equivalent unit (TEU) drayage demand to inland depots. In Italy and Spain, containerized reefer lanes move citrus and wine exports to seaports using genset-equipped chassis.
Cost remains a hurdle: terminal handling charges and chassis scarcity inflate per-unit rates versus direct trailer haulage on domestic trips under 300 km. Yet customs pre-clearance and zero-damage records for sealed boxes attract high-value electronics importers seeking security. EU-funded “green lanes” granting toll discounts to certified intermodal moves are tipping the economics for longer cross-border runs. As infrastructure densifies, container trucking will gradually nibble at trailer share, increasing service diversity in the Europe road freight transport market.
By Distance: Long-Haul Dominance Backed by Corridor Automation
Long-haul corridors of 500 km or more captured 73.62% of the Europe road freight transport market share in 2024, capitalizing on contiguous Schengen borders and uninterrupted motorway stretches, and are expected to grow at a CAGR of 3.28% between 2025 and 2030. The 1,200 km MODI pilot between Rotterdam and Oslo is trialing driver-out platoons that could trim labor costs by up to 40% and raise asset turns by running overnight. Nordic timber, Iberian produce, and Polish automotive streams all rely on multiday cycles that reward fuel-efficient Volvo and Scania Euro-VI tractors equipped with adaptive cruise control. Short-haul legs under 150 km serve urban replenishment and parcel injection points, but congestion fees and tight delivery windows curb productivity.
Medium-distance links between CEE factories and Western consumer markets are emerging as growth hotspots, demanding dual-driver teams to hit 24-hour door-to-door targets. LNG and bio-LNG refueling corridors across Spain, France, and Benelux offer cost parity with diesel on trunk routes, while battery-electric trucks remain confined to urban and regional loops given charging-infrastructure limits. Insurance premiums on long-haul hazmat or high-value cargo spur carriers to invest in 24/7 telemetry and geofencing alarms. Overall, distance-based segmentation is increasingly shaped by fuel strategy and automation readiness within the Europe road freight transport market.

Get Detailed Market Forecasts at the Most Granular Levels
Download PDF
By Goods Configuration: Solid Freight Scale Versus Fluid Niche Growth
Solid goods represented 73.05% of total revenue in 2024, ranging from parcel freight to heavy industrial machinery, and anchoring trailer utilization with predictable loading sequences. E-commerce surge continues to push small-parcel density, while Germany’s machine-tool exports feed high-cube mega-trailer lanes into France and Italy. Construction materials such as precast concrete and timber chips employ open-deck and walking-floor rigs, balancing lightweight parcel backloads. Fluid goods, led by chemicals and refined fuels, is projected to climb at a 3.37% CAGR between 2025 and 2030 as European refineries adopt just-in-time delivery models that fragment order sizes.
Hydrogen pilot lanes from North Sea electrolyzer hubs to German automotive plants are spurring demand for cryogenic tankers with remote pressure-monitoring. Food-grade liquid chocolate and dairy concentrate shipments into Benelux confectionery plants leverage multi-compartment insulated tanks that reduce rinse cycles and deadhead kilometers. Growth in battery-grade electrolyte distribution for gigafactories requires inert-gas blanketing, driving up specialized-equipment investment. These dynamics underline a dual-track trajectory where high-volume solid flows sustain network density and premium fluid cargos advance specialized niches inside the Europe road freight transport market.
By Temperature Control: Ambient Freight Bulk With Cold-Chain Upside
Non-temperature-controlled shipments dominated 94.38% of values in 2024, benefitting from versatile curtainsider fleets and minimal equipment overhead. Retail grocery e-commerce, vaccine distribution, and biologics production together enlarge the temperature-controlled segment at a 3.41% CAGR between 2025 and 2030, nudging carriers toward multi-temperature reefers and ATP-certified containers. Cold-chain operators integrate IoT sensors that stream lane-by-lane temperature logs, essential for EU Good Distribution Practice audits. Rising energy costs prompt the adoption of solar-assisted reefer units and kinetic-energy recovery systems that cut diesel-genset usage during deliveries.
Micro-fulfillment centers in Paris, Berlin, and Madrid require small refrigerated vans capable of accessing zero-emission zones, steering fleets toward battery-electric last-mile vehicles with 250 km range. Pharmaceutical shippers enforce lane-validation protocols, prompting carriers to offer GDP-certified driver training and backup power redundancies. Dairy, meat, and frozen-food exporters in Poland and Denmark are extending shelf life by deploying remote-controlled bulkhead airflow to maintain ±1 °C variance over 2,000 km routes. Enhanced telematics, combined with tight regulatory oversight, will keep cold-chain capacity in high demand within the Europe road freight transport market.
Geography Analysis
Western Europe hosts mature yet technology-progressive freight ecosystems. The United Kingdom contributed 13.57% of the Europe road freight transport market size in 2024, though customs friction post-Brexit inflates compliance costs. Germany, the logistics linchpin, leverages its motorway network and export-oriented manufacturing base, but growth has tapered as the market nears saturation. France’s 42 urban low-emission zones are spurring early fleet electrification trials, positioning carriers for regulatory head starts.
The Netherlands is projected to clock a 4.07% CAGR between 2025 and 2030, anchored by Rotterdam’s port throughput and a highly digitized logistics base. Nordic corridors demand long-distance reliability under severe weather; Sweden’s approval of 34-meter road trains boosts high-volume timber and steel flows. Spain benefits from bi-directional trade with North Africa, leveraging Ro-Ro connectivity via Algeciras and Valencia.
Central and Eastern Europe deliver the fastest structural gains. Poland’s above-50 PMI streak and Romania’s electronics cluster expansions intensify West-bound freight flows. Czechia’s automotive exports, Slovakia’s battery gigafactories, and Hungary’s FDI-backed machinery plants all reinforce corridor growth. Although Russia’s outlook remains volatile amid sanctions, neighboring Baltic and Balkan routes are witnessing redirected flows into EU-compliant customs lanes, preserving momentum for the broader Europe road freight transport market.
Competitive Landscape
The market remains fragmented, leaving space for more than 100,000 SMEs. DSV’s USD 15.8 billion takeover of DB Schenker in April 2025 instantly enlarged network depth and lifted combined annual revenues above EUR 30 billion (USD 33.10 billion). DHL Group opened its Europe Innovation Center in 2025 to scale drone inspections, AI-driven demand forecasting, and EV routing algorithms. Kuehne + Nagel added direct Türkiye–Europe line hauls that cater to near-shoring-boosted volumes.
Digital disruptors such as Transporeon and Sennder broaden capacity liquidity by onboarding micro-fleets, while autonomous-tech startups Einride and Scania target long-haul driver-out operations. Temperature-controlled specialists Hoyer and GXO pursue fleet telemetry and multi-client pharma consolidation hubs.
Competitive intensity is set to climb as EU ETS costs push scale-driven carriers to acquire smaller fleets lacking capital for compliance upgrades, reinforcing the consolidation trajectory within the Europe road freight transport market.
Europe Road Freight Transport Industry Leaders
DHL Group
DSV A/S (De Sammensluttede Vognmænd af Air and Sea)
Kuehne + Nagel
Dachser
Girteka
- *Disclaimer: Major Players sorted in no particular order
Need More Details on Market Players and Competitors?
Download PDF
Recent Industry Developments
- October 2025: DHL Group opened its upgraded Europe Innovation Center in Germany to accelerate tech adoption across supply chains.
- April 2025: DSV completed its acquisition of DB Schenker for EUR 14.3 billion (USD 15.8 billion).
- April 2025: Kuehne + Nagel launched new Türkiye–Europe direct line hauls to capitalize on near-shoring demand.
- October 2024: DACHSER broke ground on a 6,500 m² transit terminal and 6,770 m² warehouse in Ingolstadt.
Europe Road Freight Transport Market Report Scope
Agriculture, Fishing, and Forestry, Construction, Manufacturing, Oil and Gas, Mining and Quarrying, Wholesale and Retail Trade, Others are covered as segments by End User Industry. Domestic, International are covered as segments by Destination. Full-Truck-Load (FTL), Less than-Truck-Load (LTL) are covered as segments by Truckload Specification. Containerized, Non-Containerized are covered as segments by Containerization. Long Haul, Short Haul are covered as segments by Distance. Fluid Goods, Solid Goods are covered as segments by Goods Configuration. Non-Temperature Controlled, Temperature Controlled are covered as segments by Temperature Control. France, Germany, Italy, Netherlands, Nordics, Russia, Spain, United Kingdom are covered as segments by Country.End User Industry
| Agriculture, Fishing, and Forestry |
| Construction |
| Manufacturing |
| Oil and Gas, Mining and Quarrying |
| Wholesale and Retail Trade |
| Others |
Destination
| Domestic |
| International |
Truckload Specification
| Full-Truck-Load (FTL) |
| Less than-Truck-Load (LTL) |
Containerization
| Containerized |
| Non-Containerized |
Distance
| Long Haul |
| Short Haul |
Goods Configuration
| Fluid Goods |
| Solid Goods |
Temperature Control
| Non-Temperature Controlled |
| Temperature Controlled |
Country
| France |
| Germany |
| Italy |
| Netherlands |
| Nordics |
| Russia |
| Spain |
| United Kingdom |
| Rest of Europe |
| End User Industry | Agriculture, Fishing, and Forestry |
| Construction | |
| Manufacturing | |
| Oil and Gas, Mining and Quarrying | |
| Wholesale and Retail Trade | |
| Others | |
| Destination | Domestic |
| International | |
| Truckload Specification | Full-Truck-Load (FTL) |
| Less than-Truck-Load (LTL) | |
| Containerization | Containerized |
| Non-Containerized | |
| Distance | Long Haul |
| Short Haul | |
| Goods Configuration | Fluid Goods |
| Solid Goods | |
| Temperature Control | Non-Temperature Controlled |
| Temperature Controlled | |
| Country | France |
| Germany | |
| Italy | |
| Netherlands | |
| Nordics | |
| Russia | |
| Spain | |
| United Kingdom | |
| Rest of Europe |
Need A Different Region or Segment?
Customize Now
Market Definition
- Agriculture, Fishing, and Forestry (AFF) - This end user industry segment captures the external (outsourced) logistics expenditure incurred by the AFF industry players on road freight transport service. The end user players considered are the establishments primarily engaged in growing crops, raising animals, harvesting timber, harvesting fish & other animals from their natural habitats and providing related support activities. Herein, across the value chain, Logistics Service Providers (LSPs) play a crucial role in acquisition, storage, handling, transportation, and distribution activities for the optimal & continuous flow of inputs (seeds, pesticides, fertilizers, equipment, and water) from manufacturers or suppliers to the producers and smooth flow of output (produce, agro-goods) to distributors/ consumers. This includes both termperature controlled and non-temperature controlled logistics, as and when required according to the shelf life of goods being transported or stored.
- Construction - This end user industry segment captures the external (outsourced) logistics expenditure incurred by the construction industry players, on road freight transport service. The end user players considered are the establishments primarily engaged in constructing, repairing and renovating residential & commercial buildings, infrastructure, engineering works, subdividing and developing land. Logistics Service Providers (LSPs) play a crucial role in increasing profitability of construction projects by maintaing the inventory of raw materials & equipment, time-critical supplies and by providing other value added services for effective project management.
- Containerized Road Freight Transport - The segment captures the external (outsourced) logistics expenditure incurred by the road freight transport service end users on Full-Truck-Load (FTL) services. FTL road freight transport is characterized as a full single load not combined with other shipments. It comprises of shipments (i) devoted to the goods of a single shipper (ii) taken directly from a point of origin to one or more destination points (iii) comprising of bulk mail truck transportation (iv) comprising of both Container (Full Container Load, FCL)/Non-Container trucking services (v)comprsing of goods requiring temperature controlled or non-temperature controlled transportation services (vi) comprising of bulk liquid tankering (vii) invoving trucking of waste (viii) hazardous material trucking. Related value added services (VAS) of sorting, consolidation, deconslidation are included in the other services segment of freight and logistics market.
- Export Trends and Import Trends - Overall logistics performance of an economy is positively and significantly (statistically) correlated to its trade performance (exports and imports). Hence, in this industry trend, total value of trade, major commodities/ commodity groups and the major trade partners, for the studied geography (country or region as per the scope of report) have been analysed alongside the impact of major trade/logistics infrastructure investments & regulatory environment.
- Fluid Goods - The segment captures the external (outsourced) logistics expenditure incurred by the road freight transport service end users for the transport of bulk liquids, that are often used in extraction, manufacturing, food processing, agriculture industries among others. It includes transportation of liquids like (i) Chemicals/ hazardous goods (for instance acids) (ii) Water (potable as well as waste) (iii) Oil and gas (upstream as well as downstream like gasoline, fuel, crude oil, or propane), (iv) Food grade bulk liquids (like milk, or juice), (v) Rubber, (vi) Agrichemical products, among others. These goods are generally transported through tanker trucking.
- Fuel Price - Fuel price spikes can cause delays and diruption for logistics service providers (LSPs), while drops in the same can result in higher short-term profitability and increased market rivalry to offer consumers with the best deals. Hence, the fuel price variations have been studied over the review period and presented along with the causes as well as market impacts.
- Full-Truck-Load (FTL) Road Freight Transport - The segment captures the external (outsourced) logistics expenditure incurred by the road freight transport service end users on Full-Truck-Load (FTL) services. FTL road freight transport is characterized as a full single load not combined with other shipments. It comprises of shipments (i) devoted to the goods of a single shipper (ii) taken directly from a point of origin to one or more destination points (iii) comprising of bulk mail truck transportation (iv) comprising of both Container (Full Container Load, FCL)/Non-Container trucking services (v)comprsing of goods requiring temperature controlled or non-temperature controlled transportation services (vi) comprising of bulk liquid tankering (vii) invoving trucking of waste (viii) hazardous material trucking. Related value added services (VAS) of sorting, consolidation, deconslidation are included in the other services segment of freight and logistics market.
- GDP Distribution by Economic Activity - Nominal Gross Domestic Product and distribution of the same, across major economic sectors in the geography studied (country or region as per scope of the report) have been studied and presented in this industry trend. As GDP is positively related to the profitability and growth of logistics industry, this data has been used in adjunction to the input-output tables/ supply-use tables for analyzing the potential major contributing sectors towards the logistics demand.
- GDP Growth by Economic Activity - Growth of Nominal Gross Domestic Product across major economic sectors, for the geography studied (country or region as per scope of the report) have been presented in this industry trend. This data has been utilized for assessing the growth of logistics demand from all the market end users (economic sectors considered here).
- Inflation - Variations in both Wholesale Price Inflation (YoY change in producer price index) and Consumer Price Inflation have been presented in this industry trend. This data has been used to assess the inflationary environment as it plays a vital role in smooth functioning of the supply chain, directly impacting the logistics operational cost components e.g., pricing of tyres, driver wages & benefits, energy/fuel prices, maintenace costs, toll charges, warehousing rents, custom brokerage, forwarding rates, courier rates etc. hence impacting the overall freight and logistics market.
- Key Industry Trends - The report section named "Key Industry Trends" include all the key variables/parameters studied to better analyze the market size estimates and forecasts. All the trends have been presented in the form of data points (time series or latest available data points) along with analysis of the paramter in the form of concise market relevant commentary, for the geography studied (country or region as per the scope of report).
- Key Strategic Moves - The action taken by a company to differentiate from its competitor or used as a general strategy is referred to as a key strategic move (KSM). This includes (1) Agreements (2) Expansions (3) Financial Restructuring (4) Mergers and Acquisitions (5) Partnerships, and (6) Product Innovations. Key players (Logistics Service Providers, LSPs) in the market have been shortlisted, their KSM have been studied and presented in this section.
- Less than-Truck-Load (LTL) Road Freight Transport - The segment captures the external (outsourced) logistics expenditure incurred by the road freight transport service end users on Less than-Truck-Load (LTL) services. LTL road freight transport is characterized as multiple shipments combined onto a single truck for multiple deliveries within a network. It comprises of establishments (i) primarily engaged in general and specialized freight trucking of less than complete truck-loads, (ii) characterized by the use of terminals to consolidate shipments, generally from several shippers, into a single truck for haulage between a load assembly terminal and a disassembly terminal, where the load is sorted and shipments are re-routed for delivery (iv) Less than-Container-Load (LCL) shipping/ Groupage Shipping in case of trucking services. The activities in scope include (i) local pick-up, (ii) line-haul, and (iii) local delivery. Related value added services (VAS) of sorting, consolidation, deconslidation are included in the other services segment of freight and logistics market.
- Logistics Performance - Logistics Performance and Logistics Costs are the backbone of trade, and influences trade costs, making countries compete globally. Logistics performance is influenced by market wide adopted supply chain management strategies, government services, investments & policies, fuel/ energy costs, inflationary environment etc. Hence, in this industry trend, the logistics performance of the geography studied (country/ region as per the scope of report) has been analysed and presented over the review period.
- Major Truck Suppliers - Market share of truck brands is influenced by factors like geographical preferences, portfolio of truck types, truck prices, local production, truck repair & maintenance service peneteration, customer support, technological innovations (like electric vehicles, digitalization, autonomous trucks), fuel efficiency, financing options, annual maintenance costs, availability of substitutes, marketing startegies etc. Hence, the distribution (share % for base year of the study) of truck sales volume for leading truck brands and commentary on current market scenario & market anticipation over the forecast period have been presented in this industry trend.
- Manufacturing - This end user industry segment captures the external (outsourced) logistics expenditure incurred by the Manufacturing industry players, on road freight transport service. The end user players considered are the establishments primarily engaged in the chemical, mechanical or physical transformation of materials or substances into new products. Logistics Service Providers (LSPs) play a crucial role in maintaining a smooth flow of raw materials across the supply chain, enabling timely delivery of finished goods to distributors or end customers and storing & supplying the raw materials to clients for just-in-time manufacturing.
- Modal Share - Freight Modal Share is influenced by factors like modal productivity, government regulations, containerization, distance of shipment, temperature control requirements, type of goods, international trade, terrain, speed of delivery, shipment weight, bulk shipments, etc. Also, modal share by tonnage (tons) and modal share by freight turnover (ton-km) differ as per average distance of shipments, weight of major commodity groups transported in the economy and number of trips. This industry trend represents the distribution of freight transported by mode of transport (tons as well as ton-km), for the study base year.
- Oil and Gas, Mining and Quarrying - This end user industry segment captures the external (outsourced) logistics expenditure incurred by the extraction industry players, on road freight transport service. The end user players considered are the establishments that extract naturally occurring mineral solids, such as coal and ores; liquid minerals, such as crude petroleum; and gases, such as natural gas. Logistics Service Providers (LSPs) covers entire phases from upstream to downstream and plays a crucial role in the transportation of machinery, drilling equipments, extracted minerals, crude oil & natural gas and refined/ processed products from one place to another.
- Other End Users - Other end user segment captures the external (outsourced) logistics expenditure incurred by the financial services (BFSI), real estate, educational services, healthcare, and professional services (administrative, waste management, legal, architectural, engineering, design, consulting, scientific R&D), on road freight transport service. Logistics Service Providers (LSPs) plays a crucial role in the reliable movement of supplies and documents to/from these industries such as transporting any equipment or resources required, shipping confidential documents and files, movement of medical goods & supplies (surgical supplies and instruments, including gloves, masks, syringes, equipment) to name a few.
- Producer Price Inflation - It indicates inflation from viewpoint of the producers viz. the average selling price received for their output over a period of time. Annual change (YoY) of producer price index is reported as wholesale price inflation in the "Inflation" industry trend. As WPI captures dynamic price movements in most comprehensive way, it is widely used by governments, banks, industry, business circles and is deemed important in formulation of trade, fiscal and other economic policies. The data has been used in adjunction to consumer price inflation for better understanding the inflationary environment.
- Road Freight Pricing Trends - Freight pricing by mode of transport (USD/tonkm), over the review period, has been presented in this industry trend. The data has been used in assessing the inflationary environment, impact on trade, freight turnover (tonkm), road freight transport market demand and hence the road freight transport market size.
- Road Freight Tonnage Trends - Freight tonnage (weight of goods in tons) handled by mode of transport, over the review period, has been presented in this industry trend. The data has been used as one of the parameters apart from average distance per shipment (km), freight volume (tonkm), and freight pricing (USD/tonkm) to assess the freight transport market size.
- Road Freight Transport - Hiring a road freight transport logistics service provider (LSP) or haulier (outsourced logistics), for the transport of commodities constitutes road freight transport market. The scope of study includes (i) road transport of goods reported by hauliers registered in the reporting countries (ii) transport of raw materials or manufactured goods (solids as well as fluids) (iii) transport using commerical motor vehicles (rigid trucks or tractor-trailers, (iv) Full-Truck-Load (FTL) or Less than-Truck-Load (LTL) transport (v) containerized or non-containerized transport (vi) temperature controlled or non-temperature controlled trasnport, (vii) short haul or long haul (Over-the-road, OTR) transport, (viii) used office or household goods transport (movers and packers), (ix) other specialized cargo transport (dangerous goods, oversized cargo) and (x) outsourced first mile/ middle mile/last mile delivery shipments undertaken by road freight transport players. The scope does not include (i) transport undertaken by hauliers registered in other countries (ii) last mile meal delivery market (iii) grocery delivery market (iv) transportation via road network undertaken/ reported by Courier, Express, and Parcel (CEP) players.
- Road Length - As infrastructure plays a vital role in an economy's logistics performance, variables like length of roads, distribution of road length by surface category (paved v/s unpaved), distribution of road length by road classification (expressways v/s highways v/s other roads), have been analysed and presented in this industry trend.
- Segmental Revenue - Segmental Revenue has been triangulated or computed and presented for all the major players in the market. It refers to the road freight transport market specific revenue earned by the company, over the base year of study, in the geography studied (country or region as per the scope of report). It is computed through the study and analysis of major parameters like financials, service portfolio, employee strength, fleet size, investments, number of countries present in, major economies of concern, etc. that have been reported by the company in its annual reports, webpage. For companies having scarce financial disclosures, paid databases like D&B Hoovers, Dow Jones Factiva have been resorted to and verified through industry/expert interactions.
- Short Haul Road Freight Transport - The segment captures the external (outsourced) logistics expenditure incurred by the road freight transport service end users on local trucking (less than 100 miles). It includes the road transport of goods (i) within a single administrative area and its hinterland, (ii) by smaller trucks and pickup trucks (iii) via containerized as well as dry bulk services (iv) intermodal from ports, container terminals or airports, and (v) outsourced first mile/ last mile delivery shipments undertaken by road freight transport players.
- Transport and Storage Sector GDP - Value and growth of Transport and Storage Sector GDP has a direct relation to the freight and logistics market size, and hence road freight transport market size. Therefore, this variable has been studied and presented over the review period, in value terms (USD) and as share % of total GDP, in this industry trend. The data has been supported by concise and relevant commentary around the investments, developments, and current market scenario.
- Trends in E-Commerce Industry - Enhanced internet connectivity and boom in smartphone penetration, coupled with increasing disposable incomes, has led to a phenomenal growth in the e-commerce market globally. Online shoppers require fast and efficient delivery of their orders leading to an increase in the demand for logistics services especially e-commerce fulfilment services. Hence, the Gross Merchandise Value (GMV), historial and projected growth, breakup of major commodity groups in e-commerce industry for the studied geography (country or region as per scope of the report) have been analysed and presented in this industry trend.
- Trends in Manufacturing Industry - Manufacturing industry involves the transformation of raw materials into finished products, while logistics industry ensures the efficient flow of raw materials to the factory, and the transport of manufactured products to the distributors & consumers. Demand-Supply of both industries are highly cross-linked and critical for a seamless supply chain. Hence, the Gross Value Added (GVA), breakup of GVA into major manufacturing sectors, and growth of manufacturing industry over the review period have been analysed and presented, in this industry trend.
- Trucking Fleet Size By Type - Market share of truck types is influenced by factors like geographical preferences, major end user industries, truck prices, local production, truck repair & maintenance service peneteration, customer support, technological disruptions (like electric vehicles, digitalization, autonomous trucks) etc. Hence, the distribution (share % for base year of study) of truck parc volume by type of truck, market disruptors, truck manufacturing investments, truck specifications, truck use & import regulations, and market anticipation over the forecast period have been presented in this industry trend.
- Trucking Operational Costs - The prime reasons for measuring/ benchmarking logistics performance of any trucking company are to reduce operational costs and increase profitability. On the other hand, measuring operational costs helps to identify whether and where to make operational changes to control expenses and identify areas for improved performance. Hence, in this industry trend, trucking operational costs and the variables involved viz. driver wages & benefits, fuel prices, repairs & maintenance costs, tyre costs etc. have been studied over the base year of study, and presented for the geography studied (country or region as per the scope of report).
- Wholesale and Retail Trade - This end user industry segment captures the external (outsourced) logistics expenditure incurred by the wholesalers and retailers, on road freight transport service. The end user players considered are the establishments primarily engaged in wholesaling or retailing merchandise, generally without transformation, and rendering services incidental to the sale of merchandise. Logistics Service Providers (LSPs) plays a crucial role in the reliable movement of supplies to and finished products from production houses to the distributors and finally to the end customer covering activites like material sourcing, transportation, order fulfillment, warehousing & storage, demand forecasting, inventory management etc.
| Keyword | Definition |
|---|---|
| Cabotage | Road transport by a motor vehicle registered in a country performed on the national territory of another country. |
| Cross Docking | Cross docking is a logistics procedure where products from a supplier or manufacturing plant are distributed directly to a customer or retail chain with marginal to no handling or storage time. Cross docking takes place in a distribution docking terminal; usually consisting of trucks and dock doors on two (inbound and outbound) sides with minimal storage space. The name ‘cross docking’ explains the process of receiving products through an inbound dock and then transferring them across the dock to the outbound transportation dock. |
| Cross Trade | International road transport between two different countries performed by a road motor vehicle registered in a third country. A third country is a country other than the country of loading/embarkation and than the country of unloading/disembarkation. |
| Dangerous Goods | The classes of dangerous goods carried by Road are those defined by the fifteenth revised edition of the UN Recommendations on the Transport of Dangerous Goods, United Nations, Geneva 2007. They include Class 1: Explosives; Class 2: Gases; Class 3: Flammable Liquids; Class 4: Flammable solids- substances liable to spontaneous combustion; substances which, on contact with water, emit flammable gases; Class 5: Oxidizing substances and organic peroxides; Class 6: Toxic and infectious substances; Class 7: Radioactive material and Class 8: Corrosive substances, Class 9: Miscellaneous dangerous substances and articles. |
| Direct Shipment | Direct shipment is a method of delivering goods from the supplier or the product owner to the customer directly. In most cases, the customer orders the goods from the product owner. This delivery scheme reduces transportation and storage costs, but requires additional planning and administration. |
| Drayage | A drayage is a form of trucking service that connects the different modes of shipping (intermodal), such as ocean freight or air freight. It’s a short-haul trip that transports goods from one place to another, usually before or after its long-haul shipping process. Drayage trucks move cargo to and from various destinations, such as container ships, storage lots, order fulfillment warehouses, and rail yards. Typically, drayage only transports goods in short distances and operates only in one metropolitan area. It also requires only one trucker in a single shift. But despite this, but it plays an important role in long-haul shipping because it gets the goods to the cargo and vice versa. It makes intermodal transport much more efficient and enables the seamless transfer of goods to the end customer. |
| Dry van | A dry van is a type of semi-trailer that's fully enclosed to protect shipments from outside elements. Designed to carry palletized, boxed or loose freight, dry vans aren't temperature-controlled (unlike refrigerated “reefer” units) and can't carry oversized shipments (unlike flatbed trailers). |
| Final Demand | Final demand includes all types of commodities (goods as well as services) consumed as final use and might include personal consumption, or consumption by government, by businesses as capital investment, and as exports. includes all types of commodities (goods as well as services) consumed as final use and might include personal consumption, or consumption by government, by businesses as capital investment, and as exports. |
| Flatbed Truck | A flatbed truck is a type of truck with rigid design. It has a back body that is flatly shaped for easy loading and unloading of goods. The flatbed truck is mostly used to transport heavy, oversized, wide and indelicate goods such as machinery, building supplies or equipment. Due to the truck open body, the goods transported with it must not be vulnerable to rain. By functionality, the flatbed truck is comparable to a flatbed trailer. |
| Inbound Logistics | Inbound logistics is the way materials and other goods are brought into a company. This process includes the steps to order, receive, store, transport and manage incoming supplies. Inbound logistics focuses on the supply part of the supply-demand equation. |
| Intermediate Demand | Intermediate demand includes goods, services, and maintenance and repair construction sold to businesses, excluding capital investment. |
| International Loaded | Place of loading of goods in reporting country (i.e., country in which the vehicle performing the transport is registered) and place of unloading in a different country. |
| International Unloaded | Place of unloading of goods in reporting country (i.e., country in which the vehicle performing the transport is registered) and place of loading in a different country. |
| OOG cargo | Out of Gauge (OOG) cargo is any cargo that can not be loaded into six-sided shipping containers simply because it is too large. The term is a very loose classification of all cargo with dimensions beyond the maximum 40HC container dimensions. That is a length beyond 12.05 meters – a width beyond 2.33 meters – or a height beyond 2.59 meters. |
| Pallets | Raised platform, intended to facilitate the lifting and stacking of goods. |
| Part load | A part load describes goods which only fills a truck partially. In essence, the quantity of the shipment is bigger than the Less Than Truckload (LTL) shipment. Also, the shipment cannot fully occupy a truck i.e. its capacity is much lower than a Full Truckload (FTL) shipment. |
| Paved Road | Road surfaced with crushed stone (macadam) with hydrocarbon binder or bituminized agents, with concrete or with cobblestone. |
| Reverse Logistics | Reverse logistics comprises of the sector of supply chains that process anything returning inwards through the supply chain or traveling ‘backward’ through the supply chain. |
| Road Freight Transport Service | Hiring a trucking agency for transport of commodities (raw materials or manufactured goods including both solids and liquids) form the origin to a destination within the country (domestic) or cross-border (international) constitutes road freight transport market. The service might be Full-Truck-Load or Less than-Truck-Load, containerized or non-containerized, temperature controlled or non temperature controlled, short haul or long haul. |
| Tautliner vehicle | Tautliner and curtainsider are used as generic names for curtain sided trucks/trailers. The curtains are permanently fixed to a runner at the top and detachable rails/poles at front and rear, allowing the curtains to be drawn open and forklifts used all along the sides for easy and efficient loading and unloading. When closed for travel, vertical load restraint straps are attached to a rope rail beneath the truck bed, connecting the truck bed and curtain along both sides. Winches at either end of the curtain tension it, hence the 'Tautliner' name. This stops the curtain from flapping or drumming in the wind and can also help retain light loads from slipping sideways. |
| Transport for hire or reward | The carriage for remuneration of goods. |
| Unpaved Road | Road with a stabilized base not surfaced with crushed stone, hydrocarbon binder or bituminized agents, concrete or cobblestone. |
Need More Details on Market Definition?
Ask a Question
Research Methodology
Mordor Intelligence follows a four-step methodology in all our reports.
- Step-1: Identify Key Variables: In order to build a robust forecasting methodology, the variables and factors identified in Step-1 are tested against available historical market numbers. Through an iterative process, the variables required for market forecast are set and the model is built on the basis of these variables.
- Step-2: Build a Market Model: Market-size estimations for the forecast years are in nominal terms. Inflation is considered to be a part of the pricing, and the average selling price (ASP) is varying throughout the forecast period for each country
- Step-3: Validate and Finalize: In this important step, all market numbers, variables and analyst calls are validated through an extensive network of primary research experts from the market studied. The respondents are selected across levels and functions to generate a holistic picture of the market studied.
- Step-4: Research Outputs: Syndicated Reports, Custom Consulting Assignments, Databases & Subscription Platforms

Get More Details On Research Methodology
Download PDF


