
Market Overview
| Study Period | 2020 - 2031 |
|---|---|
| Forecast Data Period | 2026 - 2031 |
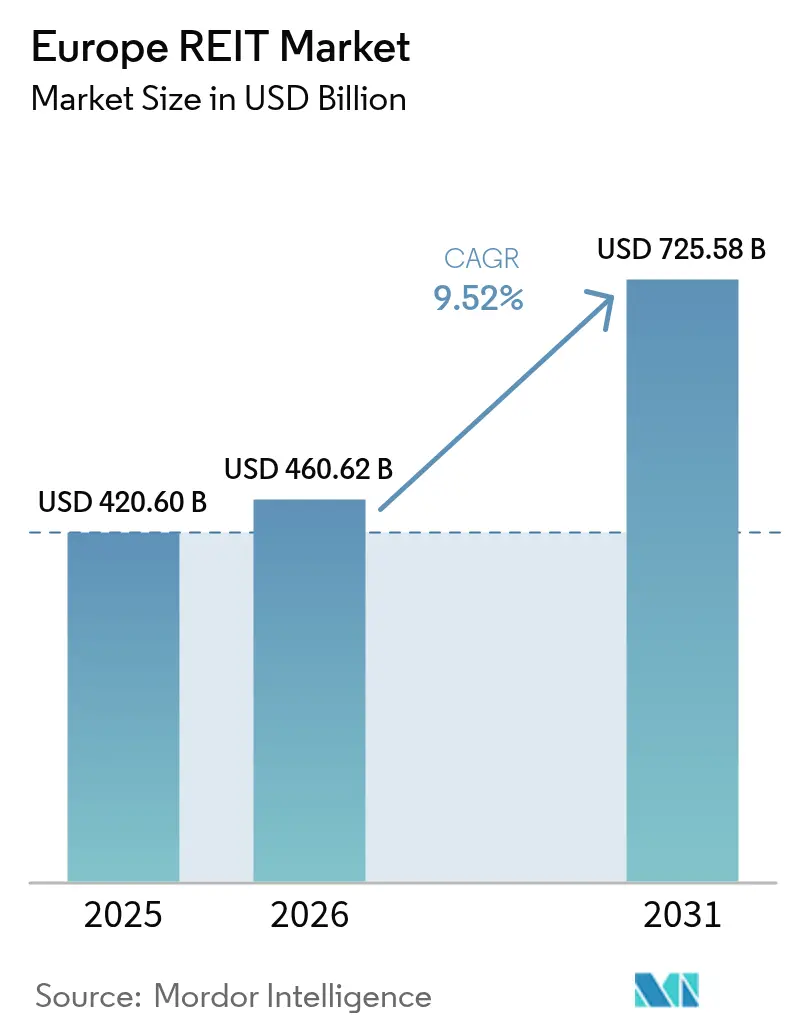
| Base Year Market Size (2025) | USD 420.60 Billion |
| Market Size (2026) | USD 460.62 Billion |
| Market Size (2031) | USD 725.58 Billion |
| Growth Rate (2026 - 2031) | 9.52 % |
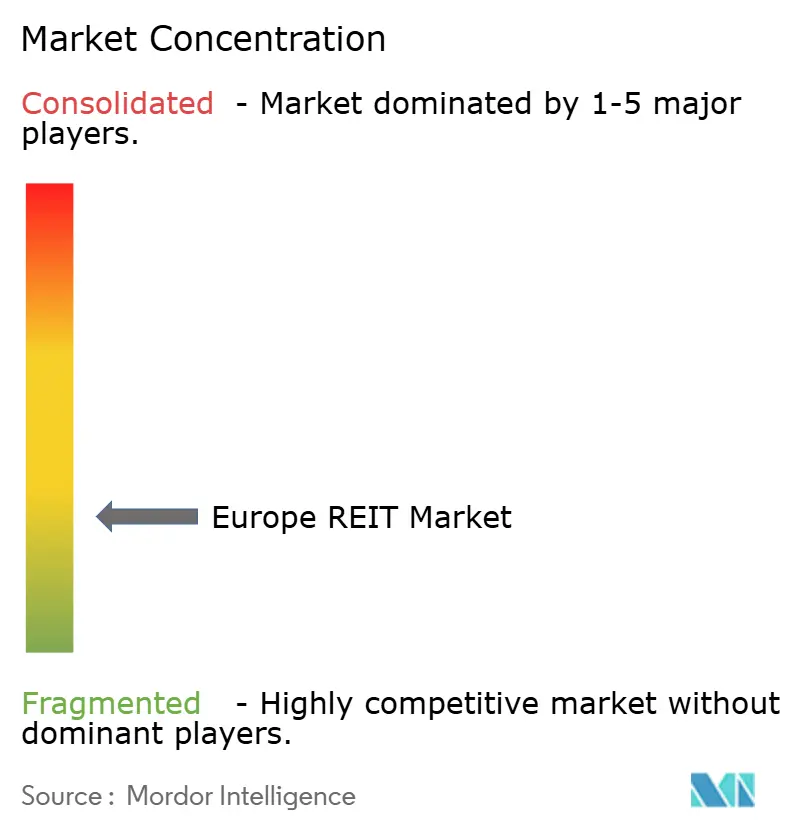
| Market Concentration | Low |
Major Players *Disclaimer: Major Players sorted in no particular order Image © Mordor Intelligence. Reuse requires attribution under CC BY 4.0. | |
Europe REIT Market Analysis by Mordor Intelligence
The Europe REIT market size is expected to grow from USD 420.60 billion in 2025 to USD 460.62 billion in 2026 and is forecast to reach USD 725.58 billion by 2031 at 9.52% CAGR over 2026-2031. Six interrelated forces sustain this momentum: moderated borrowing costs under the European Central Bank’s (ECB) carefully sequenced rate-cutting cycle, deep institutional appetite for inflation-adjusted yields, enduring e-commerce logistics demand, rising data-center build-outs, expanding municipal partnerships for affordable housing, and supportive EU-wide capital-markets reforms such as ELTIF 2.0. Rising refinancing costs after 2024 created near-term volatility, yet well-capitalized vehicles refinanced at spreads still below the twenty-year average, protecting cash-flow coverage and preserving distribution visibility. Sector rotation into industrial and data-center assets compresses cap rates faster than in retail and secondary office segments, which now price in meaningful hybrid-working vacancy risk. Listed vehicles increasingly rely on sustainability-linked debt to fund green retrofits, turning energy-performance regulations from a cost overhang into a competitive differentiator with tenants and investors alike. The landscape remains fragmented—top-five players control only 31% of capitalization—which leaves ample room for consolidation plays by sponsors that can shoulder stricter covenant packages.
Key Report Takeaways
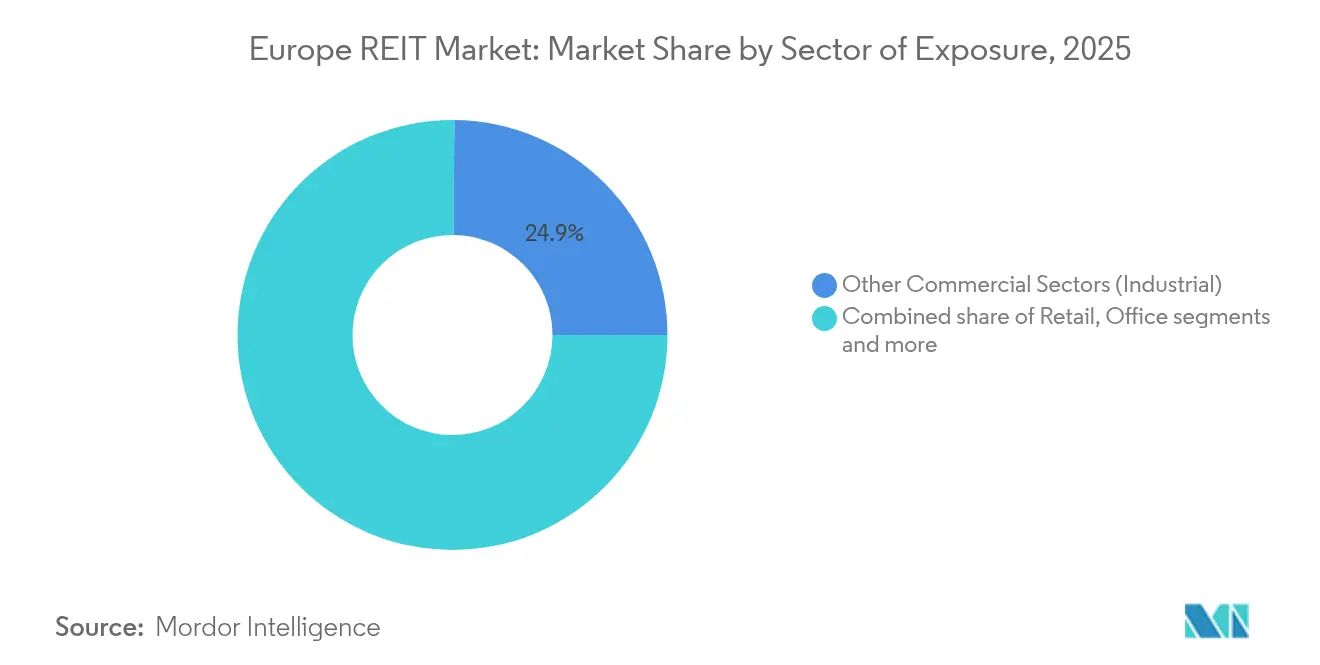
- By sector, industrial properties (under the other commercial sectors) led with a 24.86% Europe REIT market share in 2025, while data centers (under the other commercial sectors) are forecast to post a 10.18% CAGR to 2031.
- By market capitalization, large-cap vehicles held 46.92% of the Europe REIT market size in 2025, and small-cap platforms are projected to expand at a 9.78% CAGR through 2031.
- By geography, the United Kingdom captured 40.21% of the Europe REIT market share in 2025, whereas the Nordics are on track for an 8.11% CAGR to 2031.
Note: Market size and forecast figures in this report are generated using Mordor Intelligence’s proprietary estimation framework, updated with the latest available data and insights as of 2026.
Market Trends and Insights
Drivers Impact Analysis of Europe REIT Market*
| Driver | (~) % Impact on CAGR Forecast | Geographic Relevance | Impact Timeline |
|---|---|---|---|
| Measured ECB rate-cutting cycle | +1.8% | Eurozone core, spill-over to UK | Medium term (2-4 years) |
| E-commerce-led logistics absorption | +2.1% | Germany, Netherlands, UK corridors | Long term (≥ 4 years) |
| Inflation-hedged institutional inflows | +1.4% | France, Germany, pan-regional pension funds | Short term (≤ 2 years) |
| EU ELTIF 2.0 retail-capital gateway | +0.9% | All EU-27 member states | Medium term (2-4 years) |
| Municipal affordable-housing programs | +0.7% | Germany, Netherlands, Nordic capitals | Long term (≥ 4 years) |
| Tokenized real estate secondary markets | +0.3% | Luxembourg, Netherlands | Long term (≥ 4 years) |
| Source: Mordor Intelligence | |||
Sustained ECB Rate Moderation
The central bank cut policy rates by 50 basis points across 2024-2025, allowing well-rated REITs to roll maturities at sub-4% coupons while still attracting overseas capital seeking positive real yields[1]. Liability management now extends weighted-average debt maturities beyond five years, shielding cash flows during forecast tightening cycles. Transatlantic rate divergence added relative-value appeal, prompting U.S. pension plans to raise strategic allocations. Germany’s Vonovia exemplified the trend by closing USD 1.60 billion in syndicated loans at favorable spreads, preserving its investment-grade status. If inflation expectations re-anchor lower, the carry trade could narrow and reduce incremental fund inflows, but base-case forecasts still assume credit spreads remain below the 20-year mean. Consequently, financing visibility continues to underpin dividend stability across the Europe REIT market.
E-Commerce-Driven Logistics Expansion
European online sales penetration rose to 16% of retail turnover in 2024, tripling warehouse needs relative to brick-and-mortar formats[2]. Grade-A facilities within 50 kilometres of dense population clusters now command rental uplifts exceeding 8% annually, outpacing headline CPI. Segro accelerated this pattern by accumulating 15 infill plots in Germany and the Netherlands that shorten delivery radii to less than 20 minutes. Development pipelines remain disciplined because land constraints and zoning hurdles cap speculative supply, protecting occupancy north of 97%. Cross-border fulfillment standards under the EU customs union further stimulate demand for pan-regional hubs with advanced automation. As a result, logistics remains the anchor growth pillar of the Europe REIT market for the foreseeable horizon.
Institutional Inflows Looking for Inflation Hedges
Large pension funds rotated USD 50 billion into listed real estate during 2024, drawn by CPI-linked leases unavailable in sovereign-bond portfolios[3]. Cash-flow indexation clauses safeguard real returns when consumer prices exceed 2.5% thresholds. Dutch asset owner APG lifted its allocation to 4.2% of AUM, citing superior correlation benefits. The long-duration nature of these mandates lowers unit-share volatility because redemptions track actuarial projections rather than market sentiment. These sticky flows have cushioned price swings during sudden rate repricings, supporting liquidity and tightening bid-ask spreads. Over time, structural pension de-risking into real assets will likely deepen, reinforcing the asset-class premium enjoyed by the Europe REIT market.
ELTIF 2.0 Retail Capital Access
The 2024 overhaul of the European Long-Term Investment Fund regime abolished high entry minima and simplified passporting, opening doors for mass-affluent savers to buy listed property funds via bancassurance channels. French managers launched the first compliant REIT wrappers in 2025, targeting USD 2.14 billion in subscriptions. Retail flows tend to be more stable than institutional rebalancing, extending valuation support during periods of market stress. Compliance, however, entails granular disclosure and liquidity-buffer obligations that smaller issuers may find onerous. Those electing not to adopt the framework could forfeit growing retail demand, accelerating scale-driven consolidation. Net-net, ELTIF 2.0 increases the breadth of the Europe REIT market’s investor universe.
Restraints Impact Analysis of Europe REIT Market*
| Restraint | (~) % Impact on CAGR Forecast | Geographic Relevance | Impact Timeline |
|---|---|---|---|
| Refinancing costs after 2024 rate hikes | -2.3% | Eurozone, UK, Switzerland | Short term (≤ 2 years) |
| Hybrid working reduces office demand | -1.7% | London, Paris, Frankfurt CBDs | Medium term (2-4 years) |
| EPC C-rating retrofit capex cliff | -1.1% | All EU-27 commercial stock | Medium term (2-4 years) |
| Tightening ESG-linked debt covenants | -0.8% | Northern Europe, global lenders | Long term (≥ 4 years) |
| Source: Mordor Intelligence | |||
Hybrid Work Shakes Office Utilization
Average office attendance settled near 65% of 2019 baselines by 2025, yet occupancy divergence between prime CBD towers and suburban stock has widened[4]. Land Securities’ West End assets maintain waiting lists, whereas secondary London periphery blocks face structural vacancy above 15%. Tenants prioritize wellness amenities and high-efficiency ventilation, forcing landlords to offer capital-intensive fit-outs that dilute initial yields. Flexible-lease providers absorb some footprint risk, but their month-to-month contracts introduce revenue volatility for host REITs. Office-heavy vehicles now pivot to mixed-use or life-science conversions to preserve relevance. Without adaptive strategies, office exposure will continue to weigh on the Europe REIT market’s blended growth.
Stricter ESG-Linked Debt Covenants
Lenders now embed sustainability-performance targets into revolving credit facilities, tying margin ratchets to annual emission-intensity reductions. Northern European banks lead adoption, pushing spreads 25-30 basis points wider for borrowers that miss milestones. Digital Realty Trust’s 2025 green bond raised USD 1.07 billion at 35 35-basis-point discount, proving that compliance pays when executed credibly. Smaller borrowers struggle with data-collection requirements and may pay higher all-in coupons. Over time, covenant convergence will crowd out laggards, effectively raising the baseline cost of capital for non-aligned portfolios. As reporting rigor increases, credibility around ESG delivery will become integral to valuation within the Europe REIT market.
*Our forecasts treat driver/restraint impacts as directional, not additive. The impact forecasts reflect baseline growth, mix effects, and variable interactions.
Europe REIT Market Segment Analysis
By Sector of Exposure:
Industrial Leadership Anchors GrowthIndustrial assets (under the other commercial sectors) delivered 24.86 of % Europe REIT market share in 2025, underscoring irreplaceable e-commerce fulfillment needs close to consumption nodes. Rental escalations averaged 8% year-on-year across Germany’s Rhine-Ruhr corridor, sustaining cap-rate compression to sub-4% levels. Data centers (under the other commercial sectors) posted the fastest growth, with a forecast 10.18% CAGR to 2031 underpinned by hyperscale and edge deployments requiring high-density power envelopes. Diversified vehicles now bundle last-mile warehouses with micro-data-hubs, creating blended income resilient to consumer-spending cycles. Residential REITs hold an enduring 24.73% share, leveraging urban housing undersupply and index-linked leases that hedge inflation. Meanwhile, retail footprints continue to rationalize, as experiential malls outperform vanilla shopping centers by capturing spill-over footfall from leisure anchors. This sectoral hierarchy illustrates how technological shifts and demographic constraints shape capital allocation inside the Europe REIT market.
Industrial dominance persists because brownfield availability near major ports is scarce, limiting disruptive oversupply. Segro’s cross-docking design cuts average delivery windows by 22 minutes, a tangible economic advantage for tenants facing tight consumer-delivery promises. In data centers, Digital Realty expanded inter-connect nodes in Brussels and Vienna, monetizing cross-connect fees that enhance EBITDA margins above 60%. Healthcare REITs register 8.21% CAGR on aging-population fundamentals, with Aedifica’s merger with Cofinimmo creating a USD 12.84 billion (EUR 12 billion) pan-regional champion. Office exposure bifurcates: prime CBD towers enjoy pricing power, whereas secondary blocks seek alternate uses. Each subsector’s distinct cash-flow cadence allows portfolio managers to engineer risk-adjusted performance that meets rising dividend expectations in the Europe REIT market.

By Market Capitalization:
Small-Cap Agility versus Large-Cap ScaleLarge-cap issuers represented 46.92% of the Europe REIT market size in 2025, benefiting from AAA tenant rosters and granular refinancing menus. Their weighted-average debt cost sits 60 basis points below small-cap peers, cushioning net interest margins. Yet growth momentum skews toward smaller platforms projected at 9.78% CAGR to 2031, as niche managers incubate specialized strategies overlooked by bigger rivals. Mid-caps occupy a 32.84% share, balancing diversification with opportunity capture. Institutional investors increasingly mix large-cap stability with small-cap torque, constructing barbell exposures that outperform passive benchmarks. Capitalization dispersion, therefore, fuels healthy liquidity across the Europe REIT market’s listing tiers.
Tritax Big Box illustrates small-cap outperformance: H1 2025 adjusted EPS climbed to 4.63 pence, a 6.4% lift, on occupancy levels topping 98%. Conversely, refinancing fragility surfaced when Brookfield stepped in to buy Tritax EuroBox, validating the thesis that balance-sheet resilience matters more than headline growth. Large-caps deploy balance-sheet firepower for bolt-on acquisitions, accelerating sector consolidation. Mid-caps remain takeover targets, especially diversified vehicles trading at persistent NAV discounts. The interplay across size bands ensures continuous M&A optionality, a defining trait of the Europe REIT market’s competitive evolution.

Geography Analysis
United Kingdom REIT Market
The United Kingdom anchored 40.21% Europe REIT market share in 2025, leveraging transparent governance and a deep capital-market infrastructure that global investors prize. London’s West End offices average headline rents of GBP 140 per square foot, yet hybrid-work adaptation compels landlord incentives such as turnkey fitouts and shorter lease commitments. Logistics nodes around the “Golden Triangle” accommodate 35% of UK e-commerce parcels, sustaining low single-digit vacancy despite speculative supply. Brexit red tape shifted some banking functions to Dublin and Amsterdam, but listed REITs retained overseas interest through London Stock Exchange liquidity. ESG retrofits now dominate capex budgets, aligning with the City of London’s 2040 net-zero roadmap. These dynamics collectively underpin resilient distributable earnings that reinforce the UK’s outsized weight in the Europe REIT market.
Continental Europe REIT Market
Germany captured 21.57% of market value by focusing on residential ceilings constrained by chronic housing shortages in Munich, Berlin, and Hamburg. Vonovia and LEG Immobilien leverage municipal land collaborations to secure pipelines at implied land costs 30% below private-market benchmarks. Regulatory rent brakes temper near-term upside but guarantee occupancy exceeding 95%, supporting bond-like income qualities. Industrial corridors along the Rhine-Ruhr also attract logistics REITs, given proximity to Benelux ports. Meanwhile, France holds a 13.42% share centered on Parisian commercial landmarks owned by Unibail-Rodamco-Westfield, which pivots toward experience-led retail to counter pure online substitution. Spain’s 7.34% slice benefits from tourism-driven hospitality rebounds, aiding Merlin Properties’ diversified tilt. Each continental block contributes unique demand levers that diversify the Europe REIT market.
Nordics and BENELUX REIT Market
Nordic countries present the fastest trajectory with an 8.11% CAGR out to 2031, catalyzed by Stockholm’s office-to-residential conversions and Copenhagen’s stringent green-building codes. Swedish sponsors exploit flexible planning regimes allowing mixed-use overlays that spread operational risk across daytime and nighttime economies. Denmark’s energy-positive construction mandates push capex but reward compliant assets with green-bond pricing benefits. The BENELUX region, although with only 3.05% of capitalization, enjoys post-Brexit financial-services migration that lifts office and residential absorption in Amsterdam and Brussels. Cross-border passporting smooths expansion for pan-regional operators that can navigate multilingual tenant bases.
Regulatory Landscape
Europe does not have a single REIT statute. As a result, listed property vehicles follow country-specific REIT regimes while also complying with EU-level fund and market rules that affect cross-border distribution, leverage, and liquidity management. A key 2026 anchor is the application/transposition milestone for AIFMD II (Directive (EU) 2024/927) on 16 April 2026, which tightens requirements around delegation, liquidity risk management, and (where relevant) loan origination for Alternative Investment Fund Managers, shaping how real estate strategies are structured and marketed across member states.
The EU liquidity framework is also becoming more prescriptive for fund vehicles. Commission Delegated Regulation (EU) 2026/465 became applicable on 16 April 2026 and sets technical standards for liquidity management tools (LMTs), with a transition window until 16 April 2027 for AIFs constituted before 16 April 2026. On the taxation side, the European Commission’s 2026 proposal (52026PC0560) flags concerns that rigid interest limitation rules can weigh more heavily on capital-intensive sectors such as real estate, keeping tax-policy evolution and compliance costs in focus for leveraged REIT and REIT-like structures.
Value Chain Analysis
The Europe REIT value chain starts with capital formation (equity listings, follow-ons, and private placements) and debt sourcing (bank loans, public bonds, and sustainability-linked/green instruments). It then moves through acquisition and development sourcing via brokers and direct origination, followed by active asset management. On the operating side, inputs include property management, leasing and tenant services, and facilities and energy management, which is increasingly tied to EPC and energy-performance requirements, alongside ongoing capex for refurbishments and conversions. Returns to investors come through dividends and buybacks, while portfolio recycling, such as disposals, joint ventures, and redevelopment, is used to manage leverage and rotate into higher-demand subsectors such as logistics and digital infrastructure.
Recent company actions show the chain shifting toward partnerships and more targeted deployments. Supermarket Income REIT formed a EUR 479 million joint venture with Blue Owl Capital (April 2025) to share risk and recycle capital in grocery-led UK assets, while CapitaLand Ascendas REIT acquired six logistics assets in Spain for about EUR 124 million (February 2026), reinforcing cross-border acquisition and portfolio aggregation. Retail landlords are also reconfiguring ownership and control at the asset level, with Klepierre acquiring the remaining 50% stake in Aqua Portimao for EUR 59 million (April 2026). Financing terms are increasingly linked to sustainability or repositioning outcomes, as illustrated by IREIT Global’s use of green notes (February 2026) to fund repositioning works, which reflects how funding terms, reporting capability, and capex execution are becoming core parts of the REIT operating chain.
Competitive Landscape
The Europe REIT market remains moderately fragmented, with the largest entities holding a notable but not dominant share of total market capitalization. This fragmentation leaves room for further consolidation, which could unlock scale-driven operating efficiencies and competitive advantages. Specialization is the reigning strategy: Segro dominates logistics, Vonovia leads residential, Digital Realty spearheads data centers, and Aedifica-Cofinimmo forges healthcare supremacy. Technology adoption differentiates winners; Digital Realty’s predictive-maintenance AI reduced unplanned outages by 40%, enhancing tenant retention. Green-bond issuance also shapes capital-cost hierarchies as lenders favor verifiable energy-efficiency programs. Emerging proptech-enabled platforms, while small, introduce disruptive leasing models such as subscription-based co-living, potentially reshaping occupancy economics.
Strategic M&A punctuates the narrative. In 2024, Brookfield acquired Tritax EuroBox, signaling private equity's keen interest in high-barrier subsectors, especially those with depressed valuations. Aedifica and Cofinimmo merged in 2025, forming a pan-European healthcare landlord boasting a book value of USD 12.84 billion (EUR 12 billion), and unlocking benefits in fit-out equipment purchases. Digital Realty, buoyed by leasing surges in Frankfurt and Amsterdam, twice raised its 2025 FFO guidance, underscoring its growth-through-development strategy. Segro's focus on brown-field reclamations positions it advantageously in land-scarce corridors. As refinancing costs trend upward, capital discipline and asset recycling stand out as key differentiators in the landscape.
Competitive intensity varies by segment. Industrial enjoys oligopolistic traits given scarce land, while retail remains fragmented with many sub-scale owners. Office portfolios face existential strategy reviews amid hybrid occupancy pressures, driving selective divestments into mixed-use conversions. Residential consolidation continues, but regulatory rent caps slow mega-deals. Data-center portfolios attract infrastructure-fund bids that re-price the segment at utility-like multiples. Overall, managers capable of agile capital-allocation and ESG compliance solidify leadership, shaping the future trajectory of the Europe REIT market.
Europe REIT Industry Leaders
-
Unibail-Rodamco-Westfield
-
Segro plc
-
Vonovia SE
-
Land Securities Group plc
-
Klepierre SA
- *Disclaimer: Major Players sorted in no particular order
Europe REIT Market Companies Covered in this Report
- Unibail-Rodamco-Westfield
- Segro plc
- Vonovia SE
- Land Securities Group plc
- Klepierre SA
- Merlin Properties
- Gecina SA
- Aroundtown SA
- Castellum AB
- LEG Immobilien SE
- Fabege AB
- Covivio SA
- Tritax Big Box REIT plc
- Hammerson plc
- Cofinimmo SA
- CPI Property Group
- Swiss Prime Site AG
- Shaftesbury Capital plc
- Aedifica SA
- Globalworth Real Estate Investments
Market Opportunities and Future Outlook
A near-term opportunity is emerging where stricter fund-governance and liquidity rules intersect with REIT platforms that already run integrated asset-management and reporting operations. The 16 April 2026 AIFMD II application date, together with LMT technical standards under Commission Delegated Regulation (EU) 2026/465, raises the operational bar for fund management and increases the relative value of scaled managers with consistent cross-border processes for risk, liquidity, and disclosure. For the listed-property ecosystem more broadly, this points to whitespace for service providers and operating platforms that can standardize data, valuation workflows, and risk controls across multi-country portfolios.
Energy-performance compliance and digital infrastructure also remain practical themes in current market activity. Industrial logistics demand has already supported sector rotation across European listed real estate, and digital infrastructure is moving from adjacent to core exposure as industrial landlords add data-center capacity to their land banks and estates. For example, SEGRO disclosed a 30,000 sq m powered shell data centre pre-let at Slough Trading Estate and secured planning approval for a 56MW fully fitted data centre in West London (April 2026). These actions support opportunities in (i) retrofits and decarbonization capex funding structures, including sustainability-linked debt, that improve tenant retention and financing terms, and (ii) build-to-suit development and joint venture formats aligned to long-duration tenant requirements with balance-sheet discipline.
Recent Industry Developments in Europe REIT Market
- July 2026: SEGRO announced heads of terms for a new UK Big Box logistics joint venture seeded with three prime logistics parks in Radlett, Coventry, and Northampton. The structure is designed to support capital recycling while preserving operating control over assets in high-demand distribution corridors, strengthening development and leasing capacity for large-box logistics tenants.
- May 2026: Vonovia issued two bonds in international markets, a GBP 400 million 12-year bond and an AUD 300 million 7-year bond. The multi-currency execution expands funding channels for large residential platforms and supports refinancing flexibility, where managing debt maturities remains central to dividend capacity.
- July 2025: Aedifica and Cofinimo shareholders approved their merger to create a EUR 12 billion pan-European healthcare real estate platform spanning Belgium, the Netherlands, Germany, and France. The combination builds scale in senior housing and medical facilities, improving purchasing leverage on fit-outs and widening the addressable tenant base across multiple jurisdictions.
Europe REIT Market Report Scope and Research Methodology
Market Definition and Coverage
For this methodology, the market covers the total investable value of listed REIT vehicles operating across Europe, captured as their market value tied to income producing real estate holdings and related REIT activities within the region.
Scope exclusions: We exclude non-listed property funds, direct property ownership outside REIT structures, and general real estate transaction values that do not flow through REIT vehicles.
Segments Covered in This Report
- By Sector
- Commercial
- Office
- Retail
- Hospitality
- Healthcare
- Other Commercial Sector
- Residential
- Commercial
- By Market Capitalization
- Large-Cap (more than USD 10 billion)
- Mid-Cap (USD 2–10 billion)
- Small-Cap (less than USD 2 billion)
- By Geography
- United Kingdom
- Germany
- France
- Spain
- Italy
- BENELUX
- Belgium
- Netherlands
- Luxembourg
- NORDICS
- Denmark
- Finland
- Iceland
- Norway
- Sweden
- Rest of Europe
Data Sources, Market Sizing, and Validation
Desk Research
Desk research was used to map the investable universe and set realistic guardrails around what should count as a Europe REIT market value. We relied on public sources such as European listed real estate association publications, official stock exchange disclosures, national statistics offices for real estate and construction indicators, central bank series for interest rates and credit conditions, and securities regulator filings that explain listing and reporting rules.
To convert these signals into usable inputs, we also reviewed annual reports, investor presentations, and audited financial statements to understand reported property values, leverage, and income patterns. For cross-checks, we used a paid subscription covering company financials and news to confirm corporate actions and reporting dates, and a paid patent database only when it helped validate structural themes (such as property-tech adoption that can affect operating efficiency). The sources listed here are illustrative, and many other public references were used to collect, validate, and clarify data points throughout the work.
Primary Interviews and Surveys
Primary work focused on validating what market participants count as a REIT in Europe, and how they treat mixed exposure vehicles that hold diversified assets across countries and sectors. We spoke with a mix of listed real estate investors, REIT management teams, research analysts, and advisors across key geographies, and then used surveys to confirm assumptions on valuation resets, financing spreads, and sector allocation shifts so the model stayed grounded in current conditions.
Distribution of primary research fieldwork respondents
| Company type | Respondent position |
|---|---|
| Top tier: 26% | CXOs: 12% |
| Mid tier: 57% | Functional/Unit leaders: 38% |
| Smaller Players: 17% | Managers: 50% |
Market-Sizing & Forecasting
The core sizing started with a top-down approach where listed REIT universe coverage, country level listings, and reported investment property values were reconstructed into a consistent Europe total, and then mapped to sector exposure buckets already used by market participants. To keep the output practical, we corroborated the totals using selective bottom-up checks, such as sampled REIT market capitalization roll ups, observed NAV discount and premium ranges, and simple value splits by country exposure when vehicles operated across borders.
Key inputs used in the model included market capitalization trends of listed REITs, reported portfolio value and occupancy direction, interest rate levels and refinancing windows, dividend yield expectations, and country level real estate sentiment indicators that influence valuation marks. Where some REIT disclosures were missing or reported at different dates, we handled gaps by carrying forward the latest audited numbers, adjusting with market valuation moves, and then reconciling back to cross-check indicators from disclosures and index level movements.
For forecasting, scenario analysis was used so different interest rate paths and valuation recovery speeds could be reflected without forcing one narrow outcome. The final forward view was then aligned to what interviewees called out as plausible changes in cap rates, financing availability, and sector rotation over the forecast period.
Data Validation & Update Cycle
We tested outputs through multiple checks so obvious mismatches were caught early, and then corrected with documented assumptions. Model totals were compared against independent signals such as listed real estate index moves, reported aggregate portfolio value shifts, and visible capital raising or deleveraging cycles, which helped flag years where the implied change looked too sharp.
Variance checks were completed at country and sector exposure levels, followed by an analyst review where assumptions, conversions, and carry-forward rules were re-checked. If a large gap appeared, respondents were re-contacted to confirm whether it came from a market event, a reporting timing issue, or a definition mismatch. Reports refresh annually, with interim updates when major events materially change financing conditions or valuations, and a final pre-delivery pass is completed so clients receive the latest view.
Mordor Intelligence's Europe Reit Market Sizing Compared With Other Published Estimates
Published numbers for Europe REIT can look far apart because some sources size the opportunity using broader listed real estate or even mixed fund universes, while others narrow it down to a stricter REIT-only view. Differences also show up when the same underlying assets are counted using NAV, portfolio value, or market capitalization, and when valuation dates do not line up across countries.
The main gap comes from whether diversified listed property companies and non-REIT vehicles are included, where Mordor Intelligence counts only REIT structures with clear sector exposure in Europe and anchors the value series to consistent market-cap and valuation timing checks.
Benchmark comparison
| Source | Market Size | Gaps in Research Methodology |
|---|---|---|
| Mordor Intelligence | USD 420.60 B (2025) | |
| Global Consultancy A | USD 285.40 B (2026) | Uses a narrower revenue style framing and a different year marker, which can understate the investable market value when REITs are primarily compared on capitalization and portfolio valuation moves. |
| Industry Association B | USD 971.00 B (2025) | Often reflects a broader European listed real estate universe measured on NAV-adjusted implied GAV, which can include non-REIT listed vehicles and expand the scope beyond the REIT-only pool. |
The spread across sources mostly comes down to scope and the value yardstick used, rather than a simple math disagreement. By keeping the investable REIT universe definition consistent and validating valuation timing across countries, the estimate stays traceable to a repeatable set of public metrics and interview-tested assumptions.
Key Questions Answered in the Report
What is the current value of the Europe REIT market and its expected growth?
The Europe REIT market size stands at USD 460.62 billion in 2026 and is projected to reach USD 725.58 billion by 2031, reflecting a 9.52% CAGR over 2026-2031.
Which sector leads European REIT allocations?
Industrial logistics assets lead with 24.86% of the Europe REIT market share due to sustained e-commerce demand.
Why are data-center REITs gaining prominence in Europe?
Hyperscale cloud and edge-computing expansions drive a 10.18% CAGR for data-center REITs, making them the fastest-growing segment.
How does hybrid work affect office-focused European REITs?
Office attendance stabilizing at 65% of 2019 levels pressures secondary assets, prompting conversions and flexible-lease strategies to maintain cash flows.
What role does ELTIF 2.0 play in REIT fundraising?
ELTIF 2.0 widens retail access to listed property funds, adding a new, stable capital channel that could expand the investor base by up to 40%.
Which geographic region is the fastest growing within European REITs?
Nordic markets are forecast to expand at an 8.11% CAGR through 2031 due to office-to-residential conversions and stringent green-building codes.