
Market Overview
| Study Period | 2020 - 2031 |
|---|---|
| Forecast Data Period | 2026 - 2031 |
| Base Year Market Size (2025) | USD 33.38 Billion |
| Market Size (2026) | USD 37.07 Billion |
| Market Size (2031) | USD 62.69 Billion |
| Growth Rate (2026 - 2031) | 11.08 % |
| Market Concentration | High |
Major Players *Disclaimer: Major Players sorted in no particular order Image © Mordor Intelligence. Reuse requires attribution under CC BY 4.0. | |
Europe Recreational Vehicle Market Analysis by Mordor Intelligence
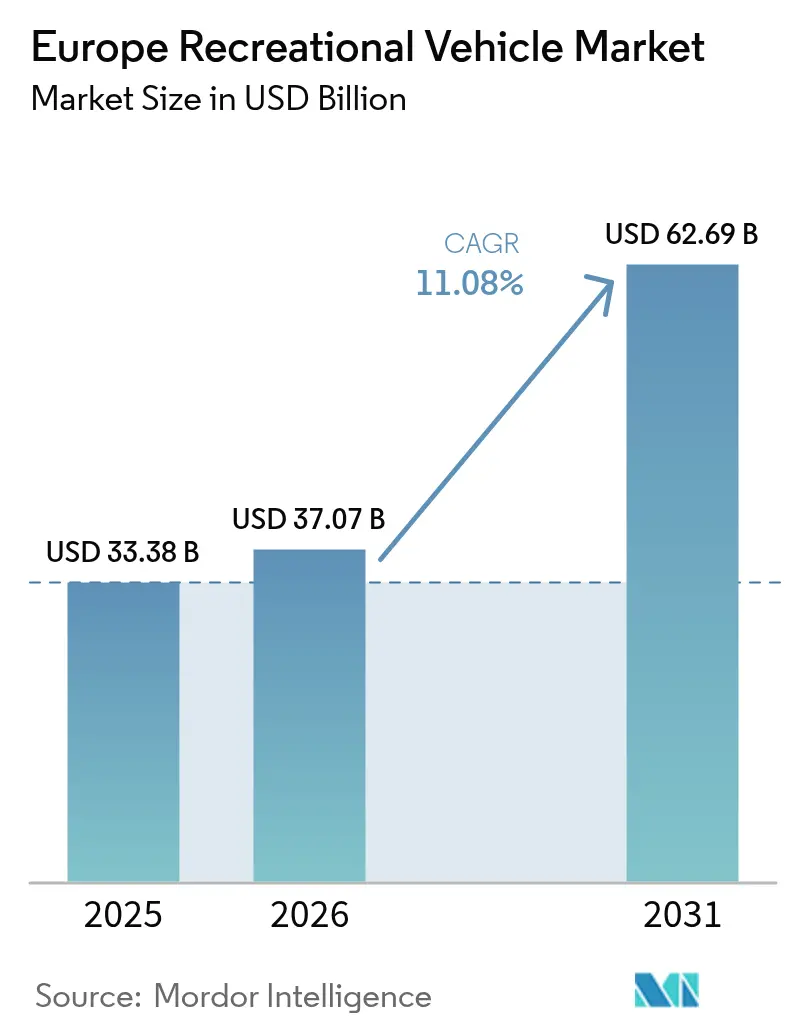
The Europe Recreational Vehicle market size is expected to grow from USD 33.38 billion in 2025 to USD 37.07 billion in 2026 and is forecast to reach USD 62.69 billion by 2031 at 11.08% CAGR over 2026-2031. This robust growth trajectory reflects the sector's resilience following post-pandemic recovery and structural shifts in European leisure patterns. The market's expansion is underpinned by regulatory tailwinds, particularly the EU Parliament's approval of extending B-license eligibility to 4.25-tonne motorhomes by 2028, which will unlock access for millions of additional drivers.
Key Report Takeaways
- By vehicle type, motorhomes led with a 53.72% Europe recreational vehicle market share in 2025, whereas campervans are advancing at an 11.62% CAGR through 2031.
- By propulsion, diesel ICE units commanded a 91.10% share of the Europe recreational vehicle market size in 2025, while battery-electric models are forecast to expand at a 36.91% CAGR to 2031.
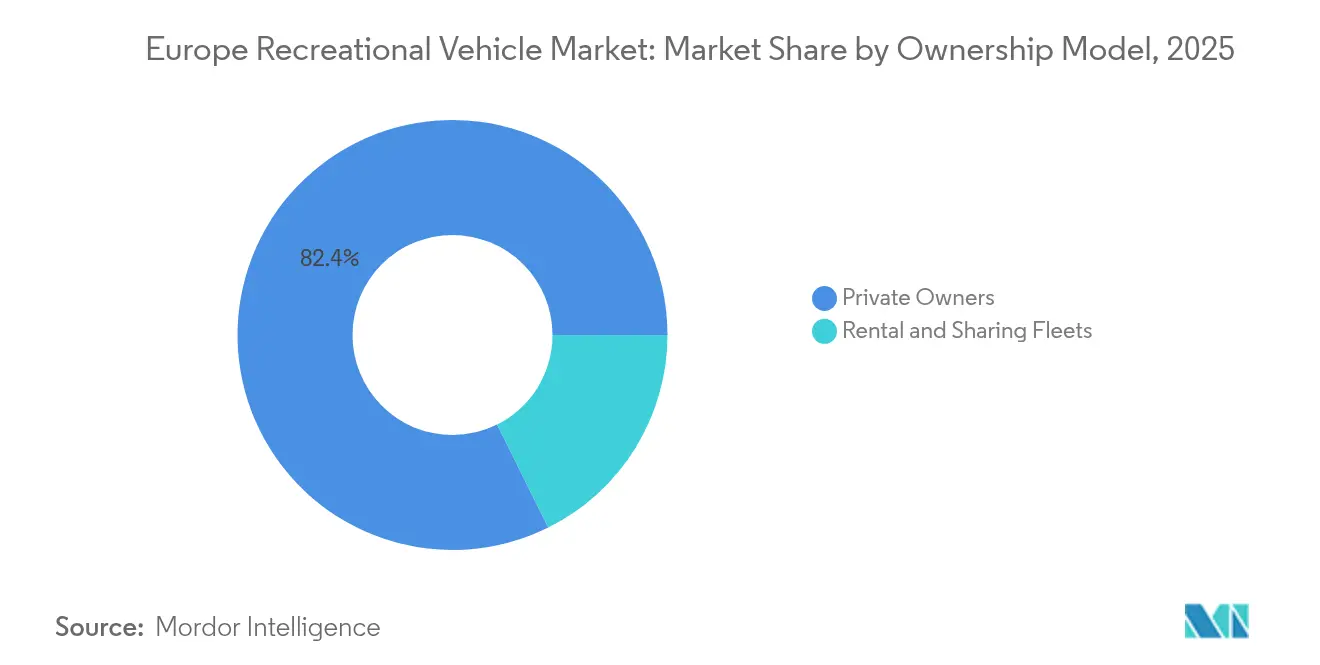
- By ownership model, private owners held 82.35% of the Europe recreational vehicle market size in 2025; rental and sharing fleets represent the fastest trajectory at 13.95% CAGR.
- By sales channel, OEM-franchised dealers accounted for 71.20% of the Europe recreational vehicle market in 2025, yet direct-to-consumer online transactions are set to rise at a 19.05% CAGR.
- By country, Germany captured 27.30% of the Europe recreational vehicle market in 2025, whereas Norway records the highest projected CAGR at 11.92% through 2031.
Note: Market size and forecast figures in this report are generated using Mordor Intelligence’s proprietary estimation framework, updated with the latest available data and insights as of 2026.
Market Trends and Insights
Drivers Impact Analysis of Europe Recreational Vehicle Market*
| Driver | (~) % Impact on CAGR Forecast | Geographic Relevance | Impact Timeline |
|---|---|---|---|
| Post-Pandemic Surge in Domestic and Intra-Europe Tourism | +2.8% | Europe-wide, strongest in Germany, France, Scandinavia | Medium term (2–4 years) |
| Rapid Expansion of RV-Sharing and Rental Platforms | +2.1% | Western Europe, expanding into Eastern Europe | Short term (≤ 2 years) |
| Affluent 55–75 Demographic Boosting Premium Demand | +1.9% | Germany, United Kingdom, Netherlands, France | Long term (≥ 4 years) |
| B-License Weight Limit Rising to 4.25 t | +1.7% | EU member states, implementation by 2028 | Medium term (2–4 years) |
| EU B-License Weight Limit Rising to 4.25 t Enabling Larger Floorplans | +1.5% | EU member states | Medium term (2–4 years) |
| “Emergence of Work-From-Anywhere” Digital-Nomad Van Conversions | +1.3% | Europe-wide | Long term (≥ 4 years) |
| Source: Mordor Intelligence | |||
Post-pandemic Surge in Domestic and Intra-Europe Tourism
European camping activity has reached unprecedented levels, with Germany recording 42.9 million camping overnight stays in 2024, representing a 19.9% increase compared to 2019 pre-pandemic levels[1]. This sustained elevation in domestic tourism reflects a fundamental shift in European leisure preferences, where proximity-based travel has evolved from pandemic necessity to preferred lifestyle choice. The trend extends beyond Germany, with Norway's camping sites witnessing a rise in guest nights, marking significant year-over-year growth. The persistence of elevated camping activity well into 2025 suggests this represents structural demand rather than temporary pandemic-driven behavior, particularly as camping accounts for most German guest overnight stays compared to historical levels. This tourism reorientation creates sustained tailwinds for RV demand across vehicle segments, from compact campervans enabling urban-adjacent exploration to larger motorhomes supporting extended domestic touring.
Rapid Expansion of RV-sharing and Rental Platforms
The European RV-sharing ecosystem has matured rapidly. The sector's growth acceleration is evidenced by Roadsurfer securing EUR 30 million from Avellinia Capital in April 2025, specifically for fleet expansion from 8,500 to 10,000 vehicles[2]. This capital deployment reflects institutional recognition that peer-to-peer RV platforms have overcome initial trust barriers and achieved operational scale. Notably, platforms are expanding eastward, with Ruuts targeting Eastern European markets through API integrations, providing access to major European RVs, and addressing previously underserved regions. The sharing economy's penetration into RV ownership patterns creates dual market effects: democratizing access for first-time users while generating utilization-based revenue streams for private owners, effectively expanding the addressable market beyond traditional ownership models.
Ageing but Affluent 55 to 75 Cohort Boosting Premium Demand
The European RV market's premium segment demonstrates remarkable resilience, with manufacturers like Hymer commanding prices from EUR 89,050 for entry-level models to EUR 215,460 for premium Venture S variants. At the same time, Bürstner's Elegance series starts at EUR 161,430[3]. This pricing power reflects sustained demand from Europe's affluent pre-retirement and early retirement demographic, whose purchasing patterns diverge sharply from broader economic pressures affecting younger segments.
The cohort's influence extends beyond unit sales to specification preferences, driving adoption of premium features like Bürstner's iNDUS toilet systems with gray-water reuse technology and Mercedes-Sprinter chassis upgrades. Significantly, this demographic's preference for larger, more sophisticated vehicles aligns with the pending EU B-license expansion to 4.25 tonnes, potentially unlocking additional premium segment growth as regulatory barriers diminish. The segment's stability contrasts with broader market volatility, as evidenced by continued strong performance in luxury categories even as mass-market segments face inventory pressures. Premium manufacturers are capitalizing on enhanced connectivity features, with systems like Bürstner's My Bürstner app providing remote monitoring capabilities that appeal to tech-savvy affluent buyers seeking integrated digital experiences.
EU B-license Weight Limit Rising to 4.25 t Enabling Larger Floorplans
The European Parliament's approval of extending B-license eligibility to 4.25-tonne motorhomes represents a paradigm shift that will fundamentally expand the addressable European RV market by 2028. This regulatory change eliminates a critical barrier that previously required C1 license acquisition for vehicles exceeding 3.5 tons, effectively restricting millions of potential buyers from accessing larger motorhome segments. The impact extends beyond mere weight allowances to enable entirely new vehicle architectures, as manufacturers can now design motorhomes with enhanced living space, larger fresh water tanks, and more comprehensive amenities without forcing customers into commercial licensing categories. Early manufacturer response is evident in new model development, with brands like Dethleffs introducing 4x4 Performance models and enhanced off-road capabilities that leverage the expanded weight envelope. The regulatory alignment across EU member states creates unprecedented market standardization, eliminating the patchwork of national licensing requirements that previously complicated cross-border RV travel. Importantly, the change applies regardless of propulsion type for motorhomes, providing regulatory support for electric RV adoption by accommodating the additional battery weight without licensing penalties. This regulatory modernization positions Europe ahead of other global markets in RV accessibility, potentially accelerating market penetration rates as the expanded licensing framework takes effect.
Restraints Impact Analysis of Europe Recreational Vehicle Market*
| Restraint | (~) % Impact on CAGR Forecast | Geographic Relevance | Impact Timeline |
|---|---|---|---|
| High Upfront Purchase and Insurance Costs | –1.9% | Europe-wide, most acute in premium segments | Short term (≤ 2 years) |
| Volatile Interest-Rate-Driven Financing Squeeze | –1.7% | Europe-wide, particularly affecting dealer financing | Short term (≤ 2 years) |
| Oversupply-Led Price Depreciation of 2021–22 Inventory | –1.6% | Germany, France, Italy, Spain | Medium term (2–4 years) |
| Urban Low-Emission Zones Curbing Diesel RV Access | –1.2% | Major metropolitan areas across Europe | Long term (≥ 4 years) |
| Source: Mordor Intelligence | |||
High Upfront Purchase and Insurance Costs
European RV prices have surged, straining affordability across market segments. This increase stems from supply chain disruptions, chassis shortages, and manufacturers leveraging pandemic-driven demand. Rising insurance premiums, driven by higher replacement values and specialized repair needs, add to the financial burden. Middle-market buyers increasingly opt for used vehicles or rentals, while younger and first-time buyers face barriers, limiting market growth despite strong demand. Even with inventory corrections, persistent high prices highlight structural cost inflation, necessitating income growth or alternative ownership models to sustain accessibility.
Volatile Interest-rate-driven Financing Squeeze
As interest rate fluctuations strain consumer affordability and dealer inventory management, European RV financing faces challenges. Dealers struggle with elevated inventory levels requiring higher working capital at increased borrowing costs, leading to cases like Klinke Caravaning's bankruptcy amid "more cautious buyers" and cooling post-pandemic demand. Financing issues also impact manufacturer-dealer relationships, as higher floor plan costs tighten dealer cash flows and slow inventory turnover.
Major manufacturers, such as Erwin Hymer Group, note that rising interest rates and high inventories create "heavy financing burdens," prompting aggressive discounting. Premium segments face added pressure, with larger loans amplifying interest rate impacts, potentially shifting demand to smaller units or delaying purchases. This credit tightening coincides with efforts to stabilize inventory levels post-pandemic, intensifying supply and demand-side constraints on market dynamics.
*Our forecasts treat driver/restraint impacts as directional, not additive. The impact forecasts reflect baseline growth, mix effects, and variable interactions.
Europe Recreational Vehicle Market Segment Analysis
By Vehicle Type:
Motorhomes Lead Despite Campervan SurgeMotorhomes maintained their dominant position with a 53.72% share of the Europe recreational vehicle market in 2025, reflecting European consumers' preference for self-contained mobile living solutions that provide comprehensive amenities without external dependencies. The segment's leadership stems from its appeal to the affluent 55-75 demographic, prioritizing comfort and convenience over mobility constraints. However, campervans are experiencing the fastest growth at 11.62% CAGR through 2031, driven by younger demographics embracing van life culture and urban professionals seeking flexible work-travel solutions. Travel and fifth-wheel trailers occupy smaller but stable niches, appealing to consumers who prefer to maintain separate towing vehicles for daily use. Pop-up and folding campers represent the entry-level segment, attracting price-sensitive buyers and seasonal users.
The regulatory environment supports this segmentation evolution, with EU type-approval frameworks under Regulation 2018/858 providing clear pathways for multi-stage vehicle approvals that facilitate campervan conversions while maintaining safety standards. Class A motorhomes command premium pricing but face headwinds from urban low-emission zone restrictions, while Class B campervans benefit from improved urban accessibility and parking flexibility.


By Propulsion and Fuel:
Electric Transition Accelerates Despite Diesel DominanceDiesel ICE powertrains command 91.10% share of the Europe recreational vehicle market in 2025, reflecting the segment's traditional reliance on diesel's superior torque characteristics and fuel efficiency for heavy vehicle applications. Petrol ICE variants maintain a smaller presence, primarily in lighter campervan applications where weight considerations favor gasoline engines. However, battery-electric variants are surging at a 36.91% CAGR through 2031, driven by tightening EU emission regulations and expanding charging infrastructure. Hybrid-electric solutions occupy a transitional position, offering compromise solutions for range-anxious consumers while providing emission benefits for urban access.
Norway leads electric adoption with 96% BEV share in passenger cars, creating spillover effects into commercial and recreational vehicle segments. Manufacturers are investing heavily in electric solutions, with Truma appointing Dr. Joachim Weckwerth from Bosch's Electric Solutions division to lead product development, signaling a strategic commitment to electrification.
By Ownership Model:
Sharing Economy Disrupts Traditional PatternsPrivate owners account for 82.35% share of the Europe recreational vehicle market in 2025, maintaining dominance through traditional ownership patterns that emphasize personal customization and unrestricted usage flexibility. This segment benefits from emotional attachment factors and the desire for immediate availability that characterizes recreational vehicle ownership psychology. However, rental and sharing fleets are expanding rapidly at a 13.95% CAGR through 2031, fundamentally altering market dynamics through asset utilization optimization and access democratization. The sharing economy's penetration reflects changing consumer preferences toward experience-based consumption rather than asset accumulation, particularly among younger demographics.
Comprehensive insurance frameworks support the ownership model evolution, with platforms offering coverage up to EUR 2 million per rental and 24/7 breakdown assistance, addressing traditional barriers to peer-to-peer sharing. Significantly, the sharing economy's growth creates network effects that benefit the broader market by introducing new users to RV experiences, many subsequently transition to ownership, effectively expanding the total addressable market beyond traditional ownership-only models.
By Sales Channel:
Digital Transformation Reshapes DistributionOEM-franchised dealers maintained a 71.20% share of the Europe recreational vehicle market in 2025, leveraging established relationships, service capabilities, and financing partnerships crucial for high-consideration purchases requiring extensive customer education. Traditional dealers provide essential functions, including trade-in processing, warranty service, and local market presence that digital channels cannot easily replicate. However, direct-to-consumer online sales are accelerating at a 19.05% CAGR through 2031, driven by digital-native consumers' preference for transparent pricing and streamlined purchasing processes. Rental agency networks occupy a growing niche, serving as sales channels and customer acquisition funnels for eventual ownership transitions.
Digital channels particularly benefit from regulatory compliance frameworks under EU Regulation 2018/858, which mandates electronic certificates of conformity and standardized data exchange systems that facilitate online transactions. The channel disruption is most pronounced in campervan segments, where younger buyers demonstrate higher digital adoption rates and reduced reliance on traditional dealer services. Established dealers respond through omnichannel strategies, combining physical showrooms with digital configurators and online financing tools to capture evolving customer preferences while maintaining service differentiation advantages.
Geography Analysis
Western and Southern Europe Recreational Vehicle Market
Germany dominates the Europe recreational vehicle market with a 27.30% share in 2025, supported by the continent's most extensive camping infrastructure and strongest manufacturing base. The country's leadership reflects a deep cultural affinity for outdoor recreation, evidenced by a record-breaking camping overnight stays in 2024. The United Kingdom and France maintain significant positions despite Brexit-related complications and varying regulatory frameworks, with France benefiting from extensive campsite networks and the United Kingdom leveraging strong caravan traditions. Italy and Spain contribute meaningfully through domestic demand and manufacturing capabilities, with Italy introducing new ATECO classifications in 2025 to distinguish between traditional campsites and RV-specific areas.
Broader European Markets
Norway emerges as the fastest-growing market at 11.92% CAGR through 2031, driven by exceptional economic conditions and cultural preferences for outdoor recreation. The Netherlands demonstrates consistent performance through a compact geography that favors RV tourism and strong purchasing power supporting premium segments. Rest of Europe, including Eastern European markets, presents emerging opportunities as infrastructure development and income growth support market expansion, with platforms like Ruuts specifically targeting these underserved regions through API integrations, providing access to thousands of European RVs. The geographic distribution reflects varying regulatory environments, with EU harmonization under frameworks like Regulation 2018/858 facilitating cross-border trade while national differences in licensing, taxation, and infrastructure continue to influence regional market dynamics.
Regulatory Landscape
European recreational vehicles operate under the EU type-approval and market-surveillance framework set out in Regulation (EU) 2018/858. It standardizes approval pathways for motorhomes and campervans (typically M-category base vehicles) and for towable caravans and trailers (O-category) across member states, including multi-stage approvals that are relevant to motorhome build-outs and campervan conversions. The conformity process is tied to EU-wide compliance documentation and oversight.
Emissions compliance is also moving forward through the Euro 7 regime under Regulation (EU) 2024/1257, with Euro 7 technical requirements applying to new types from 29 November 2026. This affects base-vehicle and component choices used by RV manufacturers and converters. Commission Implementing Regulation (EU) 2025/1706 (adopted 25 July 2025) further specifies implementation details for Euro 7 type-approval testing, while the European Commission also advanced updates to type-approval rules through COM(2026) 1808 to incorporate Euro 7 and additional approval items into Annex II of Regulation (EU) 2018/858. Cross-border administrative requirements are supported by harmonized registration documentation rules under Council Directive 1999/37/EC, which facilitates vehicle movement and verification across the region.
Value Chain Analysis
The European RV value chain begins with chassis and base-vehicle supply from major automotive OEMs and brands commonly used for conversions and coachbuilt units, including Fiat, Ford, Mercedes-Benz, Volkswagen, Citroen, and Iveco. Upstream inputs also cover RV-specific body shells, windows, HVAC, electrical systems, furniture modules, and materials such as aluminum and composites, and the sector has faced recurring volatility in raw materials and electronics. Skilled labor for interior fitting and specialized assembly remains a structural bottleneck, shaping throughput and lead times for both manufacturers and converters.
Midstream production is concentrated among large European groups and specialist brands operating across multiple sites in Western, Central, and Eastern Europe, where Poland and Slovenia have strengthened their cost-competitive roles. More recently, supply-demand rebalancing has pushed producers toward tighter inventory control and production alignment, including Knaus Tabbert pausing production at its Jandelsbrunn (Germany) and Nagyoroszi (Hungary) facilities in November 2024 to manage inventory and chassis delays, and Trigano reporting delivery disruption linked to chassis overstocking after the Euro 6d to Euro 6e transition (first half FY 2024/2025). Downstream routes remain anchored in OEM-franchised dealer networks and service partners for sales, financing, and aftersales, while rental and sharing platforms increasingly operate as high-utilization fleet channels that can affect used-vehicle supply and remarketing cycles.
Competitive Landscape
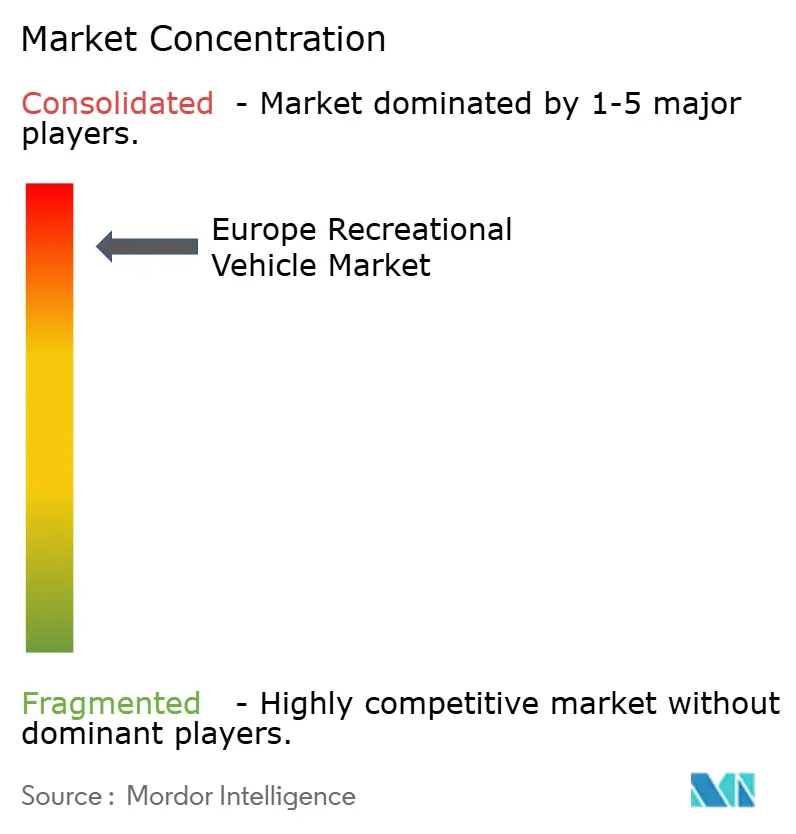
The European RV market exhibits high concentration with five leading manufacturers controlling the majority of motorhome and caravan sales, creating significant barriers to entry while enabling sustained pricing power. This oligopolistic structure reflects substantial capital requirements for manufacturing scale, dealer network development, and regulatory compliance under EU-type approval frameworks. Strategic patterns emphasize vertical integration, broad distribution networks, and acquisition-driven growth, with companies like Trigano pursuing serial acquisitions of distressed assets to expand market share and manufacturing capabilities.
Technology adoption focuses on connectivity solutions, sustainability features, and manufacturing efficiency improvements rather than fundamental product disruption. Companies are investing in digital integration, exemplified by Bürstner's My Bürstner app providing remote monitoring capabilities and Truma's appointment of former Bosch Electric Solutions leadership to drive electrification initiatives. White-space opportunities exist in electric powertrains, where current offerings remain limited by range and pricing constraints, and in Eastern European markets where established players maintain minimal presence. Emerging disruptors primarily operate in adjacent segments, particularly peer-to-peer rental platforms like Yescapa and Roadsurf, which create alternative value propositions without directly competing in manufacturing. The competitive environment is intensifying due to current inventory corrections and financing pressures, with major players like Erwin Hymer Group potentially accelerating consolidation among smaller manufacturers unable to weather the downturn.
Europe Recreational Vehicle Industry Leaders
-
Thor Industries Inc.
-
Dethleffs GmbH & Co. KG
-
Swift Group Ltd.
-
Knaus Tabbert AG
-
Auto Trail VR LTD
- *Disclaimer: Major Players sorted in no particular order
Europe Recreational Vehicle Market Companies Covered in this Report
- Erwin Hymer Group (Thor Industries)
- Trigano SA
- Auto Trail VR LTD
- Knaus Tabbert AG
- Hobby-Fendt Caravan GmbH
- Swift Group Ltd.
- Rapido Group
- Adria Mobil d.o.o.
- Dethleffs GmbH & Co. KG
- Rimor Motorhomes
- Eura Mobil GmbH
- Bürstner GmbH
- Laika Caravans S.p.A.
- Westfalia Mobil GmbH
- Globe-Traveller RV Sp. z O.o.
- Malibu GmbH & Co. KG
- Benimar SL
- Challenger (Trigano)
- Pössl Group
- Pilote Groupe
Recent Industry Developments in Europe Recreational Vehicle Market
- March 2026: Knaus Tabbert AG approved its forecast for the 2026 financial year and outlined operational measures including production relocation and organizational adjustments. The announcement pointed to a focus on aligning capacity, product complexity, and cost structure with the post-surge market environment while working through inventory normalization.
- September 2025: Erwin Hymer Group UK introduced a redesigned product portfolio for the 2026 season across its Elddis, Xplore, and Buccaneer brands. The refresh concentrated updates into the new season line-up to support dealer sell-through and give the group additional levers to differentiate specifications and price points in a more competitive retail environment.
- July 2025: Erwin Hymer Group launched the CORIGON brand to target the best-price segment with motorhomes and campervans positioned under EUR 60,000, produced using European capacities. The brand broadened the group portfolio toward price-sensitive buyers and strengthened its ability to compete with entry-level offers and rental-to-ownership demand without diluting premium marques.
Europe Recreational Vehicle Market Report Scope and Research Methodology
Market Definition and Coverage
This market covers the revenue generated from recreational vehicles sold across Europe, including motorhomes and towable RVs (such as caravans and travel trailers), counted at the point of sale and tracked in USD value.
Scope exclusions: It does not include camping equipment, campsite fees, regular passenger cars, or service-only revenue that is not bundled with the vehicle sale.
Segments Covered in This Report
- By Type
- Towable RVs
- Travel Trailers
- Fifth-Wheel Trailers
- Pop-up/Folding Campers
- Motorhomes
- Class A
- Class B (Campervans)
- Class C
- Towable RVs
- By Propulsion and Fuel
- Diesel Internal Combustion Engine
- Petrol Internal Combustion Engine
- Hybrid-Electric
- Battery-Electric
- By Ownership Model
- Private Owners
- Rental and Sharing Fleets
- By Sales Channel
- OEM-Franchised Dealers
- Direct-to-Consumer Online
- Rental Agency Networks
- By Country
- Germany
- United Kingdom
- France
- Italy
- Spain
- Netherlands
- Norway
- Rest of Europe
Data Sources, Market Sizing, and Validation
Desk Research
Desk research was used to set the fact base and the guardrails for the model so that later assumptions did not drift away from market signals. We relied on public registrations and mobility statistics, such as European caravan and motor caravan registration releases, national transport statistics, and customs trade data for relevant vehicle categories and parts.
To understand demand drivers and pricing direction, we also reviewed central bank inflation indicators, tourism and accommodation statistics (to track domestic travel intensity), and safety and emissions policy updates that can affect RV buying decisions. Company annual reports, investor presentations, and press releases were used to sense-check product mix moves, dealer coverage, and capacity changes. We also used paid subscriptions for company financials and news intelligence, plus selective shipment-level import and export data to cross-check trade flows. These examples are not exhaustive, and other public sources were also used during data collection, validation, and clarification.
Primary Interviews and Surveys
Primary work focused on validating what actually moved the market in the base year and what is expected to change next, especially on pricing, inventory, and lead-time patterns. We spoke with a mix of OEM and component-side participants, dealer and distributor stakeholders, and rental or fleet operators across major European RV hubs, then used those inputs to tighten assumptions that were unclear in desk findings.
Distribution of primary research fieldwork respondents
| Company type | Respondent position |
|---|---|
| Top tier: 34% | CXOs: 14% |
| Mid tier: 51% | Functional/Unit leaders: 41% |
| Smaller Players: 15% | Managers: 45% |
Market-Sizing & Forecasting
The core sizing started with a top-down build where country RV registrations and apparent consumption signals (production adjusted with trade movement, where suitable) were converted into value using observed price bands. Once totals were formed by country, they were rolled up to Europe and rechecked using selective bottom-up approximations, such as sampled dealer price lists, model-mix splits, and volume checkpoints from channel conversations.
A few inputs that materially shaped the model were annual registrations of motor caravans and caravans, the share shift between towable and motorized units, average selling price progression by vehicle class and powertrain, the rental and sharing fleet replacement cycle, and macro indicators like disposable income and leisure travel intensity. Where a clean volume trail was missing for smaller countries, gaps were handled through proxy ratios based on nearby markets with similar tourism profiles and RV penetration, followed by revalidation with local trade and dealer feedback.
For forecasting, scenario analysis was used, and the final path was chosen only after it matched expert expectations on supply normalization, pricing moderation, and the pace of electrified and hybrid adoption in new launches. Assumptions were kept traceable so each forecast lever could be tied back to a visible data series or an interview-backed operational reality.
Data Validation & Update Cycle
Outputs were validated through several checks so the numbers stayed consistent with independent signals. We compared implied unit values against observed price ranges, reviewed country totals against registration trends, and inspected unusual jumps that could come from one-off demand spikes or reporting delays.
Before sign-off, the model is reviewed in steps, with targeted re-contact triggered when a key input moves outside an expected range, such as sudden discounting, sharp inventory build, or policy changes affecting vehicle access in cities. Reports are refreshed annually, and interim updates are made when material events occur. Right before delivery, a fresh analyst pass is completed so the client receives the latest updated view.
Mordor Intelligence's Europe Recreational Vehicle Market Size Measured Against Other Published Estimates
Different published values can look far apart even when they are trying to describe the same RV market, because scope lines and the value build can be set up differently. In practice, gaps usually come from what is counted as an RV sale, which countries are included in Europe, and how pricing and currency timing are applied in the base year.
Some sources lean toward a narrower RV definition or use only a limited country set and then project Europe using a simple multiplier, which can push the number down. Others expand the scope by folding in adjacent leisure categories or aftermarket spend, and then apply faster price lift assumptions. In Mordor Intelligence, the figure is tied to motorhomes and towable RVs sold across the covered European countries, and it is built from registrations and consumption signals that are cross-checked with pricing discussions and channel checks.
Benchmark comparison
| Source | Market Size | Gaps in Research Methodology |
|---|---|---|
| Mordor Intelligence | USD 33.38 B (2025) | |
| Industry Publisher A | USD 33.42 B (2025) | Uses a similar Europe RV definition, but the spread can come from how average selling prices are trended from 2024 to 2025 and how trade and local production are treated when building apparent consumption. |
| Global Publisher B | USD 19.18 B (2025) | Appears to capture a narrower RV revenue pool for Europe, which can happen when only a subset of vehicle types or country coverage is used, or when parts of the dealer price and tax treatment are excluded from the final value. |
Across the three figures, the differences are largely explained by scope choices and by how value is reconstructed from volume and pricing. When the counted vehicle set, country coverage, and price build are stated clearly, the final number is easier to reconcile and repeat during updates.
Key Questions Answered in the Report
What is the projected value of the Europe recreational vehicle market by 2031?
The Europe recreational vehicle market is forecast to reach USD 62.69 billion by 2031.
Which vehicle type currently dominates sales?
Motorhomes account for 53.72% of 2025 unit sales, the largest share.
Which country is growing the fastest?
Norway shows the highest growth, with a 11.92% CAGR expected through 2031.
How is electrification affecting product strategies?
Battery-electric RVs, though still niche, are expanding at a 36.91% CAGR, prompting manufacturers to invest heavily in electric HVAC and drivetrain systems.
What regulatory change will most impact demand?
Extending B-license eligibility to 4.25 t motorhomes by 2028 removes a major entry barrier for heavier, amenity-rich models.
Are peer-to-peer rental platforms significant?
Yes, platforms like Yescapa and roadsurfer are growing fleets rapidly, accelerating a significant growth in rental and sharing segments.