Market Overview
| Study Period | 2020 - 2030 |
|---|---|
| Base Year For Estimation | 2024 |
| Forecast Data Period | 2025 - 2030 |
| Market Size (2025) | USD 11.93 Billion |
| Market Size (2030) | USD 18.76 Billion |
| Growth Rate (2025 - 2030) | 9.48% CAGR |
| Market Concentration | Medium |
Major Players
*Disclaimer: Major Players sorted in no particular order Image © Mordor Intelligence. Reuse requires attribution under CC BY 4.0. |
|

Europe Ready-to-Drink Tea Market Analysis by Mordor Intelligence
The Europe ready-to-drink tea market size stands at USD 11.93 billion in 2025 and is projected to reach USD 18.76 billion by 2030, advancing at a 9.48% CAGR. As consumers pivot from carbonated soft drinks to more convenient, lower-sugar tea options, the market witnesses a surge. This momentum is further fueled by stringent fiscal measures on sugar, upscale packaging, and innovative botanical recipes. Growth is bolstered by private-label roll-outs from discount retailers, enhancing household access, and hospitality venues revamping menus with craft cold-brew offerings. Despite facing margin pressures from rising aluminium and PET resin costs, brand owners are turning to premiumisation and glass packaging, ensuring profitability amidst escalating commodity prices. Industry leaders are also leveraging AI platforms to streamline product development, swiftly adapting to local taste preferences and regulatory shifts.
Key Report Takeaways
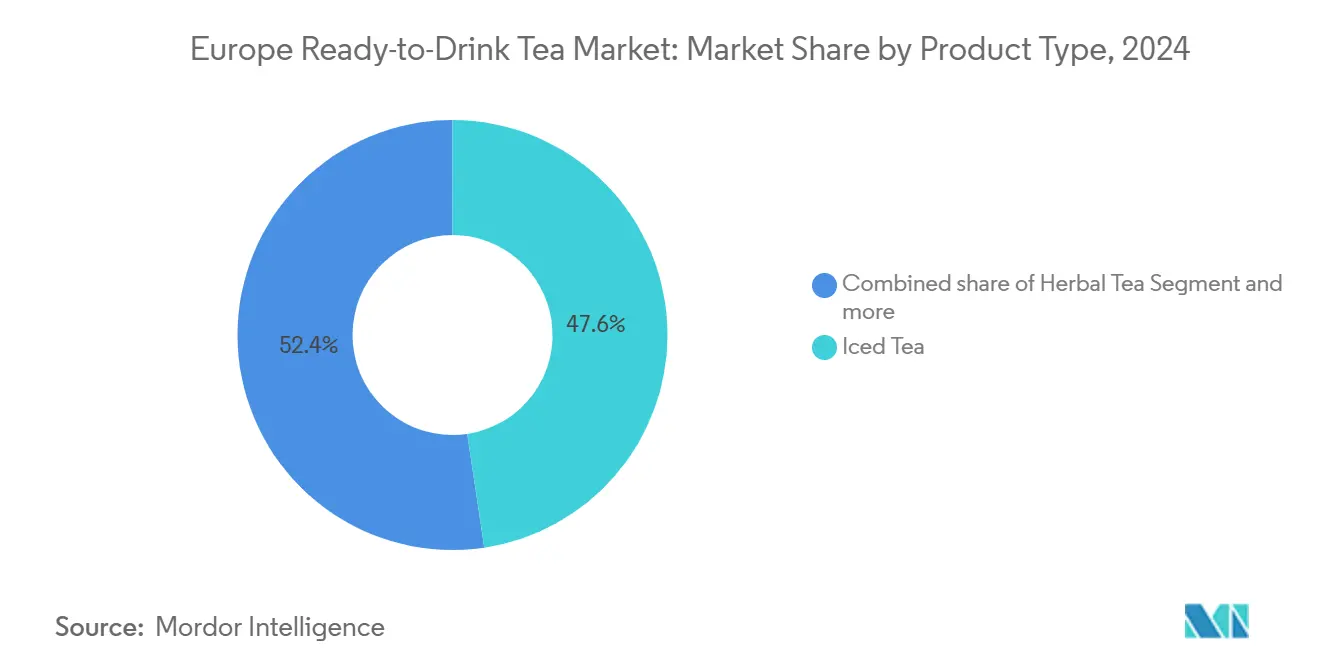
- By product category, iced tea held 47.64% of the European ready-to-drink tea market share in 2024, while herbal tea is forecast to expand at a 10.85% CAGR through 2030.
- By packaging type, PET bottles accounted for 37.64% of the European ready-to-drink tea market size in 2024, and glass bottles are advancing at an 11.62% CAGR to 2030.
- By geography, the United Kingdom commanded 35.83% revenue share in 2024; Germany is growing at a 12.51% CAGR through 2030.
- By distribution channel, off-trade outlets captured 72.92% of the European ready-to-drink tea market size in 2024, whereas on-trade venues are accelerating at a 14.82% CAGR to 2030.
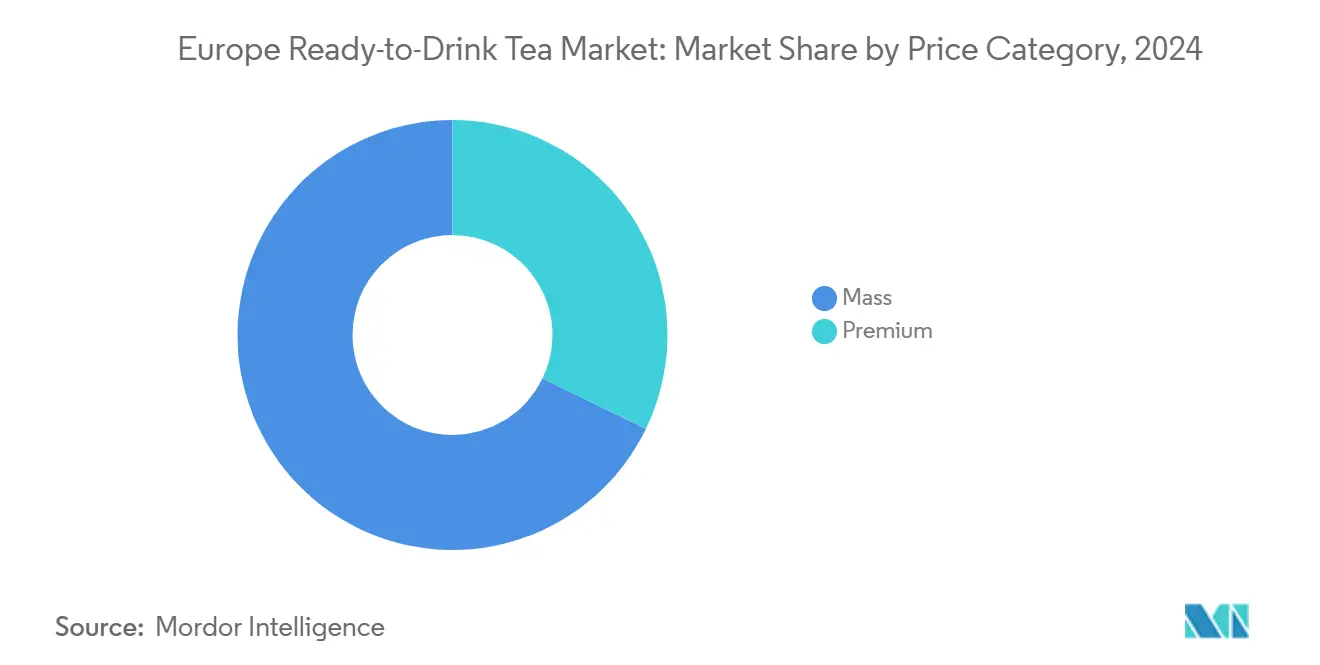
- By price tier, mass SKUs held 67.82% of the market in 2024, yet premium is expanding at a 12.28% CAGR through 2030.
Europe Ready-to-Drink Tea Market Trends and Insights
Drivers Impact Analysis
| Driver | (~) % Impact on CAGR Forecast | Geographic Relevance | Impact Timeline |
|---|---|---|---|
| A rising shift from carbonated soft drinks to healthier RTD teas | +2.1% | Western Europe (the United Kingdom, Germany, France); spillover to Poland, the Netherlands | Medium term (2-4 years) |
| Premiumisation and craft-brewed cold-brew launches | +1.8% | Germany, the United Kingdom, the Netherlands; urban centers across France, Italy, Spain | Medium term (2-4 years) |
| Surge in on-the-go recyclable PET and aluminium packaging formats | +1.4% | EU-wide (PPWR compliance); strongest in Germany, the Netherlands, United Kingdom | Short term (≤ 2 years) |
| Retailer private-label expansion in discounters | +1.3% | Germany (Aldi Süd, Lidl), Poland, Spain; moderate in the United Kingdom, France | Short term (≤ 2 years) |
| Functional botanical infusions (adaptogens, CBD) gain traction | +1.6% | United Kingdom, Germany, Netherlands; regulatory clarity driving adoption | Medium term (2-4 years) |
| AI-optimised flavour formulation reducing NPD cycle times | +1.0% | Global (multinational research and development hubs); early gains in Germany, the United Kingdom, and France | Long term (≥ 4 years) |
| Source: Mordor Intelligence | |||
Understand The Key Trends Shaping This Market
Download PDF
Rising shift from carbonated soft drinks to healthier RTD teas
European consumers are shifting their beverage spending from carbonated soft drinks to ready-to-drink (RTD) tea, spurred by increased health consciousness and regulations targeting high-sugar products. Data from FranceAgriMer highlights a consistent drop in at-home purchases of carbonated drinks from 2007 to 2023, a decline countered by a surge in cold non-alcoholic beverages, notably RTD tea. This trend is especially evident in Western Europe. In the United Kingdom, a sugar levy was introduced in 2018, while Italy enacted a similar measure in July 2025, both pushing the market towards low- and zero-sugar RTD tea options. Germany's Tee Report 2025 highlighted that in 2024, per-capita tea consumption held steady at 67.2 liters[1]Source: Rundschau, “Tee Report 2025,” rundschau.de. Innovations like Cold Brew and Functional Tea are now drawing in younger consumers, a demographic that traditionally leaned towards soft drinks. This trend is further bolstered by Poland's proposed sugar tax in 2025 and Slovakia's levy set for January 2025. These measures are anticipated to squeeze the margins of carbonated soft drinks and shift retail focus towards RTD tea. In 2024, Coca-Cola Europacific Partners' flagship RTD tea brand, Fuze Tea, reported volume growth, underscoring the category's strength in the face of challenges faced by soft drinks.
Premiumization and craft-brewed cold-brew launches
Craft cold-brew RTD tea is seizing premium shelf space and on-trade placements, using its artisanal image and zero-sugar recipes to justify higher prices compared to mass-market iced tea. In September 2025, Marna debuted a Peach Iced Tea, crafted from FTGFOP and SFTGFOP grade teas. These teas were cold-brewed to retain polyphenols and forgo added sugars, appealing to health-conscious consumers who value quality and origin. Teekanne rolled out a Cold Brew product line in April 2025, marking a shift towards mainstream acceptance of cold-extraction methods, known for their smoother flavors, particularly among younger audiences. In January 2025, Whittard introduced Cold Brew pyramid teabags, allowing consumers to brew at home and seamlessly blending retail with on-trade experiences. In Germany, the out-of-home gastronomy scene has made cold-brew tea a menu staple. Operators report promising tea sales and a growing interest in iced-tea formats, especially among younger customers. This trend towards premiumization is underscored by the rise of glass-bottle packaging, which has seen an 11.62% CAGR growth projected through 2030. This surge highlights consumers' readiness to invest in sustainable and visually appealing packaging that bolsters the craft image.
Surge in on-the-go recyclable pet and aluminium packaging formats
In April 2024, the EU adopted the Packaging and Packaging Waste Regulation, setting mandates for recycled-content thresholds, deposit-return schemes, and bans on PFAS. These mandates are pushing producers of ready-to-drink (RTD) tea to pivot towards recyclable PET and aluminum formats, all while racing against compliance deadlines. In 2024, PET bottles commanded a 37.64% market share. These bottles are now being reformulated, aiming to meet the regulation's targets: a 25% minimum recycled content by 2025 and 30% by 2030 for beverage containers[2]Source: European Commission, “Packaging and Packaging Waste Regulation Adopted,” ec.europa.eu. While aluminum cans boast infinite recyclability and a lighter carbon footprint, they grapple with rising input costs. As per the London Metal Exchange, LME aluminum prices hit USD 2,716 per tonne in November 2024, influenced by production cuts in China and sanctions on Russian metal. Britvic's Aqua Libra introduced a novel dispensing method, achieving 1.96 million packaging-free drinks in FY24. This approach curtails single-use packaging in venues while ensuring convenience. Refresco, a contract manufacturer holding a 9% share of the RTD tea volume in 2024, is channeling investments into aseptic PET and aluminum-can lines. This move caters to brand owners eager for compliant and sustainable packaging. The regulation's reach spans all EU member states, amplifying compliance pressures. This uniformity is hastening the shift towards recyclable formats in nations like Germany, France, Italy, Spain, Poland, and the Netherlands.
Retailer private-label expansion in discounters
In July 2024, Aldi teamed up with Biotiful to introduce kefir products, underscoring a strategic pivot towards collaborating with niche functional-beverage brands. This move aims to bolster the credibility of Aldi's private-label offerings in the burgeoning wellness sector. Both Aldi Süd and Lidl, major players in Germany's discount grocery scene, are selling ready-to-drink (RTD) teas at prices 20% to 30% lower than their branded counterparts. This pricing strategy resonates with households grappling with inflation. Similar trends are evident in Poland and Spain, where discounters are not only broadening their presence but also rolling out organic and herbal RTD tea variants to cater to the health-conscious demographic. Aldi and Lidl are expanding their private-label RTD tea selections, capitalizing on cost benefits and prominent shelf space to attract budget-conscious consumers. They're also venturing into functional and organic variants, straddling the line between mainstream and premium offerings. Thanks to streamlined supply chains and reduced marketing expenses, private-label RTD teas can absorb rising input costs, like the surge in European PET resin prices, which hit EUR 1,150 to EUR 1,200 per tonne in Q2 2024, without fully transferring these hikes to consumers, as noted by PET Resin Pricing. Furthermore, Lidl's private-label range boasts herbal blends infused with adaptogens and vitamins, positioning the discounter as a formidable contender against pricier branded functional RTD teas.
Restraints Impact Analysis
| Restraint | (~) % Impact on CAGR Forecast | Geographic Relevance | Impact Timeline |
|---|---|---|---|
| Sugar-reduction tax regimes are tightening | -1.2% | The United Kingdom, Italy (July 2025), Slovakia (Jan 2025), Poland (proposed 2025); spillover to France, Spain | Short term (≤ 2 years) |
| Rising aluminium and PET resin costs are squeezing margins | -1.5% | EU-wide, acute in Germany, the United Kingdom, and France (high packaging-intensity markets) | Short term (≤ 2 years) |
| Supply-chain volatility for specialty tea leaves from Asia | -0.9% | Global sourcing; impacts premium segments in the United Kingdom, Germany, Netherlands | Medium term (2-4 years) |
| Consumer scepticism on "natural" claims after greenwashing probes | -0.7% | United Kingdom (CMA investigations), Italy (AGCM), Germany, France; EU-wide Green Claims Directive | Medium term (2-4 years) |
| Source: Mordor Intelligence | |||
Sugar-reduction tax regimes tightening
Across Europe, the rise of sugar levies is squeezing margins for high-sugar ready-to-drink (RTD) tea variants. This trend is pushing companies to invest in reformulations, diverting funds from innovation and geographic expansion. Italy rolled out a sugar tax in July 2025, Slovakia followed suit in January 2025, and Poland is eyeing similar measures for 2025. These nations, joining the United Kingdom, introduced the Soft Drinks Industry Levy, a move that's already reshaped the market, as highlighted by the United Kingdom Government[3]Source: UK Government, “Soft Drinks Industry Levy Guidance,” gov.uk. The United Kingdom levies charges of GBP 0.24 per liter on beverages containing 8 grams or more of sugar per 100 milliliters. This has led brands to either reformulate their products to stay below the threshold or absorb the tax, a decision that has cut gross margins by 3 to 5 percentage points for those focused on volume. Major players like Lucozade Ribena Suntory, Britvic, and Coca-Cola Europacific Partners have all tweaked their flagship RTD tea products to lower sugar content. This shift has come with research, development, and retooling costs, all while navigating the risk of consumer pushback on taste changes. The regulatory landscape is complex, with each country setting its own thresholds and rates. This inconsistency complicates pan-European SKU rationalization, leading producers to either juggle multiple formulations or pull out of smaller markets where the cost of compliance overshadows potential revenue. While France and Spain have yet to implement sugar taxes, they're under political pressure to align with EU health goals, introducing a layer of regulatory uncertainty that hampers long-term investment choices. As a result, there's a noticeable pivot towards zero-sugar and low-sugar RTD teas, which outpaced traditional iced tea growth in 2024. However, this transition has muted overall category growth, as consumers adapt to new formulations and brands grapple with compliance costs.
Rising aluminium and pet resin costs squeezing margins
RTD tea producers, especially those in the mass-price segment, are grappling with shrinking gross margins due to rising input costs for aluminium and PET resin. These producers face stiff competition from discounters, limiting their pricing power. According to the London Metal Exchange, LME aluminium surged to USD 2,716 per tonne in November 2024, a jump from the USD 2,200 to USD 2,300 range earlier in the year. This spike was attributed to China's production cuts, sanctions on Russian metal, and soaring energy costs. Meanwhile, European PET resin prices, as reported by PET Resin Pricing, rose to EUR 1,150 to EUR 1,200 per tonne in Q2 2024, up from EUR 950 to EUR 1,000 in Q1 2024. This increase was driven by crude oil fluctuations, rising naphtha costs, and a tight supply. For instance, the resin cost for a 500-milliliter PET bottle, weighing 25 grams, jumped by about EUR 0.005 per unit. This 20% surge in cost becomes significant, especially when retail prices are locked in due to promotional contracts with supermarkets and discounters. Aluminium cans are not exempt from this trend. A 330-milliliter can, weighing 13 grams, experienced a rise in input costs of roughly USD 0.007 per unit. Brands focused on volume find it challenging to counteract this margin hit through operational efficiencies. Refresco, a key player in manufacturing RTD tea for various brand owners, highlighted the challenges posed by packaging-cost inflation. They were compelled to renegotiate prices with customers mid-year, a move that strained relationships and postponed new product launches. While premium brands, like craft cold-brew RTD tea in glass bottles, can pass on costs to consumers, commanding a 30 to 50% price premium over mass iced tea, mass-market players are squeezed. This margin compression curtails their ability to reinvest in innovation and expand geographically.
Segment Analysis
By Product Type: Herbal Tea Outpaces Iced Tea on Functional Wellness Wave
In 2024, Iced Tea holds a 47.64% market share, driven by its mass-market appeal, established distribution, and familiar flavors. Herbal Tea, however, is growing at a 10.85% CAGR through 2030, fueled by premium-priced botanical infusions with adaptogens, probiotics, and vitamins. Twinings' September 2024 launch of sparkling RTD herbal tea, enriched with zinc, magnesium, and B vitamins, highlights the segment's shift from niche health-food outlets to mainstream grocery chains, including Waitrose, Sainsbury's, Holland & Barrett, and Amazon. Green Tea, with a mid-tier share, appeals to health-conscious consumers seeking antioxidants and lower caffeine. Coca-Cola HBC's Fuze Tea, featuring green-tea variants, saw volume growth in 2024. Other RTD Teas, such as oolong, white, and blended formats, remain niche but are gaining traction in premium venues, where bartenders incorporate them into mocktails and cocktails, a trend supported by the NoLo (non- and low-alcohol) movement.
Germany's Tee Report 2025 noted that Cold Brew and Functional Tea innovations are attracting younger consumers. In 2024, herbal and fruit tea accounted for 40.1 liters of the 67.2-liter per-capita annual consumption, underscoring the segment's domestic appeal. In France, the organic tea market reached a 30 percent share in 2023, paving the way for herbal RTD launches emphasizing plant-based, low-sugar formulations. Iced Tea's slower growth reflects market saturation in Western Europe and sugar levies, such as Italy's July 2025 tax and Slovakia's January 2025 levy, which push reformulation toward zero-sugar variants, risking alienation of traditional consumers. Green Tea's growth is constrained by its grassy, astringent flavor, which appeals to wellness enthusiasts but limits mass-market adoption. Craft brands are addressing this with cold-brew extraction for smoother profiles. Herbal Tea's strong performance is further supported by EFSA's September 2025 CBD guidance, which, despite strict safety requirements, provides regulatory clarity for compliant functional formulations to enter mainstream distribution.
Note: Segment shares of all individual segments available upon report purchase
Get Detailed Market Forecasts at the Most Granular Levels
Download PDF
By Packaging Type: Glass Bottles Surge on Premium and Sustainability Mandates
In 2024, PET Bottles hold a 37.64% market share due to cost efficiency, shatter resistance, and compatibility with high-speed aseptic filling lines. Glass Bottles are growing at an 11.62% CAGR through 2030, driven by premiumisation, sustainability mandates, and on-trade preference for visually appealing formats. The EU Packaging and Packaging Waste Regulation, adopted in April 2024, favors infinitely recyclable glass and aluminium over virgin PET. Craft cold-brew brands, like Marna and Whittard, use glass bottles to enhance their artisanal image, justifying a 30 to 50 percent price premium over PET-packaged iced tea. Metal Cans benefit from infinite recyclability and lighter carbon footprints, but face input-cost inflation. For instance, LME aluminium reached USD 2,716 per tonne in November 2024, compressing margins for volume-driven players. Aseptic Packages, such as Tetra Pak cartons, remain niche, concentrated in institutional and foodservice channels where ambient-stable formats reduce cold-chain logistics costs.
On-trade venues, cafés, restaurants, and bars prefer glass bottles for their table presentation and alignment with sustainability messaging, appealing to urban, affluent consumers. Britvic's Aqua Libra, delivering 1.96 million packaging-free drinks in FY24, showcases an alternative on-trade strategy prioritizing convenience without single-use packaging. While PET Bottles face slower growth due to regulatory and consumer pressures, they dominate off-trade channels, supermarkets, convenience stores, and online retail, where cost and convenience matter most. Refresco's investments in aseptic PET and aluminium-can lines highlight confidence in serving both mass and premium segments. Glass Bottles perform well in Germany, the United Kingdom, and the Netherlands, while Southern and Eastern Europe lag due to lower willingness to pay for glass premiums. Metal Cans see moderate growth, supported by on-the-go consumption at gyms, transport hubs, and outdoor events, where portability and chill retention outweigh glass's appeal.
By Price Category: Premium Surges on Craft Cold-Brew and Functional Positioning
In 2024, Mass holds a 67.82% market share, driven by discount private labels, supermarket promotions, and value-oriented RTD teas priced at EUR 1.00–1.50 per 500 ml. The Premium segment, growing at a 12.28% CAGR through 2030, benefits from craft cold brews, functional botanical infusions, and premium glass-bottle packaging. Marna's September 2025 Peach Iced Tea, made with FTGFOP and SFTGFOP grade teas, cold-brewed and zero-sugar, highlights premium positioning. Teekanne's April 2025 Cold Brew line and Whittard's January next year's Cold Brew pyramid teabags reflect growing premium adoption. Twinings' sparkling RTD tea, priced at GBP 1.89 per can, bridges mass and premium with functional benefits at accessible pricing.
Germany's organic tea market surpasses the average organic share in food, showing strong demand for certified, sustainable RTD teas. In the United Kingdom, post-sugar-levy reformulations have elevated zero- and low-sugar RTD teas to premium status, with brands using natural sweeteners like stevia and monk fruit. Mass growth slows due to Western Europe saturation, input-cost inflation, European PET resin prices rose to EUR 1,150–1,200 per tonne in Q2 2024, and discounter competition. Premium growth is concentrated in urban centers of Germany, the United Kingdom, France, and the Netherlands, where affluent, health-conscious consumers prioritize quality and sustainability. Southern and Eastern Europe see lower premium penetration due to income constraints and weaker organic-food infrastructure, though Poland shows potential with rising health-consciousness. Mass remains vital for volume, but Premium drives higher margins and growth, necessitating a dual strategy for market players.
Note: Segment shares of all individual segments available upon report purchase
Get Detailed Market Forecasts at the Most Granular Levels
Download PDF
By Distribution Channel: On-Trade Accelerates on Premiumization and HORECA Recovery
In 2024, Off-Trade channels, supermarkets, hypermarkets, convenience stores, and online retail hold a 72.92% market share with strong distribution, promotions, and at-home consumption trends. On-Trade is growing at a 14.82% CAGR through 2030, driven by premiumisation, HORECA recovery post-COVID, and RTD tea's positioning as a craft beverage. Germany's gastronomy sector is expanding iced-tea and cold-brew menus to attract younger consumers, while France's CHR channel, representing 20% of beverage volume with high margins, rebounded in 2024, creating opportunities for premium RTD tea. LOIVĒ's functional teas in venues like Six Senses and Nobu Ibiza highlight on-trade potential for high-margin products.
Supermarkets and Hypermarkets dominate Off-Trade with wide assortments and promotions, while Online Retail is projected to reach 15% of French beverage sales by 2030, driven by subscriptions and direct-to-consumer strategies. Convenience Stores cater to on-the-go consumers with single-serve formats near checkouts, benefiting from impulse purchases. Niche channels like vending machines and specialty tea shops are modernizing, with Metro and Selecta upgrading machines to offer premium RTD tea. On-trade growth reflects urban consumption trends, premiumisation enabling higher pricing, and bartenders incorporating RTD tea into mocktails and cocktails. Off-Trade growth faces challenges from discounter private labels like Aldi and Lidl, input-cost inflation, and limited promotional budgets. Online Retail's growth is supported by e-commerce investments but faces profitability issues from last-mile delivery costs and returns.
Geography Analysis
In 2024, the United Kingdom holds a 35.83% share in the RTD tea market, supported by mature distribution networks, momentum from post-sugar-levy reformulations, and a strong presence in cafés and pubs. Germany, on the other hand, is experiencing rapid growth with a 12.51% CAGR projected through 2030, driven by innovations in organic and cold-brew teas, increasing health-consciousness, and a younger demographic favoring functional beverages. Germany's Tee Report 2025 recorded a per-capita tea consumption of 67.2 liters in 2024, with Cold Brew and Functional Tea innovations appealing to younger consumers. Bio tea has achieved a 17.7% market share, more than doubling the average organic share across all food categories. The United Kingdom's Soft Drinks Industry Levy, introduced in 2018, accelerated the shift toward zero-sugar RTD teas, setting a precedent followed by Italy (July 2025) and Slovakia (January 2025). Companies like Lucozade Ribena Suntory, Britvic, and Coca-Cola Europacific Partners invested in reformulating their flagship RTD tea SKUs to reduce sugar content, successfully capturing health-conscious consumers willing to pay premiums for low-calorie options. Germany's out-of-home gastronomy sector is optimistic about tea sales, with operators expanding iced-tea and cold-brew menus to attract younger patrons.
France, Italy, and Spain are experiencing moderate growth in the RTD tea market. While iced-tea adoption in these countries lags behind Northern Europe, rising out-of-home consumption in cafés and restaurants is driving demand. FranceAgriMer data highlights a structural shift from alcoholic to non-alcoholic cold beverages between 2007 and 2023, positioning RTD tea as a hybrid format for both at-home and on-trade consumption. France's organic tea market reached a 30% share in 2023, creating a strong base for premium RTD launches emphasizing plant-based and low-sugar formulations. Italy's upcoming sugar tax in July 2025 is accelerating the adoption of zero-sugar RTD teas, though it is compressing margins for volume-focused players. In Spain, discounters like Aldi and Lidl dominate the grocery sector, supporting private-label RTD tea growth. However, premium penetration remains limited due to lower per-capita incomes and a weaker organic-food infrastructure.
The Netherlands demonstrates strong adoption of premium and organic RTD teas, driven by affluent, health-conscious consumers and a robust sustainability framework, though its smaller population limits the overall market size. Russia and Poland are emerging RTD tea markets, with Poland benefiting from EU regulatory alignment and growing health-consciousness, while Russia faces challenges from import constraints due to sanctions and slower westernization of beverage consumption patterns. Smaller European markets, including Belgium, Sweden, and Switzerland, exhibit moderate growth. Urban centers with high disposable incomes and a trend toward premiumization in on-trade settings are key drivers of this growth.
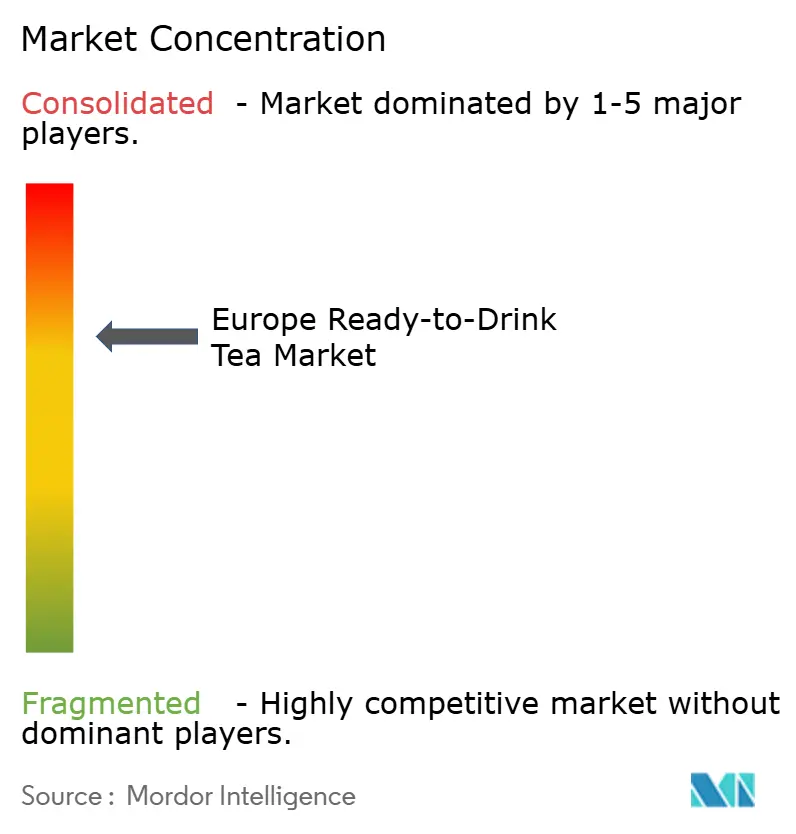
Competitive Landscape
In the European RTD tea market, major players such as Unilever, Coca-Cola, Nestlé, Suntory, and PepsiCo leverage their scale, distribution networks, and brand equity to maintain dominance in the mass market. At the same time, niche brands like Marna, Wilden Herbals, and LOIVĒ are capturing premium shelf space and on-trade placements by focusing on craft positioning, functional formulations, and sustainability. Carlsberg's EUR 3.3 billion acquisition of Britvic, announced in July 2024 and expected to close in Q1 2025, highlights the ongoing consolidation trend and the strategic importance of RTD tea portfolios, which offer margin diversification beyond carbonated soft drinks. Additionally, PepsiCo and Unilever strengthened their Lipton RTD tea partnership in November 2024, enhancing co-manufacturing and distribution synergies to enable faster SKU rollouts across Europe. Discount retailers Aldi Süd and Lidl are expanding their RTD tea assortments, leveraging cost advantages and shelf dominance to attract price-sensitive consumers while experimenting with functional and organic variants that blur the line between mass and premium offerings.
Technology adoption in the market is divided. Multinational companies, such as Symrise, are utilizing AI to optimize flavor formulation, reducing NPD cycle times from 12-18 months to 6-9 months, which accelerates regional SKU customization and minimizes the risk of failed launches. In contrast, smaller craft brands lack the data infrastructure to deploy AI at scale, creating a competitive advantage for larger incumbents. Refresco, a contract manufacturer with a 9% share of the RTD tea volume in 2024, has invested in aseptic PET and aluminum-can production lines to support brand owners seeking sustainable and compliant packaging formats. This demonstrates the critical role of co-manufacturers in enabling rapid capacity expansion without the need for capital-intensive plant construction. Emerging disruptors, including NoLo (non- and low-alcohol) beverage specialists, are incorporating RTD tea into mocktails and functional drinks, leveraging on-trade distribution networks designed for premium positioning.
The competitive landscape is further complicated by rising input costs. Aluminum prices reached USD 2,716 per tonne in November 2024, while European PET resin prices ranged between EUR 1,150 and EUR 1,200 per tonne in Q2 2024. These cost increases are compressing margins for volume-driven players, prompting brands to shift focus toward higher-margin premium segments to offset the financial pressure. White-space opportunities in the market are concentrated in three areas: functional botanical infusions targeting wellness-conscious consumers, premiumization in HORECA venues, and sustainable packaging formats that comply with EU PPWR mandates while commanding price premiums. These trends reflect the evolving dynamics of the European RTD tea market as brands navigate challenges and pursue growth opportunities.
Europe Ready-to-Drink Tea Industry Leaders
-
Unilever plc
-
The Coca-Cola Co.
-
Nestlé SA
-
Suntory Beverage & Food Ltd
-
Arizona Beverages LLC
- *Disclaimer: Major Players sorted in no particular order
Need More Details on Market Players and Competitors?
Download PDF
Recent Industry Developments
- June 2025: Teekanne launched a Cold Brew product line across Germany and Austria, featuring four SKUs: Peach, Lemon, Raspberry, and Green Tea Mint. These products are packaged in 500-milliliter glass bottles and launched targeting younger consumers seeking premium, low-sugar RTD tea and leveraging cold-extraction methods that preserve polyphenols and yield smoother flavor profiles, addressing a white-space opportunity in craft RTD tea.
- November 2024: PepsiCo and Unilever extended their Lipton RTD tea partnership, reinforcing co-manufacturing and distribution synergies that enable rapid SKU rollouts across Europe. The partnership includes joint investments in aseptic filling lines and flavor innovation, positioning Lipton to capture premiumisation demand while defending mass-market share against discounter private labels.
- September 2024: Twinings launched a sparkling RTD tea line in the United Kingdom, featuring three functional SKUs, including Defence (fortified with zinc, vitamins C and D), Refresh (magnesium, niacin, vitamin C), and Boost (vitamins B6, B12, C), each containing under 50 kilocalories per serving and no artificial sweeteners. The line is distributed via Amazon, Holland & Barrett, select Waitrose and Sainsbury's, targeting health-conscious consumers seeking functional beverages.
Europe Ready-to-Drink Tea Market Report Scope
Green Tea, Herbal Tea, Iced Tea are covered as segments by Soft Drink Type. Aseptic packages, Glass Bottles, Metal Can, PET Bottles are covered as segments by Packaging Type. Off-trade, On-trade are covered as segments by Distribution Channel. Belgium, France, Germany, Italy, Netherlands, Russia, Spain, Turkey, United Kingdom are covered as segments by Country.
Product Type
| Green Tea |
| Herbal Tea |
| Iced Tea |
| Other RTD Tea |
Packaging Type
| Aseptic packages |
| Glass Bottles |
| Metal Can |
| PET Bottles |
Price Category
| Mass |
| Premium |
Distribution Channel
| On-Trade | |
| Off-Trade | Supermarket/Hypermarket |
| Online Retail Store | |
| Convenience Store | |
| Other Distribution Channels |
Geography
| United Kingdom |
| Germany |
| France |
| Italy |
| Spain |
| Russia |
| Netherlands |
| Poland |
| Rest of Europe |
| Product Type | Green Tea | |
| Herbal Tea | ||
| Iced Tea | ||
| Other RTD Tea | ||
| Packaging Type | Aseptic packages | |
| Glass Bottles | ||
| Metal Can | ||
| PET Bottles | ||
| Price Category | Mass | |
| Premium | ||
| Distribution Channel | On-Trade | |
| Off-Trade | Supermarket/Hypermarket | |
| Online Retail Store | ||
| Convenience Store | ||
| Other Distribution Channels | ||
| Geography | United Kingdom | |
| Germany | ||
| France | ||
| Italy | ||
| Spain | ||
| Russia | ||
| Netherlands | ||
| Poland | ||
| Rest of Europe | ||
Need A Different Region or Segment?
Customize Now
Market Definition
- Carbonated Soft Drinks (CSDs) - Carbonated soft drinks (CSDs) refer to non-alcoholic beverages that are carbonated and typically flavored, containing dissolved carbon dioxide to create effervescence. These beverages commonly include cola, lemon-lime, orange, and various fruit-flavored sodas. Marketed in cans, bottles, or fountain dispense.
- Juices - We have considered packaged juices which encompass non-alcoholic beverages derived from fruits, vegetables, or a combination thereof, processed and sealed in various packaging formats such as bottles, cartons, or pouches. Excluding fresh juices, this market segment involves commercially prepared and preserved juices, often with added preservatives and flavors.
- Ready-to-Drink (RTD) Tea and RTD Coffee - Ready-to-Drink (RTD) tea and RTD coffee are pre-packaged, non-alcoholic beverages that are brewed and prepared for consumption without further dilution. RTD tea typically includes various tea varieties, infused with flavors and sweeteners, and comes in bottles, cans, or cartons. Similarly, RTD coffee involves pre-brewed coffee formulations, often mixed with milk, sugar, or flavorings, and is conveniently packaged for on-the-go consumption.
- Energy Drinks - Energy drinks are non-alcoholic beverages formulated to provide a quick boost of energy and alertness. Whereas, sports drinks are beverages designed to hydrate and replenish electrolytes, particularly after physical exertion, exercise, or intense activity
| Keyword | Definition |
|---|---|
| Carbonated Soft Drinks | Carbonated soft drinks (CSDs) are a combination of carbonated water and flavouring, sweetened by sugar or a non-sugar sweeteners. |
| Standard Cola | Standard Cola is defined as the original flavor of cola soda. |
| Diet Cola | A cola-based soft drink containing no or low amounts of sugar |
| Fruit Flavored Carbonates | A carbonated beverage prepared from fruit juice/fruit flavor with carbonated water and containing sugar, dextrose, invert sugar or liquid glucose either singly or in combination. It may contain peel oil and fruit essences. |
| Juice | Juice is a drink made from the extraction or pressing of the natural liquid contained in fruit and vegetables. |
| 100% Juice | Fruit/vegetable juice made from fruit in the form of its juice with no water added to make up the volume. It is not permitted to add sugars, sweeteners, preservatives, flavourings or colourings to fruit juice. |
| Juice Drinks (up to 24% Juice) | Fruit/vegetable juice drinks with up to 24% fruits/vegetable extract. |
| Nectars (25-99% Juice) | Juices that can have between 25 and 99% of fruit, with the minimum legal limits defined depending on the type of fruit |
| Juice concentrates | Juice Concentrates are those form of juices when most of this liquid is removed resulting in a thick, syrupy product known as juice concentrate. |
| RTD Coffee | Packaged coffee beverages that are sold in a prepared form and are ready for consumption at the time of purchase. |
| Iced Coffee | An iced coffee is a cold version of coffee, usually a combination of hot espresso and milk with ice added to it. |
| Cold Brew Coffee | Cold brew also called cold water extraction or cold pressing is made by steeping ground coffee in room-temperature water for several hours. |
| RTD Tea | Ready-to-drink (RTD) tea is a packaged tea product ready for immediate consumption without brewing or preparation |
| Iced Tea | Ice tea or iced tea is a drink made from tea without milk but with sugar and sometimes fruit flavourings, drunk cold. |
| Green Tea | Green tea is a tea beverage which promotes mental alertness, relieving digestive symptoms and promoting weight loss. |
| Herbal Tea | Herbal tea beverages are made from the infusion or decoction of herbs, spices, or other plant material in hot water. |
| Energy Drink | A type of drink containing stimulant compounds, usually caffeine, which is marketed as providing mental and physical stimulation. They may or may not be carbonated and may also contain sugar, other sweeteners, or herbal extracts, among numerous possible ingredients. |
| Sugar-free or Low-calories Energy Drinks | Sugar-free or Low-calories Energy Drinks are sugar-free, artificially sweetened energy drinks with few or no calories. |
| Traditional Energy Drink | Traditional Energy Drinks are functional soft drinks containing ingredients designed to boost the consumer's energy. |
| Natural/Oraganic Energy Drinks | Natural/Organic energy drinks are energy drinks free of artificial sweeteners and synthetic colorings. Instead, they contain naturally derived ingredients such as green tea, yerba mate, and botanical extracts. |
| Energy Shots | A small but highly concentrated energy drink that contains large amounts of caffeine and/or other stimulants. The quantity is comparatively smaller compared to energy drinks. |
| Sports Drink | Sports drinks are beverages designed specifically for the rapid supply of fluid, carbohydrates, and electrolytes before, during or after exercise. |
| Isotonic | Isotonic drinks contain similar concentrations of salt and sugar as in the human body, and are designed to quickly replace fluids lost during exercise but with an increase of carbohydrate. |
| Hypertonic | Hypertonic drinks have a higher concentration of salt and sugar than the human body. They are best drunk after exercise as it is important to replace glycogen levels quickly after exercise. |
| Hypotonic | Hypotonic drinks are designed to quickly replace fluids lost during exercise. They have very low carbohydrate content and a lower concentration of salt and sugar than the human body. |
| Electrolyte-Enhanced Water | Electrolyte water is water infused with electrically-charged minerals, such as sodium, potassium, calcium, and magnesium. |
| Protein-based Sport Drinks | Protein-based sports drinks are those sports drinks which has added protein in it that will improve performance and reduce muscle protein breakdown. |
| On-Trade | The on-trade refers to places that sell beverages for immediate consumption on the premises like bars, restaurants, and pubs |
| Off-Trade | Off-trade usually means places like liquor stores, supermarkets and other places where you don't consume the beverage right away. |
| Convenience Store | A retail business that provides the public with a convenient location to quickly purchase a wide variety of consumable products and services, generally food and gasoline. |
| Specialty store | A specialty store is a shop/store that carries a deep assortment of brands, styles, or models within a relatively narrow category of goods |
| Online Retail | Online retail is a type of eCommerce whereby a business sells goods or services directly to consumers from a website. |
| Aseptic Packaging | Aseptic packaging refers to the filling of a cold, commercially sterile product under sterile conditions into a presterilized container and closure under sterile conditions to form a seal that effectively excludes microorganisms. These includes tetra packs, cartons, pouches etc. |
| PET Bottle | PET bottle means a bottle made of polyethylene terephthalate. |
| Metal Cans | Metal containers made of aluminum or tin- plated or zinc-plated steel, which are commonly used for packaging food, beverages or other products. |
| Disposable Cups | Disposable Cup means a cup or other container designed for single use to serve beverages, such as water, cold drinks, hot drinks and alcoholic beverages. |
| Gen Z | A way of referring to the group of people who were born in the late 1990s and early 2000s. |
| Millenial | Anyone born between 1981 and 1996 (ages 23 to 38 in 2019) is considered a Millennial |
| Taurine | Taurine is an amino acid that supports immune health and nervous system function. |
| Bars & Pubs | It is a drinking establishment licensed to serve alcoholic drinks for consumption on the premises. |
| Café | It is a foodservice establishment serving refreshments (mainly coffee) and light meals. |
| On the go | It means doing / dealing with while busily engaged with something and not diverting plans in order to accommodate. |
| Internet Penetration | The Internet Penetration Rate corresponds to the percentage of the total population of a given country or region that uses the Internet. |
| Vending Machine | A machine that dispenses small articles such as food, drinks, or cigarettes when a coin or token is inserted |
| Discount store | A discount store or discounter offers a retail format in which products are sold at prices that are in principle lower than an actual or supposed "full retail price". Discounters rely on bulk purchasing and efficient distribution to keep down costs. |
| Clean Label | Clean label on the beverage market are drinks that are made from few ingredients of natural origin and are not or only slightly processed. |
| Caffeine | An alkaloid compound which is a stimulant of the central nervous system. It is mainly used recreationally, as a mild cognitive enhancer to increase alertness and attentional performance. |
| Extreme sport | Action sports, adventure sports or extreme sports are activities perceived as involving a high degree of risk. |
| High-intensity interval training | It incorporates several rounds that alternate between several minutes of high intensity movements to significantly increase the heart rate to at least 80% of one's maximum heart rate, followed by short periods of lower intensity movements. |
| Shelf life | The length of time for which an item remains usable, fit for consumption, or saleable. |
| Cream Soda | Cream soda is a sweet soft drink. Generally flavored with vanilla and based on the taste of an ice cream float |
| Root Beer | Root beer is a sweet North American soft drink traditionally made using the root bark of the sassafras tree Sassafras albidum or the vine of Smilax ornata as the primary flavor. Root beer is typically, but not exclusively, non-alcoholic, caffeine-free, sweet, and carbonated. |
| Vanilla Soda | A carbonated soft drink flavoured with vanilla. |
| Dairy-Free | A product that does not contain any milk or milk products from cows, sheep or goats. |
| Caffeine-Free Energy Drinks | Caffeine-free energy drinks rely on other ingredients to boost the energy. Popular choices include amino acids, B vitamins, and electrolytes. |
Need More Details on Market Definition?
Ask a Question
Research Methodology
Mordor Intelligence follows a four-step methodology in all our reports.
- Step-1: IDENTIFY KEY VARIABLES: In order to build a robust forecasting methodology, the variables and factors identified in Step 1 are tested against available historical market numbers. Through an iterative process, the variables required for market forecast are set, and the model is built on the basis of these variables.
- Step-2: Build a Market Model: Market-size estimations for the forecast years are in nominal terms. Inflation is not a part of the pricing, and the average selling price (ASP) is kept constant throughout the forecast period for each country.
- Step-3: Validate and Finalize: In this important step, all market numbers, variables, and analyst calls are validated through an extensive network of primary research experts from the market studied. The respondents are selected across levels and functions to generate a holistic picture of the market studied.
- Step-4: Research Outputs: Syndicated reports, custom consulting assignments, databases & subscription platforms

Get More Details On Research Methodology
Download PDF


