
Market Overview
| Study Period | 2020 - 2031 |
|---|---|
| Forecast Data Period | 2026 - 2031 |
| Base Year Market Size (2025) | USD 64.27 Billion |
| Market Size (2026) | USD 66.33 Billion |
| Market Size (2031) | USD 77.68 Billion |
| Growth Rate (2026 - 2031) | 3.21 % |
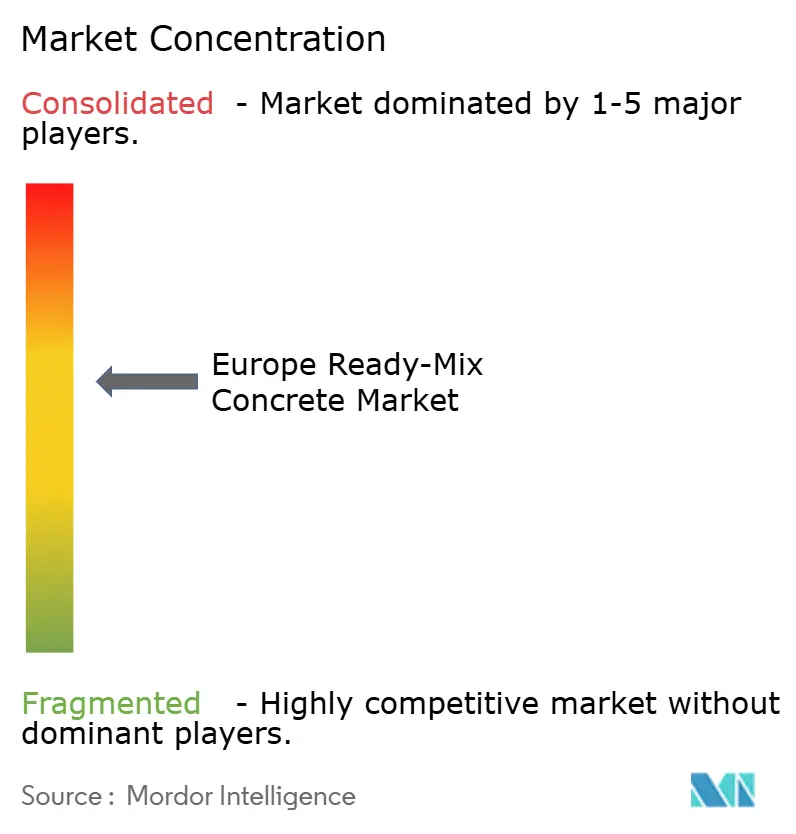
| Market Concentration | Medium |
Major Players *Disclaimer: Major Players sorted in no particular order Image © Mordor Intelligence. Reuse requires attribution under CC BY 4.0. | |
Europe Ready-Mix Concrete Market Analysis by Mordor Intelligence
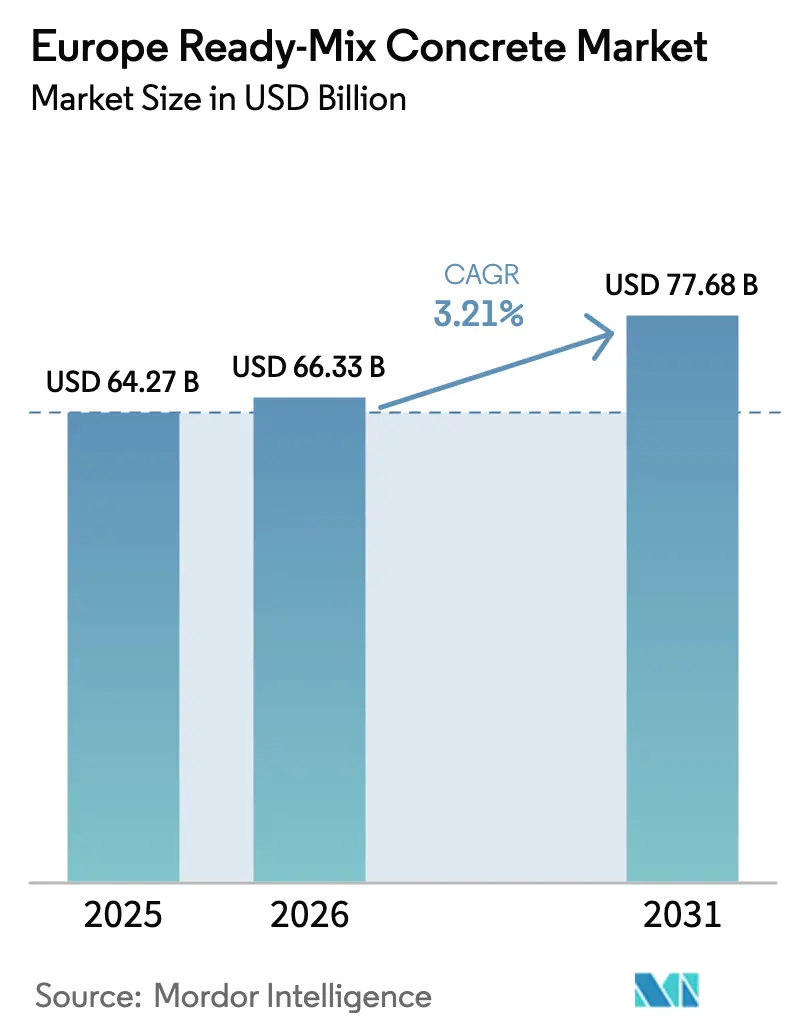
The Europe Ready-Mix Concrete Market size is expected to grow from USD 64.27 billion in 2025 to USD 66.33 billion in 2026 and is forecast to reach USD 77.68 billion by 2031 at 3.21% CAGR over 2026-2031. Consistent infrastructure spending, rising sustainability mandates and digitalization of dispatch operations underpin this steady expansion even as financing constraints curb new-build residential activity. Public sector transport programs now provide a floor under demand, limiting the cyclical swings that weighed on the sector between 2020 and 2023. Market leadership is gradually shifting eastward as cohesion-fund inflows accelerate Polish transport projects while Germany pivots from pure volume growth to efficiency-led spending. Competitive intensity is moving away from price toward technology and carbon credentials as EU Emissions Trading System (EU ETS) costs reshape producer economics.
Key Report Takeaways
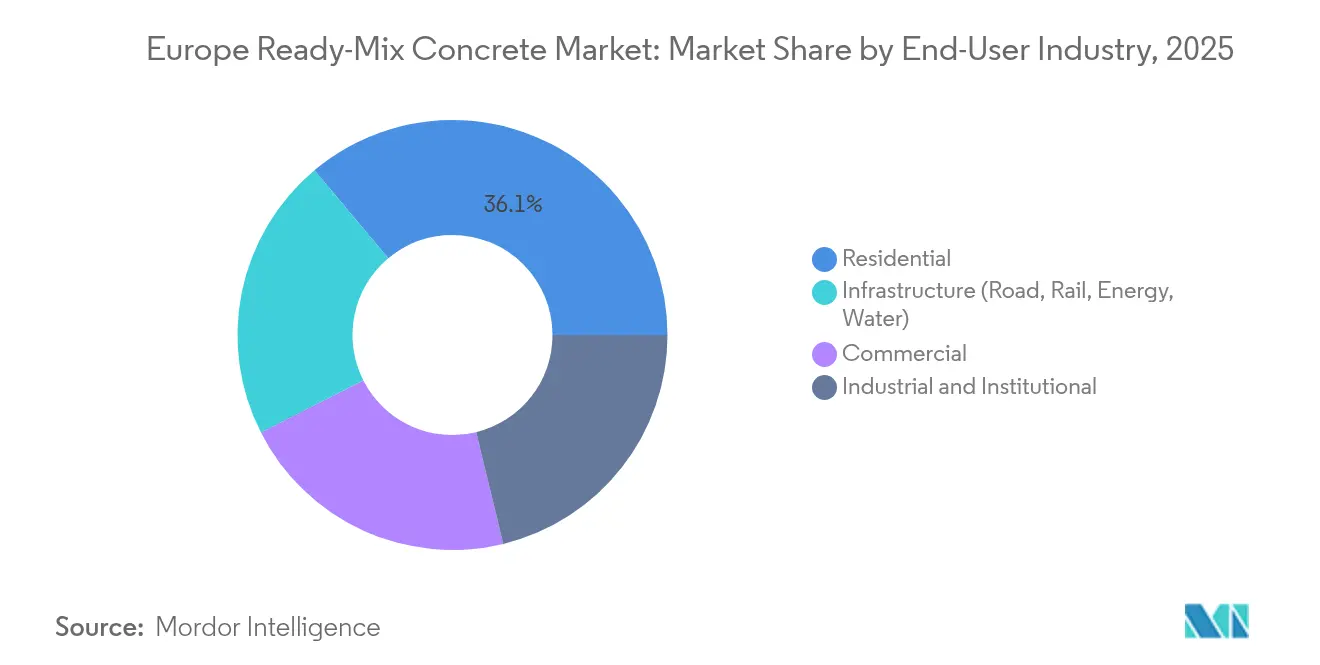
- By end-user industry, the residential segment held 36.10% of the Europe ready-mix concrete market share in 2025, while infrastructure is projected to rise at a 5.65% CAGR through 2031.
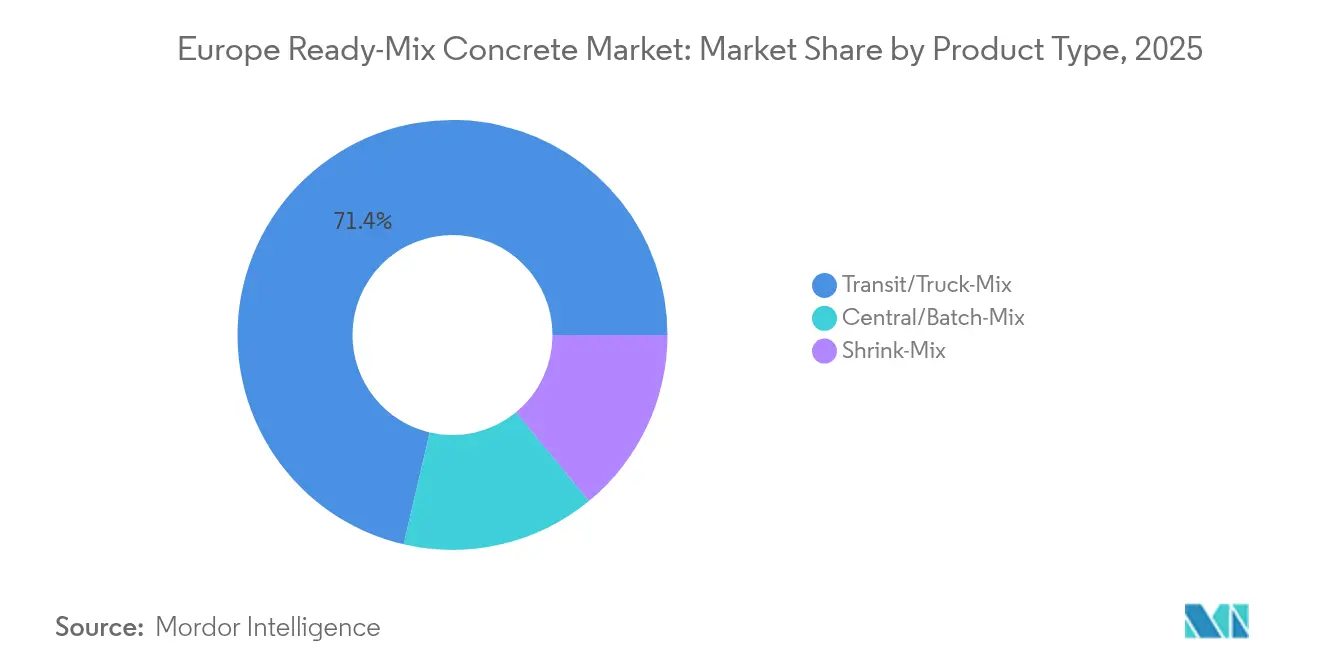
- By product type, transit/truck-mix concrete accounted for 71.35% of the Europe ready-mix concrete market size in 2025 and central/batch-mix is expanding at a 5.14% CAGR to 2031.
- By geography, Germany led with 20.20% revenue share in 2025, whereas Poland records the highest projected CAGR at 5.55% through 2031.
Note: Market size and forecast figures in this report are generated using Mordor Intelligence’s proprietary estimation framework, updated with the latest available data and insights as of 2026.
Europe Ready-Mix Concrete Market Trends and Insights
Drivers Impact Analysis*
| Driver | (~) % Impact on CAGR Forecast | Geographic Relevance | Impact Timeline |
|---|---|---|---|
| Growing residential and urban-infill demand | +0.80% | Germany, France, Netherlands, Nordic Countries | Medium term (2–4 years) |
| EU Green Deal / TEN-T infrastructure stimulus | +1.20% | Poland, Germany, France, Italy, Spain | Long term (≥4 years) |
| Prefabrication & digital dispatch efficiency | +0.70% | Germany, Netherlands, Nordic Countries | Short term (≤2 years) |
| Decarbonization push for low-carbon mixes | +0.50% | Germany, Netherlands | Long term (≥4 years) |
| Uptake of 3-D concrete printing | +0.10% | Germany, Netherlands, UK | Long term (≥4 years) |
| Source: Mordor Intelligence | |||
Growing Demand from Residential and Urban-Infill Construction
Urban densification policies are increasing the concrete intensity per dwelling, even as overall housing starts soften. German building codes that tighten thermal-performance thresholds require thicker, higher-strength walls, increasing ready-mix volumes per unit. The Netherlands’ EUR 35 billion Climate Fund channels grants to convert former industrial zones into mid-rise residential districts, creating repeat business for suppliers that excel at narrow-site logistics[1]. In France, renovation approvals now dominate permits, favoring specialized mixes formulated for structural reinforcement and energy upgrades. Nordic municipalities continue to subsidize concrete-frame housing that withstands freeze-thaw cycles. Across these markets, producers that couple technical advisory services with just-in-time delivery gain a competitive edge.
Infrastructure Stimulus via EU Green Deal / TEN-T Corridors
The EU has earmarked EUR 2.8 billion for 94 Trans-European Transport Network (TEN-T) projects in 2024, catalyzing sustained demand for bridge decks, viaducts, and rail sub-bases[2]. Poland’s role on the Baltic–Adriatic corridor underpins a 5.63% CAGR, while Germany allocates EUR 38.26 billion to transport in the 2025 federal budget, with EUR 2.5 billion ring-fenced for autobahn bridge rehabilitation. France’s Grand Paris Express and Turin-Lyon links widen the civil-work pipeline through 2026. Italy channels recovery funds toward flood control and seismic retrofit concrete, sustaining order books for specialized suppliers. These multi-year programs buffer the Europe ready-mix concrete market against housing downturns.
Prefabrication and Digital Dispatch Platforms Enhancing Time-Cost Efficiency
Algorithm-driven dispatch software now optimizes fleet routes in real-time, reducing truck waiting by up to 7.6% and cutting idle fuel consumption. German and Dutch plants integrate IoT sensors and edge computing to predict mixer downtime, raising overall equipment effectiveness. Prefabricators require narrow-tolerance mixes delivered in rapid succession, pushing producers toward automated central batching that ensures consistency. Digital twins enable managers to simulate demand spikes and balance plant loads, resulting in higher margins even as input prices fluctuate. Early adopters report payback periods of under 24 months, encouraging broader rollouts across Northern Europe.
Uptake of 3-D Concrete Printing Requiring Specialized Mixes
Large-scale printers for façades, foundations and site furnishings demand pumpable, rapid-setting formulations. Pilot projects in Germany and the Netherlands demonstrate 40% labor savings and material waste reductions, but require suppliers to fine-tune rheology and curing trajectories. Universities and OEMs are collaborating on printable geopolymer blends that cut Portland clinker dependency. While volumes remain small, early movers secure intellectual property and qualification data that create high barriers for later entrants.
Restraints Impact Analysis*
| Restraint | (~) % Impact on CAGR Forecast | Geographic Relevance | Impact Timeline |
|---|---|---|---|
| Volatility in cement and energy prices | -0.60% | Germany, Italy, France; Eastern Europe partly insulated | Short term (≤2 years) |
| Shortage of SCMs after coal-plant closures | -0.40% | Germany, UK, Netherlands | Medium term (2–4 years) |
| Stricter EU ETS costs inflating expenses | -0.40% | EU27 markets | Long term (≥4 years) |
| Source: Mordor Intelligence | |||
Volatility in Cement and Energy Prices Squeezing Margins
Cement prices climbed in Ireland between 2021 and 2024, mirroring surges across Western Europe as gas markets swung and kiln operators passed on higher energy costs. German contractors report input-cost inflation at 16-month highs in early 2025, prompting tender delays that dampen concrete call-offs. Fuel surcharges only partially offset cost spikes because multi-year supply contracts often cap escalation. Eastern European imports further compress margins in mature markets. Producers respond with dynamic pricing clauses and fleet route optimization to shave diesel use, yet profitability remains sensitive to gas-benchmark volatility until alternative-fuel substitution rises above today’s 53% share.
Shortage of SCMs After Coal-Plant Closures
Coal exits remove fly ash streams that once supplied up to 30% of binder needs. Germany’s rapid phase-out caused local fly-ash availability to slump, forcing ready-mix plants to scramble for imported slag or resort to higher-clinker mixes that raise both cost and CO₂. Alternative SCMs such as calcined clay and recycled fines require new grinding, calcination and quality-control investments. Smaller producers lack capital for such upgrades, risking market share erosion. Harmonized European standards for novel SCMs are progressing, yet certification timelines delay widespread adoption, capping near-term substitution potential.
*Our forecasts treat driver/restraint impacts as directional, not additive. The impact forecasts reflect baseline growth, mix effects, and variable interactions.
Segment Analysis
By End-user Industry: Infrastructure Drives Long-Term Growth
Infrastructure applications captured a 5.65% CAGR, well ahead of residential, underpinned by EU recovery funds and climate-resilience mandates. Transport authorities in Germany alone earmarked EUR 166 billion through 2029 for highway bridges and rail upgrades. This pipeline stabilizes ordering cycles, allowing plants to run near rated capacity. The commercial segment remains steady as e-commerce drives warehouse construction, while industrial reshoring fuels demand for concrete flooring. Institutional refurbishments across schools and hospitals pivot on low-carbon specifications that favor suppliers with certified mixes. Overall, infrastructure’s share of the Europe ready-mix concrete market size is set to expand as public budgets prioritize asset resilience over new dwellings.
Infrastructure’s outperformance also elevates specification complexity. Bridge decks require high early strength and chloride resistance; tunnel sections need fiber-reinforced, micro-silica-enhanced mixes. Producers investing in central labs and mobile testing win supply contracts on performance rather than lowest-price bids. Logistics sophistication—night pours, rail-car feeding and on-site silos—becomes critical on mega-projects, giving vertically integrated majors a scale advantage.

By Product Type: Digital Efficiency Reshapes Mix Preferences
Transit/truck-mix concrete still commands 71.35% of the Europe ready-mix concrete market share, sustained by dense batching-plant networks and customer familiarity. However, central/batch-mix systems are registering a 5.14% CAGR as contractors demand tighter quality control and reduced onsite waste. Automated plants equipped with real-time moisture probes and AI dosing algorithms deliver slump variations under ±15 mm, outperforming truck-mounted mixers that adjust manually on route. Shrink-mix serves niche long-haul or architectural projects requiring extended workability.
Digital twins intertwine batching and dispatch, letting managers simulate order books and schedule preventive maintenance. As driver shortages persist, fleet productivity hinges on precise slotting; companies using predictive algorithms cut empty kilometers by 12%, cushioning diesel inflation. The Europe ready-mix concrete market size for central plants is therefore poised to expand, though capital outlays remain a hurdle for smaller independents.
Geography Analysis
Germany retains a 20.20% share of the Europe ready-mix concrete market, anchored by EUR 11.71 billion annual allocations from the Infrastructure and Climate Neutrality fund. Near-term headwinds stem from permitting delays and tighter residential credit, but bridge rehabilitation and rail electrification ensure baseline demand. Advanced digital adoption—GPS-tagged mixers, e-ticketing, and EPD-linked invoicing—further entrenches incumbents.
Poland is the fastest-growing geography at a 5.55% CAGR, propelled by cohesion-fund-backed highway, port, and rail builds. Project clustering around the Baltic–Adriatic corridor lets producers run high-throughput central plants with minimal haul distances, boosting margins despite lower average selling prices. Domestic groups collaborate with multinationals to upskill workforces and embed low-carbon mix design, fortifying supply security.
France balances weak housing starts with robust civil-work packages. The Grand Paris Express, Lyon–Turin link and renovation grants channel consistent orders through 2026. Tight labor markets encourage prefabrication, raising demand for factory-consistent mixes. Italy leverages NRRP grants to retrofit flood defenses and seismic-proof buildings, opening niches for sulfate-resistant and fiber-reinforced formulations.
The United Kingdom, Netherlands, Belgium and Nordic countries jointly contribute significant tonnes by focusing on climate-resilient infrastructure—offshore wind foundations, flood barriers, Arctic-grade housing and logistics hubs. The Netherlands’ 2030 Climate Fund earmarks concrete-intensive projects in Amsterdam’s harbor and Rotterdam’s wind-port upgrades. Belgium’s Oosterweel Link demands high-flow, low-shrink mixes for tunnel sections under Antwerp’s river estuary. Nordic governments’ procurement rules already cap embodied carbon per cubic meter, accelerating adoption of SCM-rich blends.
Value Chain Analysis
The Europe ready-mix concrete value chain begins with upstream extraction and processing of cement and clinker, aggregates, water, and admixtures, followed by inbound logistics to batching plants. Cement is a dominant cost and CO2 driver, and the available evidence points to roughly 56% of total EU cement production being delivered into ready-mix concrete producers, which places supply availability, EU ETS-driven cost pass-through, and access to alternative binders at the center of producer economics. Aggregates are typically sourced locally due to haul-cost sensitivity, while admixtures and fibers are supplied by specialty chemicals players and then incorporated into mix-design support.
Midstream operations focus on batching (transit/truck-mix and central/batch-mix), quality control (plant labs, on-site testing, and increasingly digital ticketing and traceability), and dispatch optimization to reduce waiting time and empty kilometers. Downstream, contractors and infrastructure owners specify performance and embodied-carbon requirements, pushing producers toward SCM-rich blends, recycled concrete aggregates, and novel binders where permitted. At the same time, SCM scarcity after coal-plant closures shifts procurement toward imported slag, calcined clay, and recycled fines, which increases the emphasis on qualification, certification, and consistent supply. Vertically integrated groups, including Holcim, CRH, Heidelberg Materials, and Cemex, retain an edge by coordinating cement, aggregate, and concrete networks and by funding process upgrades such as carbon-capture projects that affect the availability and pricing of lower-carbon ready-mix offerings.
Competitive Landscape
The Europe ready-mix concrete market is moderately fragmented. Heidelberg Materials, CRH, and Holcim operate vertically integrated cement, aggregate, and concrete assets, leveraging 1,270-plus ready-mix sites worldwide and capturing scale synergies. These majors emphasize sustainability differentiation—ECOPact, ECOPlanet, Vertua—rather than price, because EU ETS exposure and SCM scarcity squeeze traditional cost levers.
Strategic M&A remains active. CRH’s USD 2.1 billion purchase of Eco Material in 2025 enhances access to reclaimed fly-ash streams and geopolymer know-how. Buzzi Unicem trimmed Italian capacity by divesting the Fanna plant to Alpacem Italia, freeing capital for carbon-capture retrofits. Cemex installs photovoltaics at Berlin batching sites to hedge electricity costs and power an emerging electric mixer fleet.
Digital ecosystems are a competitive frontier. Start-ups offering cloud dispatch integrate with ERP and telematics, enabling real-time KPI dashboards. Majors co-develop platforms to retain data ownership and lock in customers via application-programming-interface (API) bundles. Suppliers strong in performance concretes—high-alumina, 3-D printable, carbon-mineralized—win specification-heavy tenders. Meanwhile, smaller independents rely on local relationships and niche service, but face capital hurdles in meeting looming EN-15804+A2 EPD mandates.
Europe Ready-Mix Concrete Industry Leaders
-
Buzzi Unicem SpA
-
CEMEX S.A.B. de C.V.
-
CRH
-
HeidelbergCement
-
HOLCIM
- *Disclaimer: Major Players sorted in no particular order
Market Opportunities and Future Outlook
White space is opening for verifiable low-carbon ready-mix offerings that align with public procurement and corporate decarbonization programs. Holcim disclosed that ECOPact accounted for 31% of its ready-mix concrete net sales in 2025, which suggests branded lower-CO2 mixes are moving beyond pilot activity into scaled commercial deployment. As EU ETS costs and embodied-carbon reporting practices (including EPD-linked invoicing practices already referenced for leading markets) become embedded in tenders, suppliers with certified mix families, strong technical-service capability, and reliable SCM supply chains can differentiate, particularly in infrastructure-heavy corridors such as Germany, France, and Poland.
A second opportunity is portfolio alignment with industrial decarbonization investments across the cement-concrete ecosystem, since it can flow into customer expectations for compatible mixes, documentation, and logistics. Heidelberg Materials Italia began the DREAM carbon-capture project at its Rezzato and Mazzano plant after an April 1, 2026 grant agreement with CINEA, and Cemex received EUR 200 million under Spain’s PERTE Industrial Decarbonization program for the SOMZERO carbon-capture project at Alcanar (announced July 17, 2026). Together, these steps reinforce the shift toward performance plus carbon credentials, creating space for ready-mix producers to bundle mix design, digital traceability, and jobsite execution support, such as night pours and high-early-strength and durability mixes, for large transport and climate-resilience projects as specification complexity rises.
Recent Industry Developments
- July 2026: Cemex secured a contract to supply 310,000 cubic meters of ready-mix concrete for the northern section of Grand Paris Express Line 15 Ouest over four to five years. The project provides Cemex with multi-year volume and supports its position in key EU transport project markets.
- July 2026: Cemex supplied ready-mix concrete for the D35 Czech Republic motorway project, using a high-durability frost and de-icing resistant mix. The specification highlights Cemex’s ability to deliver specialized formulations for frost-related requirements on European transport corridors.
- July 2026: Cemex supplied ready-mix concrete for the new 600-meter two-lane overpass at the Nuremberg-East motorway junction in Germany. The order expands Cemex’s footprint in German logistics and transport projects.
Research Methodology Framework and Report Scope
Market Definition and Coverage
For this report, the market covers ready-mix concrete supplied from batching plants to construction sites across Europe, measured as the value of concrete delivered for use in building and infrastructure works.
Scope exclusions: This sizing excludes onsite mixed concrete, precast concrete products, and standalone cement, aggregates, and admixtures sold as separate materials.
Segmentation Overview
- By End-user Industry
- Residential
- Commercial
- Industrial and Institutional
- Infrastructure (Road, Rail, Energy, Water)
- By Product Type
- Transit/Truck-Mix
- Central/Batch-Mix
- Shrink-Mix
- By Geography
- Germany
- United Kingdom
- France
- Italy
- Spain
- Poland
- Netherlands
- Belgium
- Nordic Countries
- Rest of Europe
Data Sources, Market Sizing, and Validation
Desk Research
Desk research starts with mapping the construction demand pool and the ready-mix supply footprint by country, then aligning these to common reporting units and pricing conventions. Public sources help set realistic boundaries for what is counted as delivered ready-mix concrete value. They also provide a sanity check on whether demand direction is consistent with the broader construction cycle.
We reference non-paywalled sources such as Eurostat construction output indicators, national statistical offices for construction activity, ERMCO statistics for ready-mix volumes and plant counts, and European Commission publications tied to infrastructure and regional development programs. Additional context is taken from company annual reports and investor presentations, association websites, and reputable press coverage of capacity changes and plant networks. Where helpful, paid subscriptions are used for company financials and intelligence, shipment-level import and export checks for key inputs, and patent databases to track mix design and low carbon formulation activity. The sources listed above are illustrative, and additional public and paid references are used for data collection, validation, and clarification.
Primary Interviews and Surveys
Primary interviews and surveys are used to pressure-test model assumptions that desk sources cannot fully resolve, especially country price bands, delivered mix specifications, and how demand shifts between residential and infrastructure work. We collect views from ready-mix producers, downstream contractors, concrete technologists, and logistics and dispatch stakeholders across major European markets. This helps close gaps from public reporting and supports triangulation of assumptions.
Distribution of primary research fieldwork respondents
| Company type | Respondent position |
|---|---|
| Top tier: 28% | CXOs: 20% |
| Mid tier: 51% | Functional/Unit leaders: 36% |
| Smaller Players: 21% | Managers: 44% |
Market-Sizing & Forecasting
Sizing uses a top-down approach in which construction output and concrete usage intensity are combined to reconstruct the served ready-mix demand pool by country, then converted into value using delivered pricing logic. To keep the results grounded, we use selective bottom-up approximations as checks, such as sampling plant networks and typical annual throughput, and comparing sampled volumes to plausible average selling prices.
A small set of inputs drives most of the model, and those inputs are refined using interview feedback. These include construction output direction by country, the mix of infrastructure versus building work, typical delivered price ranges by strength class and job size, plant utilization behavior during slowdowns, and the share of central mix versus truck mix, since it affects both pricing and logistics. When data is missing for smaller countries or for short historical gaps, we interpolate using nearby market proxies and then adjust using construction pipeline signals we have in-country.
Forecasting is done using scenario analysis, where baseline growth is tied to expected infrastructure programs and the timing of private construction recovery, followed by sensitivity around energy costs and project financing conditions. Before the forecast is locked, the key variables are reviewed with field respondents, to avoid carrying forward unrealistic price progression or volume rebounds.
Data Validation & Update Cycle
Validation runs through multiple checkpoints so the final numbers do not depend on a single data series. We compare the model outputs against independent signals such as ERMCO volume direction, country construction output trends, and plant footprint changes. We then rework any country totals that move beyond practical capacity and utilization ranges.
Outliers are reviewed in analyst checks, and follow-up outreach is triggered when pricing, volume, or mix assumptions move materially away from what the field indicated. Reports are refreshed annually, with interim updates when major events shift demand or costs, and a final pre-delivery review is done so clients receive the most current view available at the time of publication.
Mordor Intelligence's Europe Ready Mix Concrete Market Sizing Compared With Other Published Estimates
Published market sizes for Europe ready-mix concrete can differ even when the topic appears identical. This is usually because the scope boundary and pricing timeline are not treated the same across sources. The variation is typically linked to how delivered value is defined, which countries are grouped under Europe, and whether inflation and currency timing are applied consistently across the historical and base-year cut.
In this study, the refresh cadence and currency timing are kept consistent across countries. Average selling prices are updated using interview-backed delivered price bands, and then rolled into the final value totals. This is a key reason the 2025 market number in Mordor Intelligence differs from other published figures. Differences also come from whether adjacent concrete categories are folded in, whether onsite mixing is treated as part of ready-mix, and whether a single-point pricing approach is used that does not reflect the infrastructure-heavy mix in some countries.
Benchmark comparison
| Source | Market Size | Gaps in Research Methodology |
|---|---|---|
| Mordor Intelligence | USD 64.27 B (2025) | |
| Industry Association A | USD 57.90 B (2023) | Often reported from member-submitted volume statistics and then converted using broad average pricing, which can understate value when delivered prices rose unevenly across countries and job types. |
| Global Consultancy B | USD 72.10 B (2026) | Uses a forward-year anchor that can embed a more aggressive price uplift and a wider construction rebound assumption, and scope notes are typically lighter on how onsite mixed volumes are excluded. |
The table shows that the main differences are timing and what is treated as delivered ready-mix value in Europe. By tying pricing to country-level delivered ranges and then checking totals against external construction and capacity signals, the estimate stays traceable to a small set of repeatable inputs.
Key Questions Answered in the Report
What is the 2026 value of the Europe ready-mix concrete market?
The market is valued at USD 66.33 billion in 2026.
How fast is the sector expected to grow through 2031?
It is projected to expand at a 3.21% CAGR, reaching USD 77.68 billion by 2031.
Which country is the fastest-growing market in the region?
Poland leads with a projected 5.55% CAGR through 2031, driven by EU-funded infrastructure.
Why are low-carbon mixes gaining traction?
Rising EU ETS costs and public procurement rules that favor products with lower embodied CO₂ are accelerating adoption.
Which product type is gaining share over transit-mix concrete?
Central/batch-mix systems are growing at 5.14% CAGR because centralized batching improves quality control and reduces waste.
How are producers dealing with cement-price volatility?
Many adopt dynamic pricing clauses, invest in alternative-fuel kilns and deploy digital dispatch tools to cut operating costs.