Market Overview
| Study Period | 2017 - 2030 |
|---|---|
| Base Year For Estimation | 2024 |
| Forecast Data Period | 2025 - 2030 |
| Market Size (2025) | USD 6.37 Billion |
| Market Size (2030) | USD 8.13 Billion |
| Growth Rate (2025 - 2030) | 5.00% CAGR |
| Market Concentration | Low |
Major Players*Disclaimer: Major Players sorted in no particular order Image © Mordor Intelligence. Reuse requires attribution under CC BY 4.0. |
|

Europe Protein Market Analysis by Mordor Intelligence
The Europe Protein Market size is estimated at 6.37 billion USD in 2025, and is expected to reach 8.13 billion USD by 2030, growing at a CAGR of 5.00% during the forecast period (2025-2030).
The European protein market is experiencing a significant transformation driven by changing consumer dietary preferences and lifestyle choices. A notable shift towards plant-based and flexitarian diets is reshaping the industry landscape, with approximately one-third of Belgium's population consuming vegetarian burgers in 2022. This trend is particularly evident in countries like Austria, where 25.8% of residents identified as flexitarian in 2022. The growing acceptance of plant-based alternatives is further illustrated by a recent survey in France, where 26% of respondents expressed willingness to try veganism. This dietary evolution has prompted manufacturers to diversify their product portfolios and invest in innovative protein solutions.
The industry is witnessing substantial investments and technological advancements in protein production capabilities. In 2023, major industry players like Roquette demonstrated their commitment to meeting growing demand through a USD 49 million investment in pea protein production facilities. Similarly, Uralchem Innovation established a pilot plant for producing pea isolate, showcasing the industry's focus on expanding production capabilities. These investments are accompanied by innovations in extraction technologies, processing methods, and product formulations, enabling manufacturers to improve protein functionality and application versatility.
Regulatory developments and sustainability initiatives are playing a crucial role in shaping the market landscape. In 2023, EU member states united to advocate for a comprehensive continent-wide plant protein strategy, emphasizing the need for sustainable protein sources. This initiative aims to reduce dependency on imports while promoting local production and environmental sustainability. The industry is responding with increased focus on sustainable sourcing, transparent supply chains, and environmentally conscious production methods, aligning with both regulatory requirements and consumer expectations.
The market is experiencing rapid evolution in end-use applications across various sectors. In the personal care and cosmetics segment, manufacturers are increasingly incorporating protein-based ingredients, with 64% of new cosmetic product launches in Italy in 2023 featuring natural and sustainable claims. The food and beverage industry continues to innovate with new protein applications, particularly in meat alternatives, dairy alternatives, and functional foods. Italy's growing vegan population, which increased from 1.3% in 2022 to 2.4% in 2023, exemplifies the expanding consumer base for protein-enriched products across different applications. This diversification in end-use applications is driving product innovation and creating new market opportunities.
Europe Protein Market Trends and Insights
The growing consumption of animal protein fuels opportunities for key players in the ingredients category
- In the United Kingdom, from 2016 to 2019, the average daily protein intake of individuals aged 19-64 years was 76 g per person, which was more than the 64 g/day average adult daily requirement. This number was calculated using a reference intake value of 0.83 g/kg of body weight per day. The average daily consumption of animal protein per person is projected to be 39.6 g, with 25.9 g coming from meat and meat products and 9.9 g from milk and milk products. Accordingly, the total domestic milk production has risen. Less than 7% of the domestic production is exported, thereby providing easy access to manufacturers.
- The market for whey protein is mainly driven by the growing popularity of fitness centers and health clubs, leading to a rise in whey consumption. The annual whey protein import increased exponentially by 15.09% in 2021 from 2019. However, with a great focus on overall health and consumers’ interest in clean-label products, the sports nutrition industry's demand for natural ingredients has been growing. Ingredients, such as organic and grass-fed whey, have gained prominence due to health and ethical concerns.
- Women seek sports nutrition supplements for lean body, strength, and performance. Encouragement from nutritionists and other fitness experts is also boosting the market sentiment for sports nutrition in the region. Growing veganism, demand for plant-based products, and changing dietary preferences among consumers are being witnessed globally. The low inclination toward meat-based products is visible among consumers, which is a major restraining factor for the animal protein market. The number of vegans in Europe doubled from 1.3 million to 2.6 million, representing 3.2% of the population in 2021.

Understand The Key Trends Shaping This Market
Download PDF
Meat and milk production contributes majorly in terms of raw material for plant protein manufacturers
- The graph given depicts the production data for raw materials such as meat of cattle, pigs, and chicken (with bone, fresh or chilled), raw milk from cattle and goats, skim milk from cows, and dry whey powder. Germany is the leading producer of milk in the European Union, accounting for more than 21% of milk deliveries in the European Union in 2020. Although the country has been observing a decline in the count of cattle farms, the average size of the farms is witnessing an upsurge. The rise in milk production is attributed to the escalated volume of milk production per cow. Over the years, milk production has been concentrated in the grassland regions of northwestern and southern Germany.
- Milk production is constantly rising in the United Kingdom despite the continuous decline in the number of dairy cows. As of December 2022, the total number of dairy cows in the United Kingdom that were greater than 12 months old stood at 2.66 million heads. In the same year, milk production per cow amounted to 8,169 liters per annum, an increase of 3.5% compared to 7,893 liters in 2017.
- In 2020, there were over 76 million cattle in the European Union (EU), and beef production reached 6.8 million tonnes, making the European Union the world's third-largest producer after the United States and Brazil. The sector is diverse in terms of herd size, farm structure, and geographical distribution of farms in the European Union. Three EU member states alone produce half of the EU's beef: France (21.2%), Germany (17.8%), and Italy (11.1%).

Understand The Key Trends Shaping This Market
Download PDF
OTHER KEY INDUSTRY TRENDS COVERED IN THE REPORT
- Market maturation and declining birth rates are accountable for the slow growth rate
- Healthy trends in beverages impacting market growth
- Consumers' preferences shift to premium condiments and sauces, away from packaged soups
- Dairy alternatives to witness significant growth rate
- Innovations in product formulations have a greater scope in the market
- Healthier snacking is likely to boost the market
- Increased meat production is expected to push the market's growth
- The growth in plant protein consumption provides opportunities for key players in the market
- Stronghold of the retail sector is supporting market growth
- Sustainable and innovative packaging trends to influence the breakfast cereals market
- Innovation in chocolates is driving sales
- The growing demand for nutrition-specific diets may drive market demand
- Single-head households to drive the RTE/RTC market
- The expanding consumer base may benefit the sports supplements segment
- Natural and organic products are taking over the market
- Europe is focusing on increasing the production of soy, wheat, and pea
Segment Analysis: Source
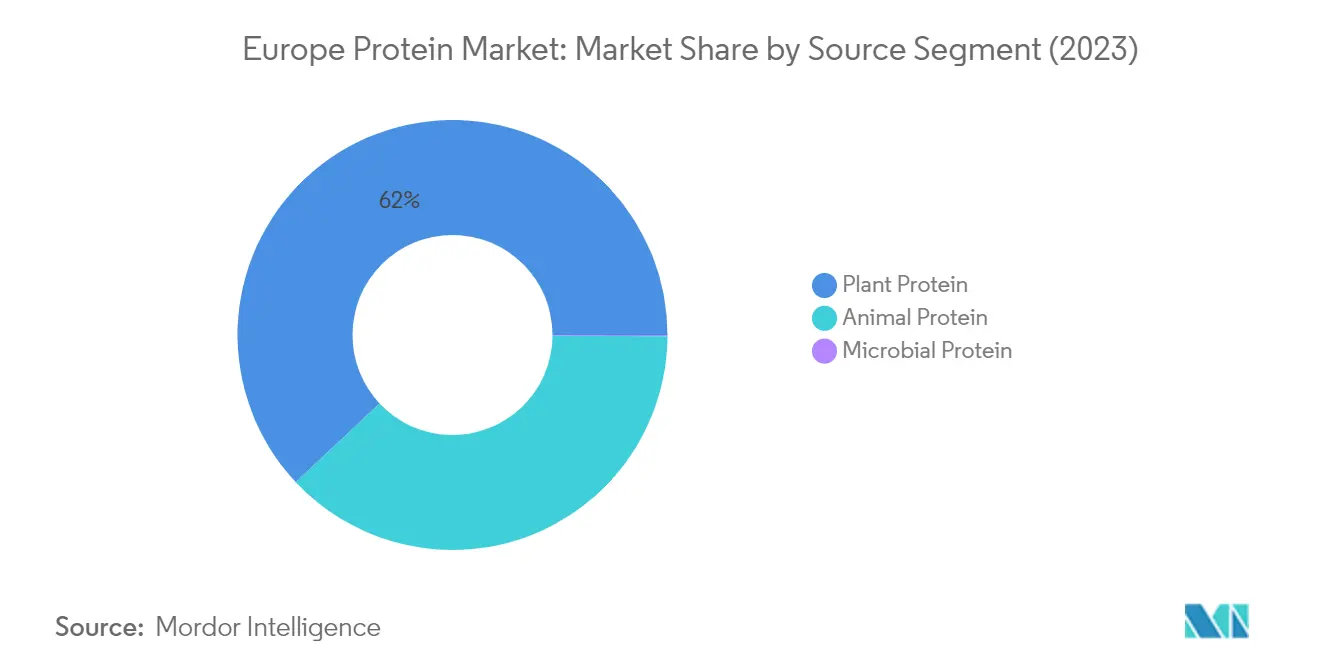
Plant Protein Segment in Europe Protein Market
Plant protein dominates the European protein market, accounting for approximately 62% of the total market value in 2024. The segment's leadership position is primarily driven by the growing flexitarian and vegan populations in the region, with about 51% of meat eaters actively reducing their annual meat consumption. The demand is particularly strong in countries like Italy, where the vegan population increased from 1.3% in 2022 to 2.4% in 2023. Soy protein leads the plant protein segment due to its lower input costs and more stable nutritional supply, addressing over 60% of protein needs from the food and beverage industry. The segment's growth is further supported by government initiatives, with EU member states calling for a continent-wide plant protein strategy in light of recent geopolitical developments.
Animal Protein Segment in Europe Protein Market
The animal protein segment is experiencing remarkable growth in the European protein market, projected to achieve the fastest growth rate of approximately 5% by value during 2024-2029. This growth trajectory is driven by continuous product innovations and a discerning demand for superior taste and premium quality. Gelatin, the leading animal protein type, is witnessing increased application as an emulsifier in various food categories, from bakery items to supplements. The segment's expansion is also supported by the rising demand for protein supplements, with whey and milk proteins together representing nearly 35% of the total animal protein value. The growth is particularly notable in sports nutrition and performance products, where animal proteins are preferred for their complete amino acid profiles and superior digestibility properties.
Remaining Segments in Source Segmentation
The microbial protein segment, while currently holding a smaller market share, represents an emerging area of innovation in the European protein market. This segment includes proteins derived from sources like algae and mycoprotein, offering sustainable alternatives to traditional protein sources. The segment is witnessing increased research and development activities, with companies exploring fermentation technologies to produce protein efficiently. Mycoprotein, in particular, is gaining attention due to its cost-efficiency and production viability, while algae protein is recognized for its higher protein content compared to other microbial proteins. The segment's growth is supported by increasing market penetration and greater acceptance of sustainable protein alternatives.
Segment Analysis: End User
Food & Beverages Segment in Europe Protein Market
The Food & Beverages segment dominates the European protein market, commanding approximately 59% market share in 2024. This substantial market position is primarily driven by the meat and dairy alternatives sector, which accounts for nearly 39% of the overall proteins consumed in the food and beverage industry. The segment's dominance is reinforced by the rising number of vegan and flexitarian consumers who are increasingly relying on or are open to animal-free product offerings. The beverage category within this segment has shown remarkable traction, particularly in protein-enriched drinks and plant-based alternatives. Manufacturers are continuously innovating with new protein isolate and protein hydrolysate formulations to meet the growing consumer demand for healthier and sustainable food options. The meat alternatives sector, followed by the dairy alternatives sector, leads the proteins market within this segment, reflecting the changing consumer preferences toward plant-sourced products.
Personal Care & Cosmetics Segment in Europe Protein Market
The Personal Care and Cosmetics segment is emerging as the fastest-growing sector in the European protein market, projected to achieve a growth rate of approximately 6% during 2024-2029. This accelerated growth is driven by increasing consumer awareness of protein-based personal care products and their benefits for skin and hair care. The segment's expansion is particularly notable in natural and organic product formulations, where proteins play a crucial role in product effectiveness. Collagen protein and whey proteins are witnessing high demand in this segment due to their proven benefits in skin elasticity and hair strengthening applications. The growth is further supported by the rising trend of clean beauty products and increasing consumer preference for natural ingredients in cosmetic formulations. The segment is experiencing significant innovation in protein-based formulations, particularly in anti-aging products and hair care solutions.
Remaining Segments in End User Segmentation
The Animal Feed and Supplements segments constitute significant portions of the European protein market, each serving distinct consumer needs. The Animal Feed segment maintains a strong presence due to the growing demand for protein-enriched animal nutrition, particularly in livestock and pet food applications. The segment benefits from increasing awareness among pet owners about the importance of protein in animal diets and the growing livestock industry across Europe. The Supplements segment, particularly driven by sports nutrition and elderly nutrition sub-segments, continues to evolve with changing consumer preferences and increasing health consciousness. Both segments are characterized by ongoing innovation in protein supplement formulations and increasing focus on quality and sustainability in protein sourcing.
Europe Protein Market Geography Segment Analysis
Protein Market in Russia
Russia dominates the European protein market, commanding approximately 16% of the total market volume in 2024. The country's protein landscape is predominantly driven by the plant protein segment, particularly in the food and beverage industry. The market demonstrates strong growth potential through robust product developments and significant government initiatives supporting protein production. The bakery and meat alternatives segments have emerged as key application areas, with manufacturers focusing on innovative protein formulations to meet evolving consumer preferences. The country's protein market benefits from its strong agricultural base and increasing investments in protein processing facilities. Recent developments in pea protein production, exemplified by Uralchem Innovation's establishment of a pilot plant for pea isolate production, showcase the country's commitment to expanding its protein manufacturing capabilities. The market also benefits from growing consumer awareness about protein-enriched products and their health benefits, driving demand across various end-user segments.
Protein Market in France
France's protein market is projected to demonstrate remarkable growth, with an expected CAGR of approximately 5% during 2024-2029. The country's protein industry is experiencing a transformative phase, driven by significant government backing and growing demand for animal-free protein ingredients. The launch of collaborative projects like AlinOVeg, focusing on developing the French plant-based protein industry with emphasis on peas and fava beans, exemplifies the country's commitment to protein innovation. The beverage category has emerged as a particularly dynamic segment, with manufacturers introducing innovative protein-fortified drinks to meet evolving consumer preferences. The country's strong agricultural foundation and robust food processing infrastructure provide a solid base for protein market expansion. The growing acceptance of plant-based alternatives among French consumers, coupled with increasing health consciousness, continues to drive market growth. The market also benefits from strong research and development activities, with companies focusing on improving functional protein functionality and application versatility.
Protein Market in Germany
Germany's protein market demonstrates robust development, characterized by strong innovation in plant-based alternatives and significant investments in protein processing infrastructure. The country's market is particularly driven by the rising number of vegans and flexitarians, with approximately 8.12 million people identifying as vegetarians/vegans or significantly reducing their meat consumption in 2022. The food and beverage segment leads market applications, with meat and dairy alternatives claiming significant shares. German consumers increasingly prioritize sustainable and health-conscious protein options, driving manufacturers to develop innovative protein formulations. The market benefits from advanced research and development facilities, enabling the creation of novel protein applications. The country's strong retail infrastructure and well-established distribution networks facilitate efficient market penetration of protein products. Additionally, Germany's position as a key European economic hub attracts significant investments in protein processing facilities.
Protein Market in United Kingdom
The United Kingdom's protein market exhibits strong growth dynamics, driven by increasing consumer awareness of protein-enriched products and growing health consciousness. The market demonstrates particular strength in the sports and nutrition segment, supported by the country's robust fitness industry and growing gym membership rates. British consumers show increasing preference for protein-fortified products, particularly in the ready-to-eat and functional beverage categories. The personal care and cosmetics segment has emerged as a significant growth driver, with manufacturers incorporating various protein types in skincare and haircare formulations. The country's market benefits from strong research and development activities, leading to innovative protein applications. The shift towards plant-based alternatives continues to influence market dynamics, with manufacturers responding through new product developments and formulation improvements. The UK's well-developed retail infrastructure and strong e-commerce presence facilitate efficient market penetration of protein products.
Protein Market in Other Countries
The protein market in other European countries, including Spain, Italy, Belgium, Netherlands, and Turkey, demonstrates diverse growth patterns influenced by regional preferences and economic conditions. These markets show varying degrees of development in different protein segments, with some countries focusing on traditional protein sources while others embrace innovative alternatives. Countries like Spain and Italy demonstrate particular strength in specific applications such as sports nutrition and personal care products. The Benelux region shows growing acceptance of plant-based protein, while Eastern European countries focus on developing their protein processing infrastructure. These markets benefit from the overall European trend towards healthier lifestyle choices and increasing protein consumption. The varying regulatory frameworks and consumer preferences in these countries create unique market opportunities and challenges. The markets also show increasing interest in sustainable protein sources and novel applications, particularly in the food and beverage sector.
Get Analysis on Important Geographic Markets
Download PDF
Competitive Landscape
Top Companies in Europe Protein Market
The European protein market is characterized by intense competition and continuous innovation among key players. Companies are heavily investing in research and development to create novel protein ingredients, particularly focusing on plant-based alternatives and enhanced functionality for various applications. Operational agility has become crucial as manufacturers adapt to shifting consumer preferences, with many players expanding their production capabilities and modernizing facilities to meet growing demand. Strategic partnerships and collaborations, especially with technology providers and research institutions, have emerged as a common approach to strengthen market positions. Geographic expansion remains a key focus, with companies establishing new production facilities and distribution networks across different European regions to better serve local markets and reduce supply chain complexities.
Market Dominated by Diversified Global Players
The European protein market exhibits a moderately consolidated structure, with major global conglomerates holding significant market share alongside specialized regional players. These leading companies typically maintain diverse protein portfolios spanning both animal and plant-based options, leveraging their extensive research capabilities and established distribution networks. The market landscape is characterized by a mix of long-standing agricultural processors who have expanded into protein ingredients and specialized protein manufacturers focused on specific segments like sports nutrition or plant-based alternatives. The presence of strong regional players, particularly in countries like Germany and France, adds another layer of competition, as these companies often possess a deep understanding of local preferences and established relationships with regional food manufacturers.
The market has witnessed significant merger and acquisition activity, primarily driven by larger companies seeking to expand their protein portfolios and gain access to innovative technologies. Traditional food ingredient companies are actively acquiring specialized protein manufacturers to strengthen their position in the growing plant-based segment. Vertical integration strategies are becoming increasingly common, with companies acquiring raw material suppliers to ensure consistent quality and supply chain control. Cross-border acquisitions have also increased as companies seek to establish stronger footholds in different European regions and access new customer bases.
Innovation and Sustainability Drive Future Success
Success in the European protein market increasingly depends on companies' ability to innovate while maintaining sustainable practices throughout their operations. Market leaders are focusing on developing proprietary processing technologies and unique protein formulations to differentiate their offerings and command premium pricing. Establishing strong relationships with food and beverage manufacturers through customized solutions and technical support has become crucial for maintaining market share. Companies are also investing heavily in sustainable sourcing practices and transparent supply chains to meet growing consumer and regulatory demands for environmentally responsible products.
For emerging players and market contenders, success lies in identifying and serving niche segments with specialized protein solutions. Companies entering the market are focusing on innovative extraction technologies and novel protein sources to differentiate themselves from established players. Building a strong regional presence before expanding internationally has proven effective for newer entrants. The increasing focus on local sourcing and sustainability creates opportunities for smaller players to compete effectively in specific market segments. Regulatory compliance, particularly regarding novel protein sources and health claims, remains a critical factor for both established and emerging players, with companies needing to maintain robust quality control systems and documentation processes.
Europe Protein Industry Leaders
-
Archer Daniels Midland Company
-
Darling Ingredients Inc.
-
International Flavors & Fragrances, Inc.
-
Kerry Group plc
-
Royal FrieslandCampina N.V
- *Disclaimer: Major Players sorted in no particular order

Need More Details on Market Players and Competitors?
Download PDF
Recent Industry Developments
- May 2024: Roquette introduced NUTRALYS® Fava S900M, a fava bean protein isolate, in Europe and North America. The company added this product to its NUTRALYS® plant protein range, marking it as the first protein isolate derived from fava beans in its lineup.
- April 2024: Arla Foods Ingredients has signed an agreement to acquire Volac's Whey Nutrition business. The acquisition involves purchasing shares in Volac Whey Nutrition Holdings Limited and its subsidiaries, Volac Whey Nutrition Limited and Volac Renewable Energy Limited. Volac, a UK-based company, specializes in processing whey into ingredients for sports nutrition, with by-products sold for food and animal nutrition.
- April 2024: Arla Foods Ingredients has reached an agreement to acquire Volac’s Whey Nutrition business. The UK-based Volac group specializes in turning whey into ingredients for sports nutrition, with by-products being sold for food and animal nutrition.
Europe Protein Market Report Scope
Animal, Microbial, Plant are covered as segments by Source. Animal Feed, Food and Beverages, Personal Care and Cosmetics, Supplements are covered as segments by End User. Belgium, France, Germany, Italy, Netherlands, Russia, Spain, Turkey, United Kingdom are covered as segments by Country.
Source
| Animal | By Protein Type | Casein and Caseinates |
| Collagen | ||
| Egg Protein | ||
| Gelatin | ||
| Insect Protein | ||
| Milk Protein | ||
| Whey Protein | ||
| Other Animal Protein | ||
| Microbial | By Protein Type | Algae Protein |
| Mycoprotein | ||
| Plant | By Protein Type | Hemp Protein |
| Pea Protein | ||
| Potato Protein | ||
| Rice Protein | ||
| Soy Protein | ||
| Wheat Protein | ||
| Other Plant Protein |
End User
| Animal Feed | ||
| Food and Beverages | By Sub End User | Bakery |
| Beverages | ||
| Breakfast Cereals | ||
| Condiments/Sauces | ||
| Confectionery | ||
| Dairy and Dairy Alternative Products | ||
| Meat/Poultry/Seafood and Meat Alternative Products | ||
| RTE/RTC Food Products | ||
| Snacks | ||
| Personal Care and Cosmetics | ||
| Supplements | By Sub End User | Baby Food and Infant Formula |
| Elderly Nutrition and Medical Nutrition | ||
| Sport/Performance Nutrition | ||
Country
| Belgium |
| France |
| Germany |
| Italy |
| Netherlands |
| Russia |
| Spain |
| Turkey |
| United Kingdom |
| Rest of Europe |
| Source | Animal | By Protein Type | Casein and Caseinates |
| Collagen | |||
| Egg Protein | |||
| Gelatin | |||
| Insect Protein | |||
| Milk Protein | |||
| Whey Protein | |||
| Other Animal Protein | |||
| Microbial | By Protein Type | Algae Protein | |
| Mycoprotein | |||
| Plant | By Protein Type | Hemp Protein | |
| Pea Protein | |||
| Potato Protein | |||
| Rice Protein | |||
| Soy Protein | |||
| Wheat Protein | |||
| Other Plant Protein | |||
| End User | Animal Feed | ||
| Food and Beverages | By Sub End User | Bakery | |
| Beverages | |||
| Breakfast Cereals | |||
| Condiments/Sauces | |||
| Confectionery | |||
| Dairy and Dairy Alternative Products | |||
| Meat/Poultry/Seafood and Meat Alternative Products | |||
| RTE/RTC Food Products | |||
| Snacks | |||
| Personal Care and Cosmetics | |||
| Supplements | By Sub End User | Baby Food and Infant Formula | |
| Elderly Nutrition and Medical Nutrition | |||
| Sport/Performance Nutrition | |||
| Country | Belgium | ||
| France | |||
| Germany | |||
| Italy | |||
| Netherlands | |||
| Russia | |||
| Spain | |||
| Turkey | |||
| United Kingdom | |||
| Rest of Europe | |||
Need A Different Region or Segment?
Customize Now
Market Definition
- End User - The Protein Ingredients Market operates on a B2B basis. Food, Beverages, Supplements, Animal Feed, and Personal Care & Cosmetic manufacturers are considered to be end-consumers in the market studied. The scope excludes manufacturers buying liquid/dry whey to be used for application as a binding agent or thickener or other non-protein applications.
- Penetration Rate - Penetration Rate is defined as the percentage of Protein-Fortified End User Market Volume in the Overall End User Market Volume.
- Average Protein Content - Average protein content is the average protein content present per 100 g of product manufactured by all end-user companies considered under the scope of this report.
- End User Market Volume - End-user market volume is the consolidated volume of all types and forms of end-user products in the country or region.
| Keyword | Definition |
|---|---|
| Alpha-lactalbumin (α-Lactalbumin) | It is a protein that regulates the production of lactose in the milk of almost all mammalian species. |
| Amino acid | It is an organic compound that contains both amino and carboxylic acid functional groups, which are required for the synthesis of body protein and other important nitrogen-containing compounds, such as creatine, peptide hormones, and some neurotransmitters. |
| Blanching | It is the process of briefly heating vegetables with steam or boiling water. |
| BRC | British Retail Consortium |
| Bread improver | It is a flour-based blend of several components with specific functional properties designed to modify dough characteristics and give quality attributes to bread. |
| BSF | Black Soldier Fly |
| Caseinate | It is a substance produced by adding an alkali to acid casein, a derivative of casein. |
| Celiac disease | Celiac disease is an immune reaction to eating gluten, a protein found in wheat, barley, and rye. |
| Colostrum | It is a milky fluid that’s released by mammals that have recently given birth before breast milk production begins. |
| Concentrate | It is the least processed form of protein and has a protein content ranging from 40-90% by weight. |
| Dry protein basis | It refers to the percentage of "pure protein" present in a supplement after the water in it is completely removed through heat. |
| Dry whey | It is the product resulting from drying fresh whey which has been pasteurized and to which nothing has been added as a preservative. |
| Egg protein | It is a mixture of individual proteins, including ovalbumin, ovomucoid, ovoglobulin, conalbumin, vitellin, and vitellenin. |
| Emulsifier | It is a food additive that facilitates the blending of foods that are immiscible with one another, such as oil and water. |
| Enrichment | It is the process of addition of micronutrients that are lost during the processing of the product. |
| ERS | Economic Research Service of the USDA |
| Extrusion | It is the process of forcing soft mixed ingredients through an opening in a perforated plate or die designed to produce the required shape. The extruded food is then cut to a specific size by blades. |
| Fava | Also known as Faba, it is another word for yellow split beans. |
| FDA | Food and Drug Administration |
| Flaking | It is a process in which typically a cereal grain (like corn, wheat, or rice) is broken down into grits, cooked with flavors and syrups, and then pressed into flakes between cooled rollers. |
| Foaming agent | It is a food ingredient that makes it possible to form or maintain a uniform dispersion of a gaseous phase in a liquid or solid food. |
| Foodservice | It refers to the part of the food industry which includes businesses, institutions, and companies which prepare meals outside the home. It includes restaurants, school and hospital cafeterias, catering operations, and many other formats. |
| Fortification | It is the deliberate addition of micronutrients that are not found in them naturally or which are lost during processing, to improve a food product's nutritional value. |
| FSANZ | Food Standards Australia New Zealand |
| FSIS | Food Safety and Inspection Service |
| FSSAI | Food Safety and Standards Authority of India |
| Gelling agent | It is an ingredient that functions as a stabilizer and thickener to provide thickening without stiffness through the formation of gel. |
| GHG | Greenhouse Gas |
| Gluten | It is a family of proteins found in grains, including wheat, rye, spelt, and barley. |
| Hemp | It is a botanical class of Cannabis sativa cultivars grown specifically for industrial or medicinal use. |
| Hydrolysate | It is a form of protein manufactured by exposing the protein to enzymes that can partially break the bonds between the protein's amino acids and break down large, complicated proteins into smaller pieces. Its processing makes it easier and quicker to digest. |
| Hypoallergenic | It refers to a substance that causes fewer allergic reactions. |
| Isolate | It is the purest and most processed form of protein which has undergone separation to obtain a pure protein fraction. It typically contains ≥ 90% of protein by weight. |
| Keratin | It is a protein that helps form hair, nails, and the outer layer of skin. |
| Lactalbumin | It is the albumin contained in milk and obtained from whey. |
| Lactoferrin | It is an iron‑binding glycoprotein that is present in the milk of most mammals. |
| Lupin | It is the yellow legume seeds of the genus Lupinus. |
| Millenial | Also known as Generation Y or Gen Y, it refers to the people born from 1981 to 1996. |
| Monogastric | It refers to an animal with a single-compartmented stomach. Examples of monogastric include humans, poultry, pigs, horses, rabbits, dogs, and cats. Most monogastric are generally unable to digest much cellulose food materials such as grasses. |
| MPC | Milk protein concentrate |
| MPI | Milk protein isolate |
| MSPI | Methylated soy protein isolate |
| Mycoprotein | Mycoprotein is a form of single-cell protein, also known as fungal protein, derived from fungi for human consumption. |
| Nutricosmetics | It is a category of products and ingredients that act as nutritional supplements to care for skin, nails, and hair natural beauty. |
| Osteoporosis | It is a medical condition in which the bones become brittle and fragile from loss of tissue, typically as a result of hormonal changes, or deficiency of calcium or vitamin D. |
| PDCAAS | Protein digestibility-corrected amino acid score (PDCAAS) is a method of evaluating the quality of a protein based on both the amino acid requirements of humans and their ability to digest it. |
| Per-capita consumption of animal protein | It is the average amount of animal protein (such as milk, whey, gelatin, collagen, and egg proteins) that is readily available for consumption by each person in an actual population. |
| Per-capita consumption of plant protein | It is the average amount of plant protein (such as soy, wheat, pea, oat, and hemp proteins) that is readily available for consumption by each person in an actual population. |
| Quorn | It is a microbial protein manufactured using mycoprotein as an ingredient, in which the fungus culture is dried and mixed with egg albumen or potato protein, which acts as a binder, and then is adjusted in texture and pressed into various forms. |
| Ready-to-Cook (RTC) | It refers to food products that include all of the ingredients, where some preparation or cooking is required through a process that is given on the package. |
| Ready-to-Eat (RTE) | It refers to a food product prepared or cooked in advance, with no further cooking or preparation required before being eaten. |
| RTD | Ready-to-Drink |
| RTS | Ready-to-Serve |
| Saturated fat | It is a type of fat in which the fatty acid chains have all single bonds. It is generally considered unhealthy. |
| Sausage | It is a meat product made of finely chopped and seasoned meat, which may be fresh, smoked, or pickled and which is then usually stuffed into a casing. |
| Seitan | It is a plant-based meat substitute made out of wheat gluten. |
| Softgel | It is a gelatin-based capsule with a liquid fill. |
| SPC | Soy protein concentrate |
| SPI | Soy protein isolate |
| Spirulina | It is a biomass of cyanobacteria that can be consumed by humans and animals. |
| Stabilizer | It is an ingredient added to food products to help maintain or enhance their original texture, and physical and chemical characteristics. |
| Supplementation | It is the consumption or provision of concentrated sources of nutrients or other substances that are intended to supplement nutrients in the diet and is intended to correct nutritional deficiencies. |
| Texturant | It is a specific type of food ingredient that is used to control and alter the mouthfeel and texture of food and beverage products. |
| Thickener | It is an ingredient that is used to increase the viscosity of a liquid or dough and make it thicker, without substantially changing its other properties. |
| Trans fat | Also called trans-unsaturated fatty acids or trans fatty acids, it is a type of unsaturated fat that naturally occurs in small amounts in meat. |
| TSP | Textured soy protein |
| TVP | Textured vegetable protein |
| WPC | Whey protein concentrate |
| WPI | Whey protein isolate |
Need More Details on Market Definition?
Ask a Question
Research Methodology
Mordor Intelligence follows a four-step methodology in all our reports.
- Step-1: Identify Key Variables: The quantifiable key variables (industry and extraneous) pertaining to the specific product segment and country are selected from a group of relevant variables & factors based on desk research & literature review; along with primary expert inputs. These variables are further confirmed through regression modeling (wherever required).
- Step-2: Build a Market Model: In order to build a robust forecasting methodology, the variables and factors identified in Step-1 are tested against available historical market numbers. Through an iterative process, the variables required for market forecast are set and the model is built on the basis of these variables.
- Step-3: Validate and Finalize: In this important step, all market numbers, variables and analyst calls are validated through an extensive network of primary research experts from the market studied. The respondents are selected across levels and functions to generate a holistic picture of the market studied.
- Step-4: Research Outputs: Syndicated Reports, Custom Consulting Assignments, Databases & Subscription Platforms

Get More Details On Research Methodology
Download PDF


