
Market Overview
| Study Period | 2021 - 2031 |
|---|---|
| Forecast Data Period | 2026 - 2031 |
| Base Year Market Size (2025) | USD 4.8 Billion |
| Market Size (2026) | USD 5.09 Billion |
| Market Size (2031) | USD 6.82 Billion |
| Growth Rate (2026 - 2031) | 6.02 % |
| Market Concentration | Medium |
Major Players *Disclaimer: Major Players sorted in no particular order Image © Mordor Intelligence. Reuse requires attribution under CC BY 4.0. | |
Europe Protein Bar Market Analysis by Mordor Intelligence
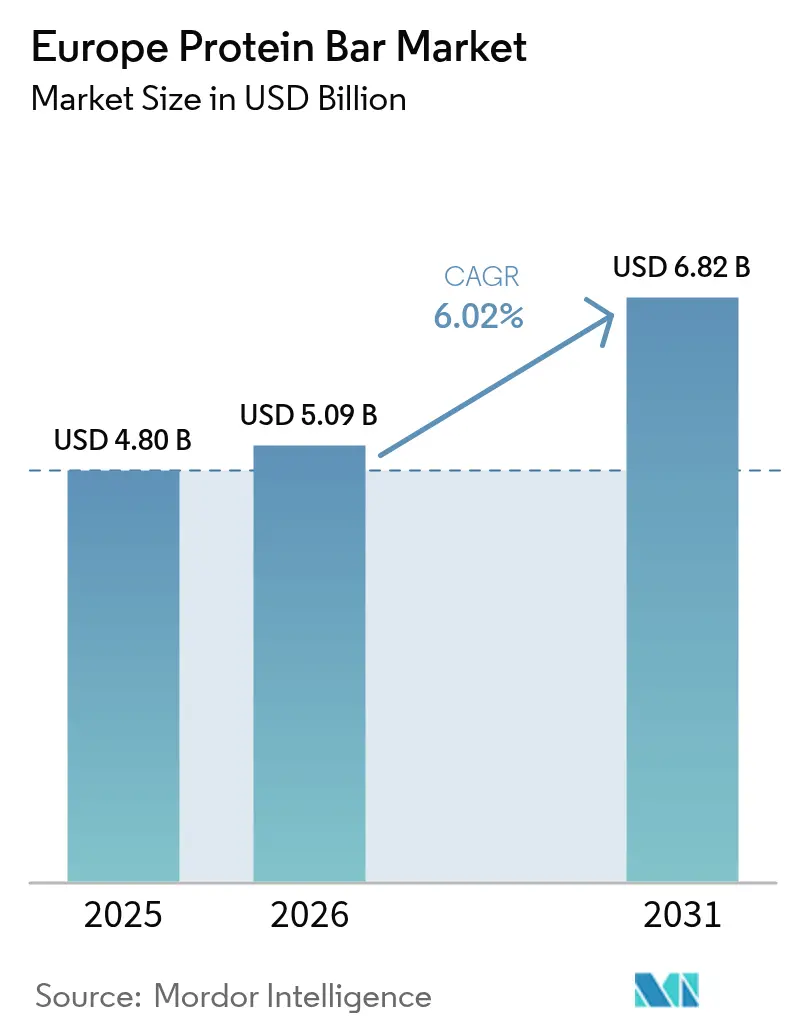
European protein bars market size in 2026 is estimated at USD 5.09 billion, growing from 2025 value of USD 4.8 billion with 2031 projections showing USD 6.82 billion, growing at 6.02% CAGR over 2026-2031. The market advancement is primarily attributed to increasing consumer preferences for nutritionally balanced, convenient food products that accommodate demanding schedules and support health objectives. The market encompasses diverse consumer segments, including professional athletes, fitness practitioners, and health-oriented individuals, who value the products' nutritional composition and consumption convenience. Market expansion is facilitated by emerging consumption patterns, including meal replacement solutions, heightened adoption of plant-based protein alternatives, and increased focus on sports nutrition. The market's distribution infrastructure encompasses established retail channels, including supermarkets and hypermarkets, complemented by the expanding e-commerce segment.
Key Report Takeaways
- By product type, sports nutritional bars held 41.68% of the European protein bars market share in 2025, while functional and wellness bars are projected to expand at an 8.05% CAGR through 2031.
- By protein source, animal-based bars commanded 66.75% share of the European protein bars market size in 2025, whereas plant-protein bars are advancing at a 7.55% CAGR to 2031.
- By distribution channel, supermarkets and hypermarkets captured 51.83% share of the European protein bars market size in 2025; online stores record the fastest CAGR at 9.25% through 2031.
- By geography, the United Kingdom led with 24.41% of the European protein bars market share in 2025, while Poland is forecast to grow at a 7.35% CAGR between 2026-2031.
Note: Market size and forecast figures in this report are generated using Mordor Intelligence’s proprietary estimation framework, updated with the latest available data and insights as of 2026.
Market Trends and Insights
Drivers Impact Analysis of Europe Protein Bar Market*
| Driver | (~) % Impact on CAGR Forecast | Geographic Relevance | Impact Timeline |
|---|---|---|---|
| Growth of on-the-go breakfast replacement habits | +1.2% | Global, with strongest adoption in United Kingdom, Germany, Netherlands | Medium term (2-4 years) |
| Growth of plant-based and vegan options | +0.9% | EU-wide, particularly strong in Germany, Netherlands, Scandinavia | Long term (≥ 4 years) |
| Popularity of fitness and sports nutrition | +1.5% | Global, with mature markets in United Kingdom, Germany, France leading | Short term (≤ 2 years) |
| Product Innovations support the market growth | +0.8% | Innovation hubs in Germany, United Kingdom, Netherlands, with spillover across EU | Medium term (2-4 years) |
| Increased marketing and branding efforts | +0.6% | Digital-first markets: United Kingdom, Germany, France, with expansion to Eastern Europe | Short term (≤ 2 years) |
| Eco-friendly and sustainable packaging | +0.4% | EU-wide, driven by regulatory compliance and consumer preference | Long term (≥ 4 years) |
| Source: Mordor Intelligence | |||
Growth of on-the-go breakfast replacement habits
The rise in on-the-go breakfast habits drives the European protein bar market growth. With increasing urbanization and fast-paced lifestyles, consumers seek convenient and nutritious options for quick consumption. Protein bars align with this trend by providing a balanced mix of protein, fiber, and essential nutrients, making them suitable as meal replacements or breakfast alternatives. These products particularly appeal to working professionals, students, and travelers who often miss traditional breakfast due to time constraints. The employment rate and workforce size in Europe directly influence the demand for convenient breakfast solutions. According to The House of Commons, the United Kingdom recorded 34.21 million employed individuals aged 16 and above between April and June 2025, with a 75.2% employment rate for people aged 16-64 [1]. This substantial working population, managing both professional and personal commitments, requires quick and healthy food options that integrate into their daily routines. Protein bars fulfill this requirement by offering portable nutrition.
Growth of Plant-Based and Vegan Options
The European protein bar market demonstrates significant expansion driven by the increasing prevalence of plant-based and vegan alternatives. Consumer consciousness regarding health implications, environmental sustainability, and animal welfare considerations has facilitated a transition toward plant-based dietary options. Protein bars formulated with plant-derived sources, including peas, rice, hemp, and soy, have established substantial market presence, addressing consumer requirements for clean-label, vegan-compliant, and allergen-free products. This market evolution transcends traditional vegan and vegetarian demographics, encompassing flexitarian consumers who are systematically reducing meat consumption. The comprehensive distribution of plant-based protein bars through supermarket chains, specialized health food establishments, and digital commerce platforms has enhanced product accessibility. Furthermore, the integration of novel protein sources has enhanced the nutritional composition of plant-based bars, resonating with health-oriented and environmentally conscious consumers.
Popularity of Fitness and Sports Nutrition
The Europe protein bar market is driven by the increasing adoption of fitness and sports nutrition products. The growing health awareness and active lifestyles across Europe have increased the demand for convenient nutritional products that aid in muscle building, recovery, and fitness goals. Protein bars have gained popularity among fitness enthusiasts, athletes, and active individuals seeking readily available sources of high-quality protein and energy. These products have evolved from sports supplements to mainstream health foods, catering to a broad consumer base engaged in physical activities and wellness routines. The addition of functional ingredients, including electrolytes, vitamins, and superfoods, has enhanced their appeal in the sports nutrition category. The fitness industry's growth in Europe demonstrates the market potential. For instance, Germany, a key European market, reported approximately 11.3 million fitness club members in 2023, according to EuropeActive. This indicates a substantial consumer base committed to regular exercise, representing the target market for protein bars focused on performance enhancement and post-workout recovery.
Increased Marketing and Branding Efforts
Marketing and branding initiatives contribute significantly to the expansion of the European protein bar market as organizations establish market presence and sustained consumer relationships. Companies implement strategic advertising campaigns, professional collaborations, and targeted marketing initiatives to engage health-conscious consumers and establish product differentiation through quality standards and product innovation. These strategic branding initiatives facilitate consumer education regarding product advantages and promote emerging categories, including plant-based, organic, and functional protein bars. Marketing strategies emphasize product convenience, palatability, and nutritional composition to attract both athletic individuals and consumers seeking nutritious alternatives. For instance, the acquisition of Kellanova by Mars in 2024 demonstrates strategic market consolidation to enhance competitive positioning. This corporate transaction aligns with Mars's strategic objective to double its snacking operations within a decade, indicating a substantial commitment to protein bar market development.
Restraints Impact Analysis of Europe Protein Bar Market*
| Restraint | (~) % Impact on CAGR Forecast | Geographic Relevance | Impact Timeline |
|---|---|---|---|
| Market saturation and intense competition | -1.8% | Mature markets: United Kingdom, Germany, France, with spillover effects EU-wide | Short term (≤ 2 years) |
| High ingredient costs | -1.4% | Global impact, particularly affecting cost-sensitive markets in Eastern Europe | Medium term (2-4 years) |
| Stringent regulations | -0.7% | EU-wide, with varying compliance costs across member states | Long term (≥ 4 years) |
| Limited awareness in certain demographics | -0.5% | Rural areas and older demographics across European Union, particularly in Southern and Eastern Europe | Medium term (2-4 years) |
| Source: Mordor Intelligence | |||
Market Saturation and Intense Competition
The Europe protein bar market faces significant constraints due to market saturation and intense competition. The market has become increasingly crowded with numerous brands, including global manufacturers, local producers, and niche players, all offering diverse protein bar products. This saturation creates barriers for new market entrants and makes it difficult for existing companies to maintain or expand their market share without increasing promotional expenditure and product innovation. The extensive product selection has resulted in price competition, lower profit margins, and increased pressure to differentiate products through quality, ingredients, and brand positioning. Additionally, companies must continuously innovate to remain competitive, leading to higher research and development costs and operational challenges. The market also faces issues with counterfeit and substandard products in certain regions, which affects consumer confidence in protein bar brands.
High Ingredient Costs
The elevated costs of raw materials present a significant constraint in the European protein bar market. Premium protein sources, including whey and plant-based proteins, combined with specialty ingredients such as organic superfoods and natural sweeteners, command substantially higher prices compared to conventional alternatives. These increased raw material expenditures result in heightened production costs, creating challenges for manufacturers in maintaining competitive pricing while sustaining profit margins. Raw material price fluctuations, attributed to supply chain disruptions, agricultural yield variations, and geopolitical factors, contribute to financial uncertainties. The subsequent increase in retail prices potentially deters price-sensitive consumers, particularly within emerging markets and lower-income demographic segments. Manufacturers encounter significant challenges in identifying cost-effective alternatives while adhering to consumer requirements for clean-label and natural ingredients without compromising product quality standards.
*Our forecasts treat driver/restraint impacts as directional, not additive. The impact forecasts reflect baseline growth, mix effects, and variable interactions.
Europe Protein Bar Market Segment Analysis
By Product Type:
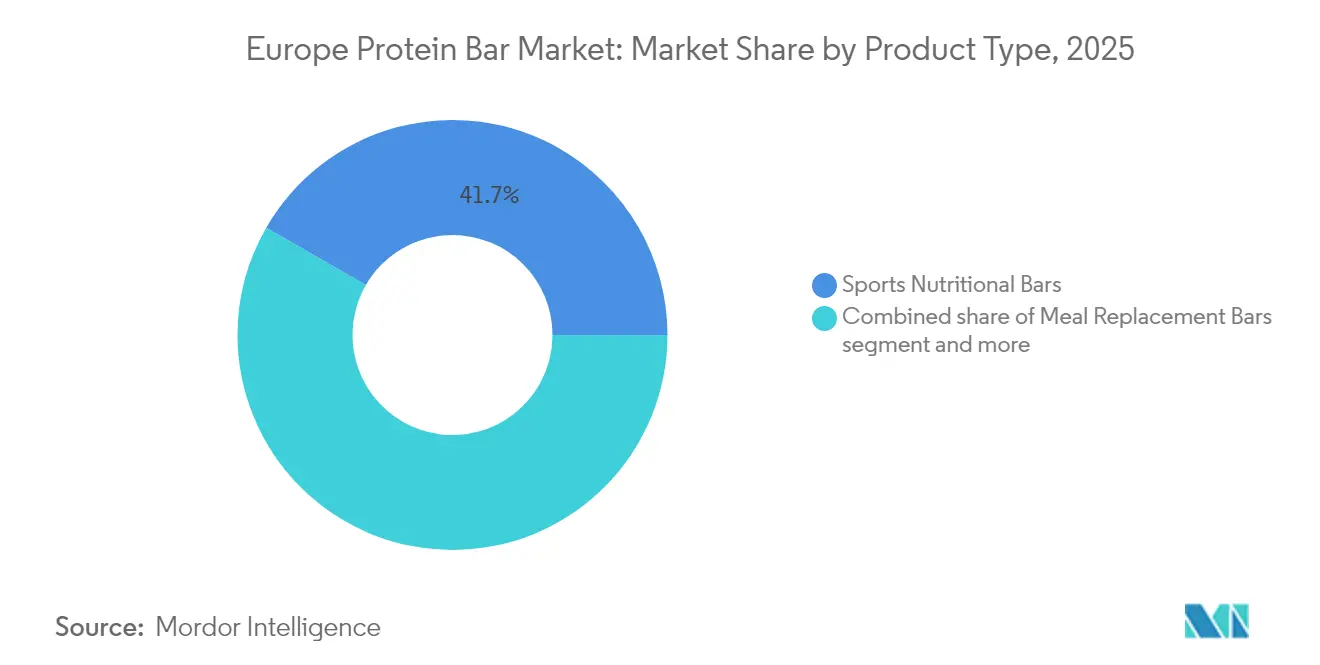
Functional Bars Drive Future GrowthSports nutritional bars dominate the market with a 41.68% share in 2025, driven by increasing consumer engagement in fitness and sports activities. These bars provide targeted nutrition for athletic performance and recovery through high protein content, meeting the needs of athletes and active individuals focused on muscle development and endurance. Established distribution channels and widespread consumer recognition reinforce their market position. The growing emphasis on health consciousness and popularity of high-protein and ketogenic diets further strengthens demand for these convenient nutritional solutions.
The functional and wellness bars segment is projected to grow at an 8.05% CAGR through 2031, supported by increasing consumer focus on comprehensive health and wellness. These bars deliver specific health benefits, including immune support and metabolic health enhancement, attracting a broad consumer base. The segment's growth is driven by demand for nutritious, convenient snacking options that align with busy lifestyles. Consumer preference for clean-label, organic, and natural ingredients, combined with ongoing product innovation in flavors and formulations, supports continued market expansion.

By Protein Source:
Plant Proteins Gain Strategic MomentumAnimal protein-based bars maintain a 66.75% market share in 2025 owing to their comprehensive amino acid profiles and established consumer preferences. These bars incorporate protein sources including whey, casein, and egg protein, which deliver all essential amino acids required for muscle growth, recovery, and overall health. Fitness enthusiasts and athletes select these bars for their efficacy in meeting elevated protein requirements and supporting performance objectives. The demonstrated bioavailability of animal proteins and consumers' established familiarity with these ingredients sustain this segment's market leadership.
Plant protein-based bars grew at a 7.55% CAGR, driven by sustainability concerns and dietary preferences. Consumer awareness of environmental impacts from animal protein production has increased the demand for sustainable food alternatives. For instance, according to the World Population Review, by 2025, the vegan population reached 4% in Sweden, Denmark, and Norway, with Italy following at 3% . This expanding vegan demographic supported the growth of plant-based protein bars made from peas, rice, and nuts as nutritious alternatives to animal protein products.
By Distribution Channel:
Digital Commerce Reshapes AccessSupermarkets and hypermarkets command a 51.83% market share in 2025, leveraging established consumer shopping habits and physical store advantages. These retail channels enable customers to examine products directly and make immediate purchases, a significant factor for nutritional bar sales, which often occur through impulse buying. Dedicated shelf space, promotional displays, and in-store marketing strengthen their market position. The established consumer trust in these retail formats supports product credibility and encourages repeat purchases, solidifying their position as primary distribution channels for protein bars across regions.
Online stores demonstrate the highest growth rate in the protein bars market at 9.25% CAGR. This expansion stems from consumers seeking convenience, product variety, and competitive prices through e-commerce platforms. The online channel provides access to a wider product range, including specialized items not commonly found in physical stores. Subscription services and targeted marketing enhance the digital shopping experience for health-conscious consumers. Supporting this trend, the Office for National Statistics (UK) reports that internet sales comprised 26.3% of total retail sales in Great Britain by March 2025, indicating a significant shift in consumer purchasing patterns toward digital platforms .

Geography Analysis
United Kingdom Protein Bar Market
The United Kingdom holds a 24.41% market share in European protein bars consumption in 2025, driven by its mature sports nutrition market and consumer preference for premium products. The country's extensive distribution networks enable broad market penetration across diverse consumer segments, from fitness enthusiasts to casual consumers seeking nutritious snacks. The market environment supports both niche and mainstream protein bar brands, establishing the United Kingdom as a vital European market development center.
Germany and Poland Protein Bar Market
Germany's position as Europe's largest food market creates substantial opportunities for protein bar growth, supported by its population size and increasing health consciousness. The country's robust retail infrastructure and fitness-oriented consumer base make it an important market for manufacturers. Poland shows the highest growth potential in Europe's protein bar market, with a projected 7.35% CAGR through 2031. This expansion stems from higher disposable incomes, growing health awareness, and improved retail accessibility in urban and rural areas.
Broader European Markets
The Netherlands, Belgium, and Sweden represent established protein bar markets with consumers favoring premium, organic, and clean-label products. These markets exhibit strong health consciousness and consumer willingness to purchase quality nutrition products. Their geographic positioning offers distribution advantages for broader European market access, making them strategic entry points for manufacturers seeking regional expansion.
Regulatory Landscape
Protein bars sold across Europe are governed by EU horizontal food rules, anchored by Regulation (EU) No 1169/2011. For pre-packed bars, the mandatory nutrition declaration (energy, fat, saturates, carbohydrate, sugars, protein, salt) and prominent allergen declarations listed in Annex II, when present as ingredients or processing aids, continue to shape formulation choices and drive pack redesign across retail and e-commerce.
The EU Novel Foods framework, including its Union list process, regulates new inputs, with 2026 authorizations showing how novel ingredients can be incorporated into bar formulations under defined conditions of use. In February 2026, the European Commission authorized defatted rapeseed powder (NapiFeryn BioTech Sp. z o.o.) for EU market placement for five years, and in July 2026 it authorized edible Jatropha curcas L. kernels (Chuta Nut GmbH), with permitted use including cereal bars. Enforcement signals remain relevant for brand risk management, including a May 2026 RASFF notification from Sweden concerning undeclared allergens in protein bars, which reinforces the focus on allergen control and label accuracy.
Competitive Landscape
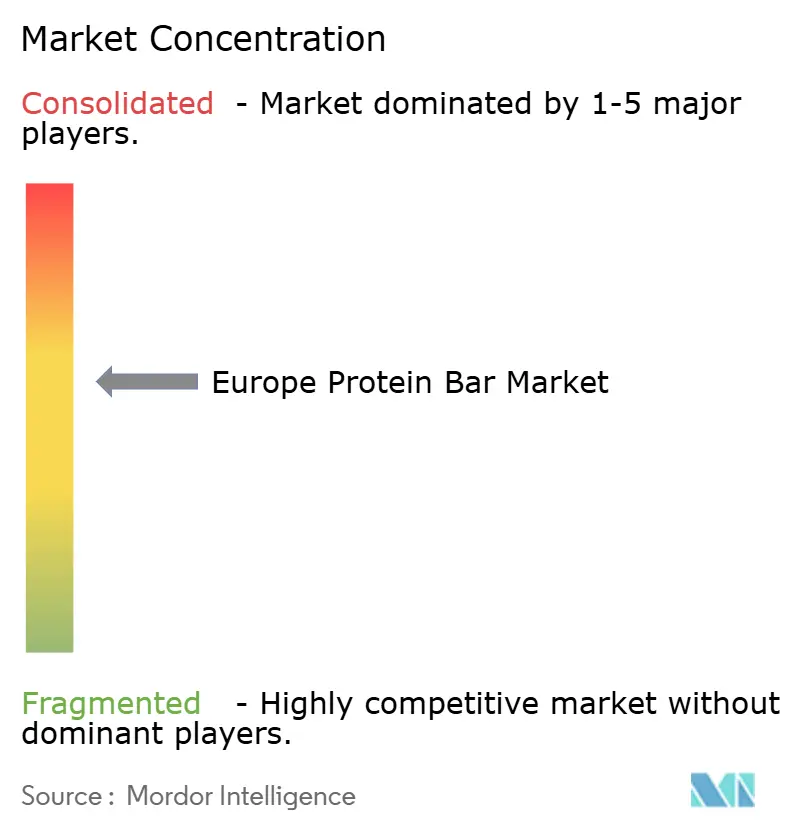
The European protein bars market shows moderate concentration, with major players including Mars Inc., Mondelēz International, Inc., Nestlé S.A., General Mills Inc., and Glanbia plc controlling significant market shares. These companies maintain their positions through established brand portfolios, diverse product lines, and extensive distribution networks across Europe. While these large companies dominate the market, numerous smaller niche brands operate successfully, particularly in specialized segments such as vegan, keto, and organic products.
The market presents growth opportunities in underserved demographic segments. Manufacturers can gain market share by developing products and marketing strategies that address the specific dietary requirements and preferences of these consumer groups. This targeted approach can strengthen customer loyalty and drive market expansion.
European protein bar manufacturers are investing in supply chain optimization and personalized nutrition solutions. Companies analyze online consumer data to improve product formulations and offer customized nutrition options aligned with individual dietary preferences. The adoption of subscription-based delivery models helps improve customer retention and provides consistent product access. These digital initiatives enhance operational efficiency and consumer engagement, supporting long-term market growth.
Europe Protein Bar Industry Leaders
-
Mars Inc.
-
Mondelēz International, Inc.
-
Nestlé S.A.
-
General Mills Inc.
-
Glanbia plc
- *Disclaimer: Major Players sorted in no particular order
Europe Protein Bar Market Companies Covered in this Report
- Mars Inc.
- Mondel?z International, Inc.
- Nestle S.A.
- General Mills Inc.
- Glanbia plc
- Barebells Functional Foods AB
- PepsiCo Inc.
- Kellogg Co.
- Class Delta Ltd. (Protein Works)
- Nutrition Group, PLC
- Myprotein (THG plc)
- Warrior (KBF Enterprises)
- Bulk
- Foodspring GmbH
- PowerBar Europe GmbH
- Arla Foods amba
- Carbery Group (Opti-Bar)
- Body&Fit (Glambia)
- Multipower (Atlantic Multipower)
- Weider Europe
Market Opportunities and Future Outlook
Manufacturing scale-up and tighter in-house control over multilayer production are creating room for premium, customized, and private-label protein bar supply in Europe. BioTechUSA completed an investment program in Hungary reported in January 2026, expanding its Szada site with new production and storage space and adding a multi-layer protein bar line, with capacity stated at 75 million bars annually. In July 2026, Newton Food reported completing a EUR 3.5 million investment in Lithuania that lifted annual capacity to 50 million protein bars, pointing to a growing regional base for co-manufacturing and faster innovation cycles across flavors, textures, and functional formats.
Within the EU, the Novel Foods pathway and the labeling requirements under Regulation (EU) No 1169/2011 act as practical gates to commercialization. Companies that pair ingredient innovation with validated safety dossiers, strong allergen controls, and transparent on-pack communication should have a clearer route to wider retail listings and online subscription models.
Recent Industry Developments in Europe Protein Bar Market
- July 2026: Newton Food completed a EUR 3.5 million investment in Lithuania to enhance protein bar manufacturing, lifting reported annual capacity to 50 million bars. The added scale strengthens the regional co-manufacturing base and enables faster response to retailer and brand demand for new formats and flavors.
- June 2026: The Protein Brewery raised additional funding to scale Fermotein, a mycelium-based ingredient, at its Mijkenbroek, Netherlands facility for use in active nutrition applications including bars. The investment supports ingredient diversification and ongoing product development across plant-based and novel protein formats.
- May 2026: A RASFF notification from Sweden reported undeclared allergens in protein bars, highlighting ongoing label accuracy and allergen management requirements for compliance across the EU market. The alert prompted brand owners to review labeling controls and supplier declarations, reinforcing the priority of transparent nutrition and allergen information.
Europe Protein Bar Market Report Scope and Research Methodology
Market Definition and Coverage
This market covers the value of protein bars sold for consumption across Europe, counted as packaged nutrition bars positioned around higher protein content and everyday snacking or functional use, across retail and online channels.
Scope exclusions: We exclude protein powders, ready-to-drink shakes, homemade or unpackaged bars, and non-protein snack bars that do not make a clear protein-led product claim.
Segments Covered in This Report
- By Product Type
- Sports Nutritional Bars
- Meal Replacement Bars
- Weight Management Bars
- Functional/Wellness Bars
- Others
- By Protein Source
- Animal Protein-Based Bars
- Plant Protein-Based Bars
- By Distribution Channel
- Supermarkets / Hypermarkets
- Convenience Stores
- Specialty Stores
- Online Stores
- Other Distribution Channels
- By Geography
- Europe
- Germany
- United Kingdom
- Italy
- France
- Spain
- Netherlands
- Poland
- Belgium
- Sweden
- Rest of Europe
- Europe
Data Sources, Market Sizing, and Validation
Desk Research
Desk work started by building a clean fact base on packaged snack foods and sports nutrition in Europe, so the later sizing math stayed grounded. We referred to public sources such as Eurostat for household spend and retail indicators, UN Comtrade for trade flows of relevant food preparations, and FAOSTAT for broader agricultural supply context that can influence ingredient availability.
This was then supplemented using items such as national food agency publications and labeling guidance, customs and tariff notes where helpful, and peer-reviewed nutrition and food science journals to understand common formulation trends. We also reviewed company annual reports, investor presentations, and reputable press coverage for launches, channel priorities, and pricing direction. For company financials, news, and patent signals, a paid subscription database was used selectively to speed up screening and cross-check timelines. These desk research sources are illustrative rather than exhaustive, and we used additional public and internal references for data collection, validation, and clarification.
Primary Interviews and Surveys
We interview European manufacturers, distributors, retailers, and nutrition specialists, and use surveys to test purchase occasions, acceptable prices, protein claims, channel use, and product switching. Expert feedback is used to validate secondary signals, fill country-level gaps, and adjust the final market model.
Distribution of primary research fieldwork respondents
| Company type | Respondent position |
|---|---|
| Top tier: 28% | CXOs: 18% |
| Mid tier: 47% | Functional/Unit leaders: 32% |
| Smaller Players: 25% | Managers: 50% |
Market-Sizing & Forecasting
Our sizing starts with a top-down demand pool build that uses Europe packaged snack and sports nutrition spending signals, followed by country weights that reflect modern grocery penetration and online snack purchases. To keep totals grounded, the outputs are checked with selective bottom-up approximations using sampled brand and channel price points, typical pack sizes, and implied volumes from retail shelf presence and distributor feedback.
A few practical inputs are used as model drivers, such as average selling price bands by channel, online share progression, protein source mix shifts (animal to plant), claim-led innovation cadence, and the rate at which new consumption occasions replace traditional confectionery snacks. Where country-level detail is thin, we apply gap-handling rules that borrow ratios from comparable markets with similar retail structures, and then re-test the assumptions with interview feedback.
For forecasting, we rely on scenario analysis supported by simple time series checks, since pricing and channel mix can move more than volumes in snack categories. The scenarios are anchored to expected inflation normalization, private label activity, and retailer promotion intensity, and then adjusted using the expert consensus gathered during primary discussions.
Data Validation & Update Cycle
Each major step is validated through cross-checks that compare the model totals with independent signals, such as country snack bar category momentum, price ladder movements, and reported channel expansion activity. When an outlier is seen, we revisit the assumption, recalculate the country roll-up, and trigger follow-up calls to confirm whether it reflects a real market change or a data artifact.
Before sign-off, the work is reviewed in more than one analyst pass so calculation logic, units, and currency treatment stay consistent across countries. Reports are refreshed annually, and interim updates are made if there are material events like policy changes, sharp ingredient cost moves, or step-changes in retail availability. Right before delivery, we run a final review so clients receive the most current version of the model.
Mordor Intelligence's Europe Protein Bar Market Size Compared With Other Published Estimates
Published market sizes for Europe protein bars can look different because not everyone uses the same product boundary, country coverage, or pricing approach, and timing also matters when inflation has been uneven. We see the biggest swings when a source mixes broader snack bars into the count, applies a single regional price, or relies on older base-year assumptions that were not rechecked with channel feedback.
Retail price ladder checks, country-level channel split validation, and claim-based product screening are the evidence points that keep Mordor Intelligence's estimate tied to protein-led bars sold through measurable retail and online routes. Key gaps usually come from whether meal replacement and weight management bars are consistently included, how Russia and smaller European countries are treated, and whether the estimate is built from 2024, 2025, or 2026 pricing with consistent currency timing.
Benchmark comparison
| Source | Market Size | Gaps in Research Methodology |
|---|---|---|
| Mordor Intelligence | USD 4.80 B (2025) | |
| Industry Publisher A | USD 4.65 B (2024) | Uses an earlier base year, and the country list and channel mapping differ, which can understate post-2024 price mix changes and newer online-led expansion. |
| Market Analytics Firm B | USD 6.31 B (2025) | Appears to apply broader inclusion rules and higher regional price assumptions, which can pull adjacent snack bar formats or premium pricing into the total more aggressively. |
Taken together, the spread is mainly explained by boundary choices and the year and pricing lens used, not by a single growth assumption. By keeping the steps traceable to channel prices, country coverage, and a clear protein-led product screen, the final number stays balanced and repeatable when the model is updated.
Key Questions Answered in the Report
How large is the European protein bars market in 2026?
It is valued at USD 5.09 billion and is projected to reach USD 6.82 billion by 2031.
Which product segment is growing the fastest in European protein bars?
Functional and wellness bars lead with an 8.05% CAGR through 2031.
What share do animal-based bars hold in Europe?
They account for 66.75% of 2025 sales, although plant-based bars are growing faster.
Which sales channel is expanding most quickly?
Online stores are advancing at a 9.25% CAGR thanks to subscription models and direct-to-consumer strategies.