
Market Overview
| Study Period | 2020 - 2031 |
|---|---|
| Forecast Data Period | 2026 - 2031 |
| Base Year Market Size (2025) | USD 3.24 Trillion |
| Market Size (2026) | USD 3.63 Trillion |
| Market Size (2031) | USD 6.41 Trillion |
| Growth Rate (2026 - 2031) | 12.03 % |
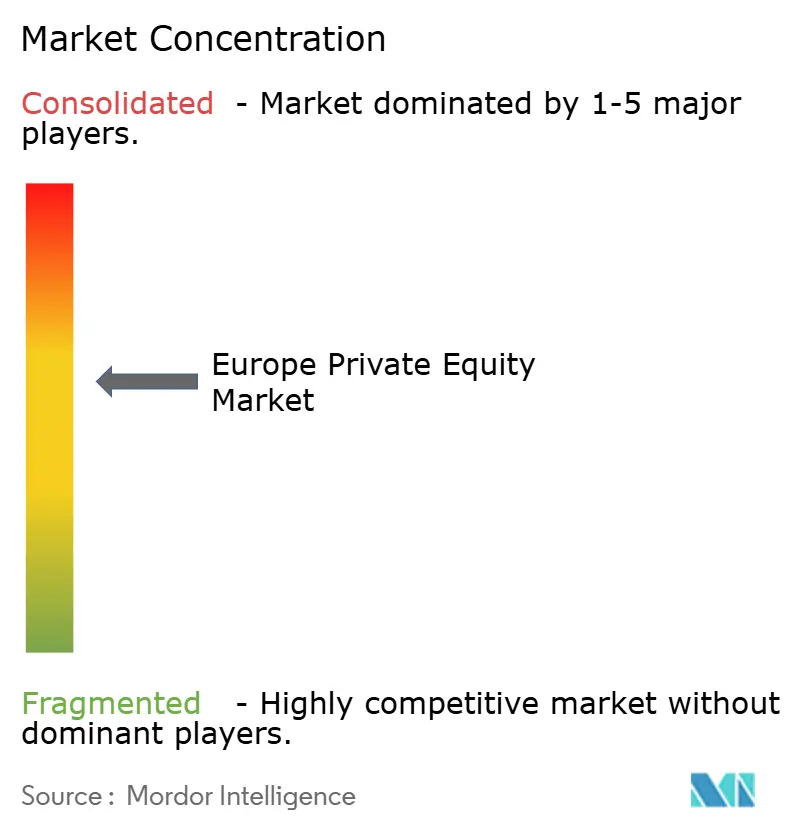
| Market Concentration | Medium |
Major Players *Disclaimer: Major Players sorted in no particular order Image © Mordor Intelligence. Reuse requires attribution under CC BY 4.0. | |
Europe Private Equity Market Analysis by Mordor Intelligence
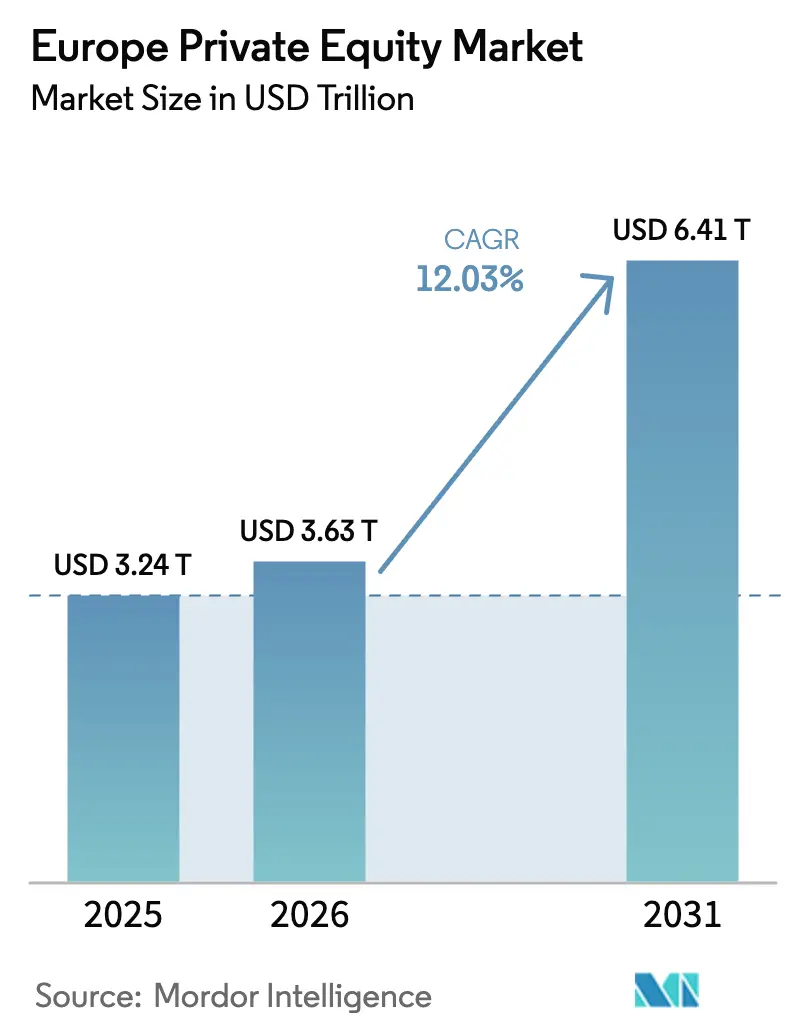
Europe private equity market size in 2026 is estimated at USD 3.63 trillion, growing from 2025 value of USD 3.24 trillion with 2031 projections showing USD 6.41 trillion, growing at 12.03% CAGR over 2026-2031. A blend of strong dry-powder deployment pressure, regulatory moves toward sustainable finance, faster digital adoption after the pandemic, and innovative exit tools such as continuation vehicles underpins this expansion. Buyout managers still dominate deal flow, yet secondary and continuation strategies gain traction as institutional investors seek liquidity without exiting the asset class. Technology retains the largest industry allocation while healthcare accelerates fastest, both benefiting from macro themes of digitization and population ageing. At the same time, the United Kingdom keeps its lead in capital raised and deals closed, even as Spain posts the highest forward growth rate due to pro-investment reforms and solid GDP momentum. Competitive intensity rises as mega-managers consolidate assets, but mid-market specialists stay relevant by targeting fragmented European SME niches.
Key Report Takeaways
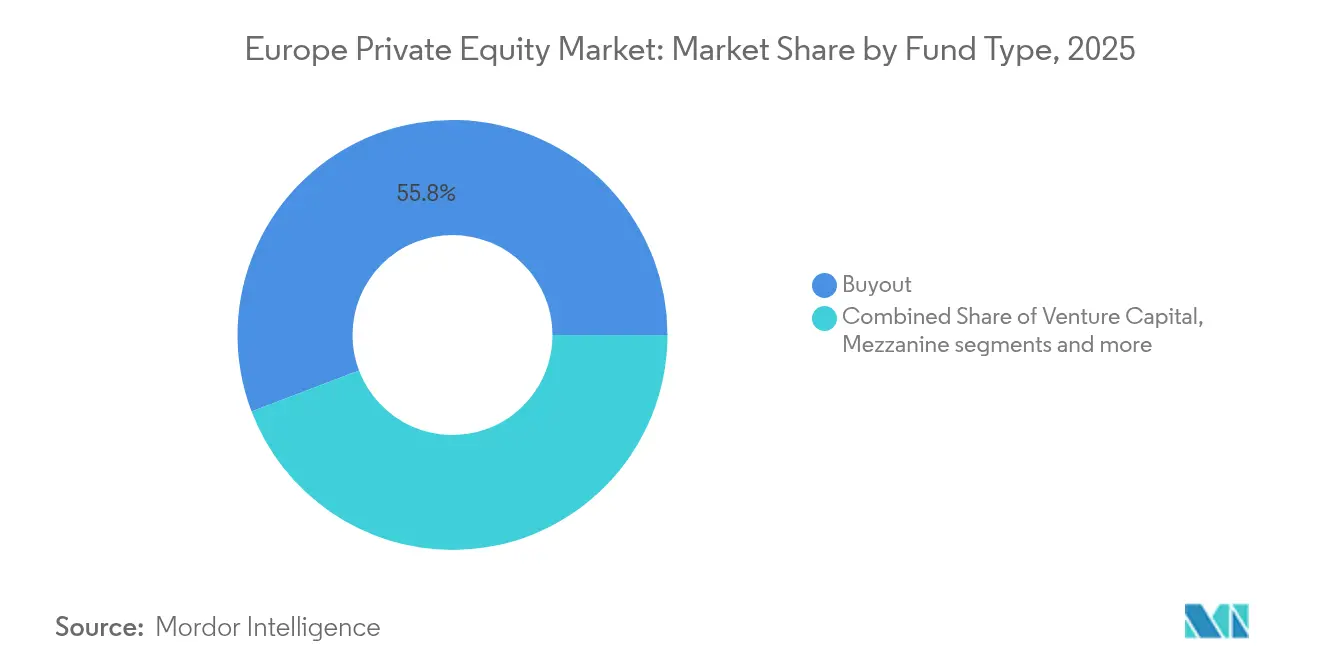
- By fund strategy, Buyout funds held 55.78% of the Europe private equity market share in 2025, whereas Secondaries & Fund-of-Funds record a 12.17% CAGR through 2031.
- By investment size, Upper Middle Market deals captured 43.02% of the Europe private equity market size in 2025, while Small & SMID transactions advanced at an 11.62% CAGR through 2031.
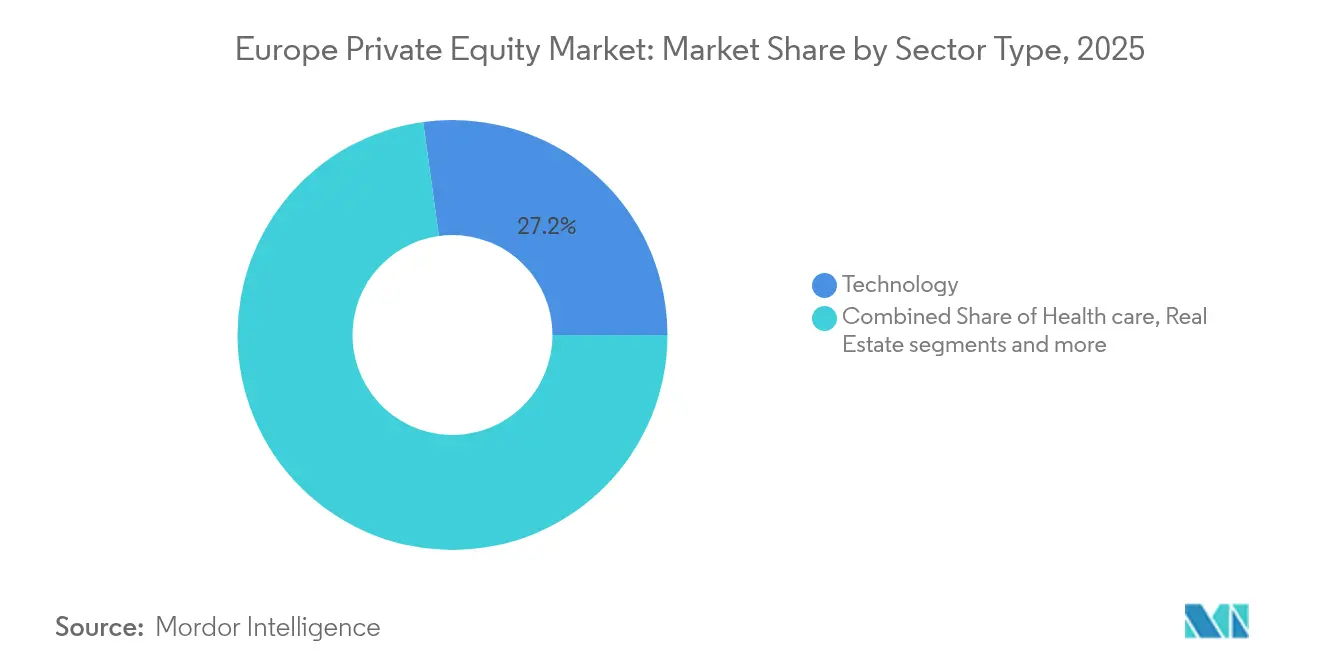
- By sector, Technology accounted for 27.18% of the Europe private equity market share in 2025; Healthcare expands fastest at a 14.22% CAGR to 2031.
- By country, the United Kingdom led with 25.06% revenue share in 2025, as Spain grows at a 10.37% CAGR to 2031.
Note: Market size and forecast figures in this report are generated using Mordor Intelligence’s proprietary estimation framework, updated with the latest available data and insights as of 2026.
Market Trends and Insights
Drivers Impact Analysis of Europe Private Equity Market*
| Driver | ( ~ ) % Impact on CAGR Forecast | Geographic Relevance | Impact Timeline |
|---|---|---|---|
| Persistent dry-powder overhang and LP pressure to deploy capital | +2.8% | Global – strongest in UK, Germany, France | Short term (≤ 2 years) |
| EU Green Deal incentives steering PE toward sustainability-linked assets | +1.9% | EU-wide – Nordic region, Germany | Medium term (2–4 years) |
| Digital-first business models scaling rapidly in post-COVID Europe | +2.1% | Pan-European – UK, France, Netherlands | Short term (≤ 2 years) |
| Secondary buyout wave driven by fund-to-fund trades | +1.6% | Major European financial hubs | Medium term (2–4 years) |
| Niche funds targeting succession in Mittelstand family businesses | +1.2% | Germany, Austria, Switzerland | Long term (≥ 4 years) |
| Surge in GP-led continuation vehicles unlocking trapped value | +2.0% | UK and Nordic markets | Short term (≤ 2 years) |
| Source: Mordor Intelligence | |||
Persistent Dry-Powder Overhang and LP Pressure to Deploy Capital
European limited partners now hold unprecedented uncalled commitments, which fuel steady deal activity despite cyclical headwinds. Fundraising reached USD 118.8 billion in the first three quarters of 2024, almost matching the prior year total as pension plans and sovereign funds raised their allocation targets. Average holding periods stretch to 6.7 years, intensifying the need for larger tickets and off-market sourcing to absorb capital. Managers compete for scarce high-quality assets, often agreeing to higher entry multiples while concurrently designing ambitious operational-value plans to sustain returns. This behavior supports near-term growth in the Europe private equity market.
EU Green Deal Incentives Steering PE Toward Sustainability-Linked Assets
The Sustainable Finance Disclosure Regulation pushes Article 8 and 9 funds to nearly two-thirds of Europe’s fund launches. Private equity houses embed ESG targets directly into carried-interest hurdles, aligning teams with emissions-reduction or diversity metrics. The Corporate Sustainability Reporting Directive demands extensive disclosures, raising compliance costs for smaller managers yet rewarding early movers with access to larger pools of capital[1]Invest Europe, “Invest Europe Yearbook 2024,” investeurope.eu . Green-tilted deals in renewables, resource-efficient manufacturing, and circular business models regularly command premium exit valuations, pulling fresh capital into the Europe private equity market.
Digital-First Business Models Scaling Rapidly in Post-COVID Europe
Technology-enabled firms, from SaaS and AI to logistics platforms, maintain resilient topline growth, drawing EUR 24 billion of private equity capital in 2023 alone. Deep-tech investment grew to EUR 15 billion in 2024, while AI-enabled creative suite provider Freepik surpassed 800,000 subscribers. Private equity operators install data-analytics playbooks across portfolio companies to enhance pricing, procurement, and customer retention, creating repeatable value-creation levers. This digital imperative sustains deal flow and multiples within the Europe private equity market.
Secondary Buyout Wave Driven by Fund-to-Fund Trades
Exit windows through IPOs remain narrow, so fund-to-fund deals have risen to the leading exit route. Continuation funds now represent 13% of European exits, granting liquidity to existing LPs while allowing GPs to keep outperforming assets. Transaction structures favor negotiated partnerships rather than auctions, trimming friction costs and reducing bid-ask spreads. The phenomenon keeps assets circulating within the Europe private equity market ecosystem and moderates the impact of public-market volatility on distributions.
Restraints Impact Analysis of Europe Private Equity Market*
| Restraint | ( ~ ) % Impact on CAGR Forecast | Geographic Relevance | Impact Timeline |
|---|---|---|---|
| Valuation reset amid higher interest rates compressing exit multiples | -2.3% | Global leveraged deals | Short term (≤ 2 years) |
| Regulatory scrutiny on “national champions” deals delaying approvals | -1.1% | France, Germany, Italy | Medium term (2–4 years) |
| Fund-level ESG disclosure costs squeezing smaller GPs | -0.8% | EU-wide mid-market | Medium term (2–4 years) |
| Talent crunch in operational value-creation teams | -0.9% | London, Frankfurt, Paris | Long term (≥ 4 years) |
| Source: Mordor Intelligence | |||
Valuation Reset Amid Higher Interest Rates Compressing Exit Multiples
European Central Bank rate hikes raise discount rates and debt service costs, trimming equity valuations for levered businesses. Lower-growth industrial assets suffer the largest multiple compression, compelling sponsors to lean more on revenue and margin expansion rather than financial engineering[2]Neuberger Berman, “Rates and Valuations,” nb.com. Private debt funds step in to bridge financing gaps, but pricing still trails the record-low coupons of the pre-2022 cycle. This environment weighs on exit proceeds and temporarily tempers expansion momentum in the Europe private equity market.
Regulatory Scrutiny on “National Champions” Deals Delaying Approvals
Deal approvals now require deeper disclosures under the EU Foreign Subsidies Regulation[3]Debevoise & Plimpton, “EU Foreign Subsidies Regulation Insight,” debevoise.com . France, Germany, and Italy tighten screenings for critical-infrastructure and tech assets, extending closing timelines and occasionally forcing buyers to restructure transactions. While not halting activity, these interventions inject execution risk and add diligence costs, particularly for large-cap purchases. This headwind moderately offsets growth in the Europe private equity market.
*Our forecasts treat driver/restraint impacts as directional, not additive. The impact forecasts reflect baseline growth, mix effects, and variable interactions.
Europe Private Equity Market Segment Analysis
By Fund Type:
Buyout Dominance Faces Secondary Market DisruptionBuyout funds controlled 55.78% of the Europe private equity market in 2025, attracting institutional investors that value strong governance rights and cash flow predictability. Yet, secondaries and fund-of-funds log a 12.17% CAGR to 2031, fueled by record LP demand for liquidity. Continuation funds now comprise 84% of GP-led secondary volume, a structure that extends hold periods without forgoing upside. Main Capital’s USD 603 million software vehicle and Corsair’s USD 600 million fintech continuation fund illustrate this shift. The Europe private equity market size for secondaries is therefore poised to widen materially.
Ongoing regulatory clarity under AIFMD II and the expansion of specialist secondary managers broaden the investor base. Pension boards allocate more to these strategies to smooth cash-flow profiles and dampen vintage-year risk, gradually nudging market share away from pure buyout pools. Even so, flagship buyout franchises retain scale advantages in sourcing and portfolio support, defending their lead in the Europe private equity market.


By Investments:
Upper Middle Market Leadership Challenged by Small Cap AccelerationUpper Middle Market tickets of EUR 100 million - EUR 500 million captured 43.02% of the Europe private equity market size in 2025, contributed by their balance of complexity and liquidity. Small & SMID deals, however, are expanding at an 11.62% CAGR, helped by average 10.2 times EBITDA entry multiples versus 13.3 times in the United States. Europe’s fragmented SME base, 99% of all businesses, offers roll-up potential at favorable valuations.
Sponsors establish dedicated origination teams to surface proprietary small-cap opportunities while leveraging operational playbooks to professionalize management processes quickly. ECB support for domestic credit markets sustains leverage availability for bolt-on acquisitions, reinforcing growth in this niche of the Europe private equity market.
By Sector:
Technology Dominance Meets Healthcare AccelerationTechnology retained 27.18% of the Europe private equity market share in 2025, buoyed by software, AI, and digital solutions producing recurring revenue and high margins. Healthcare now posts the fastest advance at 14.22% CAGR as ageing demographics and efficiency reforms fuel demand for provider outsourcing and specialized pharmaceuticals. The Europe private equity market size captured by healthcare assets is projected to rise sharply as buyout groups pursue clinic networks, contract research organizations, and med-tech platforms.
Cross-sector convergence adds upside: sponsors deploy AI into clinical decision support and employ SaaS tools to streamline hospital workflows, thereby lifting exit multiples. Real estate, services, and industrials still draw interest, though growth trajectories lag the two headline sectors.
Geography Analysis
Europe Private Equity Market
Europe’s private equity hubs remain concentrated, yet performance diverges across jurisdictions. The United Kingdom commands the largest pool of talent, advisors, and exit venues, supporting 25.06% of 2025 deal value. A stable legal regime and deep capital markets aid rapid fundraising and syndication. Germany’s share is anchored by industrial tech and succession-driven mid-market buyouts, exemplified by TPG’s USD 4.5 billion purchase of Aareon. France’s 2024 deal jump stems from reforms that boosted investment caps and overhauled labor laws, coupled with a vibrant TMT pipeline.
Spain’s momentum is striking. Private equity funds there delivered 11.2% net IRR in 2023, and sustainable Article 8/9 funds achieved 14.6%. Spain recorded 1,076 M&A deals worth USD 56.5 billion in 2024, including 264 sponsor transactions. Domestic houses such as Magnum and Portobello launched new vehicles exceeding EUR 2.5 billion, reinforcing fundraising depth. Italy adds diversification: USD 44.6 billion of 2023 deal value represented roughly 40% of its M&A market, with industrials climbing to 28% of activity. Southern Europe overall saw private equity deal value rise 31.4% to USD 93.8 billion even as volumes dipped, pointing to bigger average tickets. Cross-border expansion strategies intensify, with managers leveraging operational expertise across multiple countries to unlock margin gains. Nordic managers sustain global reputations despite smaller home markets, often leading pan-European consortiums. This mix of mature and emerging hotspots creates a balanced, opportunity-rich landscape for the Europe private equity market.
Regulatory Landscape
Europe private equity activity is shaped by the EU alternative investment framework and fast-evolving reporting rules, with ESMA providing guidance on fund management and AIFMD reporting expectations. AIFMD II entered into force on 15 April 2024, and EU member states faced a 16 April 2026 transposition deadline, pushing managers and depositaries to update delegation, liquidity risk management, and loan-origination governance where applicable.
Derivatives and clearing reforms also influence portfolio hedging, financing, and treasury practices used across buyout and secondary strategies. EMIR III (Directive (EU) 2024/2994) requires national transposition by 25 June 2026, and ESMA indicated that reporting entities subject to the EMIR active account requirement need to be ready to provide data by July 2026. The United Kingdom continues its post-Brexit redesign of the AIFM regime, including proposals to reclassify AIFMs based on NAV thresholds, adding an additional compliance track for managers marketing into or operating across both the UK and EU.
Value Chain Analysis
The Europe private equity value chain starts with fundraising from institutional LPs (pensions, insurers, sovereign investors, endowments) and runs through fund formation and structuring under AIFM rules, with administrators, depositaries, legal counsel, and placement agents supporting product setup and ongoing operations. Deal sourcing is led by sponsor networks and intermediaries (investment banks, M&A boutiques), while execution depends on diligence providers covering financial, tax, commercial, technology, and ESG workstreams. Financing partners (banks and private debt funds) provide acquisition leverage and refinancing options, and underwriting has increasingly emphasized operational improvement over leverage, with leverage ratios cited around 50% in recent industry evidence.
After acquisition, operating partners and specialist vendors deliver value creation across pricing, procurement, digital transformation, and add-on M&A, with 2026 playbooks emphasizing AI integration and data analytics across portfolio companies. Exit pathways include trade sales, sponsor-to-sponsor transactions, IPOs (selective), and a growing secondary ecosystem where GP-led continuation vehicles and dedicated secondary buyers provide liquidity and duration management. Invest Europe data showing buyout transaction value in 2025 at EUR 189.0 billion highlights the scale of the buyout channel within this chain, while recent 2026 transactions (for example, energy transition and infrastructure-linked platform investments) point to tighter integration across energy, data centers, and connectivity assets supporting AI infrastructure buildouts.
Competitive Landscape
Roughly 11,000 fund managers operate in Europe, yet the top 25 oversee 48% of managed enterprise value, confirming moderate concentration. CVC Capital Partners tops the list with USD 79.7 billion followed by KKR at USD 75.09 billion and EQT at USD 69.5 billion. Scale gives these groups priority access to marquee auctions, co-investment capacity, and technology budgets for data analytics and AI. American and British sponsors collectively manage USD 1.02 trillion, dwarfing German firms’ USD 49.8 billion despite Germany’s industrial heft.
Consolidation continues: publicly listed managers account for 84% of private equity M&A since 2012, buying specialist boutiques to deepen sector coverage. Sector focus sharpens competitive edges, Hg concentrates on TMT, Nordic Capital on healthcare and financial services, while continuation funds, defense assets, and energy transition platforms open fresh white spaces. Talent wars escalate for operating partners skilled in pricing, procurement, and digital transformation, contributing to rising cost structures.
Technology adoption marks the next frontier. Managers pilot AI engines to screen thousands of targets, accelerate diligence, and unlock portfolio efficiencies. ESG credentials also differentiate access to capital and premium valuations, driving investments in measurement systems and sustainability reporting. Overall, the Europe private equity market rewards diversified, tech-enabled, and operationally driven franchises while raising the bar for new entrants.
Europe Private Equity Industry Leaders
Permira partners
EQT
CVC Capital Partners
Apax Partners
Ardian
- *Disclaimer: Major Players sorted in no particular order
Europe Private Equity Market Companies Covered in this Report
- EQT
- CVC Capital Partners
- Permira
- Apax Partners
- Ardian
- Bridgepoint Group
- Cinven
- HgCapital
- Partners Group
- BC Partners
- Nordic Capital
- 3i Group
- Bain Capital
- Silver Lake
- KKR
- Oakley Capital
- Antin Infrastructure Partners
- IK Partners
- Sofinnova Partners
- SoftBank Vision Fund

Market Opportunities and Future Outlook
Scaling platform investments that combine digitalization with hard-asset backbones remains a key opportunity, particularly AI infrastructure and energy transition services where sponsors can apply operational toolkits and long-duration capital. In July 2026, EQT announced an agreement to acquire Copia Power, positioned around integrated power and AI infrastructure, showing how managers package generation, interconnection, and infrastructure capabilities into institutional-scale platforms. Permira-backed Quadrante (reported July 2026) also reflects sponsor demand for engineering and advisory capacity tied to energy transition execution, where fragmented service providers can support roll-ups and cross-border expansion.
Secondaries and continuation solutions remain a practical channel for liquidity management and GP-led asset retention, consistent with the report's emphasis on continuation vehicles. Fundraising capacity supports more mid-market deployment where proprietary sourcing and operational change can offset tighter exit windows; for example, CVC’s July 2026 final close of its Europe-focused Catalyst III fund at around EUR 3.0 billion points to dedicated capital for mid-market control deals. Healthcare services and enabling technologies also provide an actionable lane for European sponsors, supported by sector traction in the report context and reflected in platform investing activity such as Ardian’s July 2026 majority acquisition of Pflegia, a digital healthcare recruitment platform in Germany, which aligns workforce digitization with healthcare demand and compliance-driven hiring needs.
Recent Industry Developments in Europe Private Equity Market
- July 2026: CVC Capital Partners signed definitive agreement for majority investment in DistroKid (music distributor). The Europe-focused private equity transaction strengthens cross-border media and tech distribution investments and broad portfolio diversification.
- July 2026: Ardian acquired a majority stake in Pflegia, Germanys leading digital healthcare recruitment platform. The Germany digital health recruitment market expands as Ardian accelerates digital workforce solutions in Europe.
- July 2026: CVC Capital Partners final close of Catalyst III, Europe-focused mid-market private equity fund at ~€3.0 billion. This European mid-market PE fundraising milestone signals readiness to deploy substantial capital into mid-market deals, shaping deal flow dynamics.


Europe Private Equity Market Report Scope and Research Methodology
Market Definition and Coverage
For this study, the Europe private equity market is defined as the value of private equity assets and activity managed and deployed across European markets, including capital raised, invested, and held within PE fund structures, tracked in USD terms for consistency.
Scope exclusions: Excludes listed public equity investing, traditional mutual funds, and standard bank lending activities, even when they finance similar companies.
Segments Covered in This Report
- By Fund Type
- Buyout & Growth
- Venture Capital
- Mezzanine & Distressed
- Secondaries & Fund of Funds
- By Sector
- Technology (Software)
- Healthcare
- Real Estate and Services
- Financial Services
- Industrials
- Consumer & Retail
- Energy & Power
- Media & Entertainment
- Telecom
- Others (Transportation, etc.)
- By Investments
- Large Cap
- Upper Middle Market
- Lower Middle Market
- Small & SMID
- By Country
- United Kingdom
- Germany
- France
- Sweden
- Italy
- Spain
- Netherlands
- Rest of Europe
Data Sources, Market Sizing, and Validation
Desk Research
Desk research starts by building a clean fact base around fundraising, deal flow, and macro conditions that shape private capital activity in Europe. We use public datasets and regular disclosures to map the market logic, including European Central Bank statistics, Eurostat macro series, Bank for International Settlements indicators, European Securities and Markets Authority materials, and OECD finance and investment tables.
The desk phase is also used to cross-check timelines and definitions using annual reports and regulatory filings from fund managers, stock exchange announcements for exits, association publications, and reputable business press. Where available, we also reference paid subscriptions for company financials and intelligence, and we use a patent database when technology sector activity needs additional context. This list is illustrative, and many other public sources were used to collect data, validate assumptions, and clarify gaps.
Primary Interviews and Surveys
Primary work focuses on validating what the desk sources cannot fully explain, especially how capital is deployed across strategies and how pricing and leverage assumptions are changing. We speak with fund managers, limited partners, advisors, and other ecosystem participants across major European financial centers, and then reconcile inputs across countries to keep the final model consistent.
Inputs from these discussions are used to confirm fundraising pace, average holding periods, typical fee and carry structures, and the practical drivers behind exits and secondary activity. These details are then used to tighten the assumptions used in the sizing and forecast.
Distribution of primary research fieldwork respondents
| Company type | Respondent position |
|---|---|
| Top tier: 37% | CXOs: 12% |
| Mid tier: 47% | Functional/Unit leaders: 38% |
| Smaller Players: 16% | Managers: 50% |
Market-Sizing & Forecasting
The sizing model begins with a top-down reconstruction of the Europe private equity value pool by combining reported assets under management signals with capital raised, deployment rates, and realized exit values across the study period. From there, the totals are corroborated using selective bottom-up approximations, such as sampled fund vintage roll-ups, observed deal value patterns by country, and checks based on average ticket sizes multiplied by deal counts (an ASP-like approach). When mismatches show up repeatedly, the assumptions are adjusted accordingly.
A few inputs materially influence the model, including fundraising momentum by strategy, dry powder levels, average holding period trends, leverage availability (and cost), exit channel mix (IPO versus trade sale versus secondary), and sector allocation shifts that change the overall value trajectory. Where a bottom-up view is incomplete, such as in smaller cross-border deals that are not consistently disclosed, the gap is handled by scaling from countries with stronger reporting and then validating the uplift through interview feedback.
For forecasting, scenario analysis is used, since private equity markets tend to move in cycles and can shift quickly when rates, IPO windows, and credit conditions change. The base case is anchored on macro indicators and the expected deal environment, and the scenarios are pressure-tested with primary inputs on deployment appetite and exit feasibility.
Data Validation & Update Cycle
Validation is done through multiple checks so the final number does not rely on any single dataset or one respondent view. We compare the modeled totals against independent signals such as fundraising announcements, deal value trends, and broad AUM movements reported in public channels, and then investigate outliers country by country before sign-off.
A second analyst review is carried out to re-check assumptions, unit consistency, currency conversion timing, and year-over-year movements that look unusual. Reports are refreshed annually, and interim updates are made when major events materially change activity, such as sharp rate shifts or a sustained reopening or closing of exit markets. Before delivery, the latest public releases are re-scanned so clients receive an updated view.
Mordor Intelligence's Europe Private Equity Market Sizing Compared With Other Published Estimates
Published market sizes for Europe private equity can look far apart because the underlying definition is not always the same, and timing also matters when fundraising and exits swing from quarter to quarter. Differences usually come from what is counted as private equity value, which geographies inside Europe are fully covered, and how currency timing and price movements are handled.
Venture capital and private debt are often blended into some estimates, but these sit outside Mordor Intelligence's scope here, which keeps the value pool tied to private equity activity that is comparable across countries. Gaps also show up when one study uses aggressive deployment assumptions for dry powder, or when another study relies mainly on headline deal values without checking holding-period effects and exit timing. In those cases, the forecast slope can look steeper than what market signals support.
Benchmark comparison
| Source | Market Size | Gaps in Research Methodology |
|---|---|---|
| Mordor Intelligence | USD 3.24 T (2025) | |
| Regional Consultancy A | USD 2.90 T (2025) | Uses a narrower country set and emphasizes disclosed large-cap buyouts, which can undercount mid-market activity and smaller cross-border transactions. |
| Industry Association B | USD 3.85 T (2025) | Rolls venture and growth capital into the total and applies a faster AUM expansion path based on optimistic fundraising and deployment assumptions. |
The spread in the table is mainly explained by category inclusion and how totals are scaled when disclosure is uneven across countries. Our approach stays repeatable by tying the estimate to observable fundraising, deployment, and exit signals, and then using interviews to keep the assumptions realistic for the forecast years.


Key Questions Answered in the Report
What is the current value of the Europe private equity market?
The Europe private equity market size stood at USD 3.63 trillion in 2026 and is forecast to reach USD 6.41 trillion by 2031.
Which country holds the largest share of European private equity activity
The United Kingdom leads with 25.06% of 2025 deal value, supported by deep capital markets and a well-established advisory ecosystem.
Which segment of European private equity is growing fastest?
Secondaries & Fund-of-Funds post the highest growth at a 12.17% CAGR through 2031, driven by investor demand for liquidity and continuation vehicles.
How are rising interest rates affecting private equity valuations in Europe?
Higher rates compress exit multiples, particularly for low-growth industrial assets, prompting sponsors to focus more on operational improvements.
Page last updated on:


 Your data is secure and never sold or shared.


