
Europe Power Transistor Market Size and Share
Market Overview
| Study Period | 2020 - 2031 |
|---|---|
| Forecast Data Period | 2026 - 2031 |
| Base Year Market Size (2025) | USD 5.77 Billion |
| Market Size (2026) | USD 6.08 Billion |
| Market Size (2031) | USD 7.92 Billion |
| Growth Rate (2026 - 2031) | 5.41 % |
| Market Concentration | Medium |
Major Players *Disclaimer: Major Players sorted in no particular order Image © Mordor Intelligence. Reuse requires attribution under CC BY 4.0. | |
Europe Power Transistor Market Analysis by Mordor Intelligence
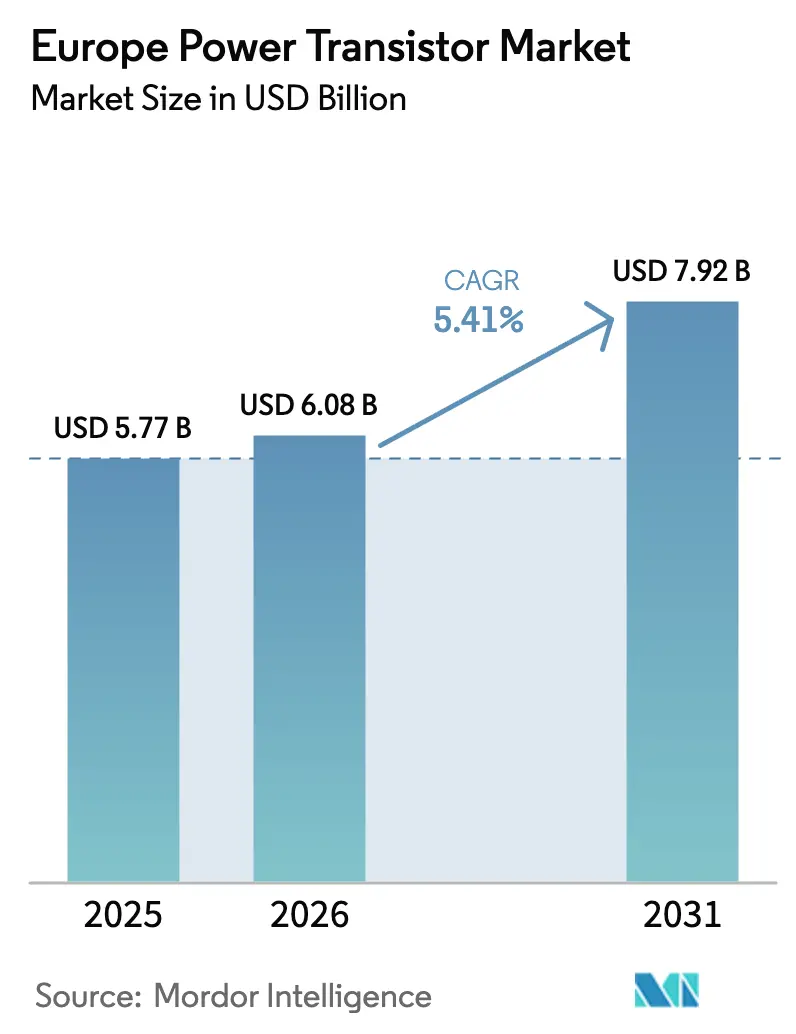
The Europe power transistor market size was valued at USD 5.77 billion in 2025 and estimated to grow from USD 6.08 billion in 2026 to reach USD 7.92 billion by 2031, at a CAGR of 5.41% during the forecast period (2026-2031). Momentum stems from accelerating electrification in mobility, renewable generation, and digital infrastructure. Automakers are shifting to silicon-carbide-based traction inverters that extend driving range and cut charging times, while utilities expand high-voltage direct-current links that demand robust high-efficiency switches. Wide-bandgap devices benefit from the European Union’s Green Taxonomy, which funnels low-cost capital to projects with verifiable efficiency gains. Meanwhile, data-center operators face strict power-usage-effectiveness rules that favor gallium-nitride converters delivering 98% efficiencies. Finally, the continent’s push for semiconductor sovereignty is spurring local production of SiC substrates and GaN epitaxy, tempering supply-chain risk and supporting long-term growth.
Key Report Takeaways
- By product, IGBT modules led with 29.31% revenue share in 2025; wide-bandgap transistors are projected to expand at a 7.38% CAGR to 2031.
- By material, silicon accounted for 56.78% of the Europe power transistor market share in 2025, while gallium nitride is set to grow at 6.26% CAGR through 2031.
- By type, MOSFETs captured 49.35% share of the Europe power transistor market size in 2025 and heterojunction bipolar transistors are advancing at a 5.75% CAGR through 2031.
- By packaging, power modules held 44.10% share in 2025; power ICs register the fastest-growth outlook at 6.03% CAGR through 2031.
- By power rating, medium-power devices commanded 45.32% share in 2025, whereas high-power devices above 600 V post a 5.31% CAGR through 2031.
- By end-user, automotive and EV/HEV applications led with 34.20% share in 2025; data centers and HPC are rising at a 6.43% CAGR through 2031.
- By application, inverters and converters took 30.74% of the Europe power transistor market size in 2025, while RF power amplifiers chart a 5.92% CAGR through 2031.
- By country, Germany contributed 34.05% of 2025 revenue and Spain exhibits the fastest 7.64% CAGR through 2031.
Note: Market size and forecast figures in this report are generated using Mordor Intelligence’s proprietary estimation framework, updated with the latest available data and insights as of 2026.
Worldwide, activity is shaped by contributions from multiple regions, with Europe representing one of the more structurally developed among them. The global report on power transistor market by Mordor Intelligence reflects how these regional layers combine into a single system.
Market Trends and Insights
Drivers Impact Analysis of Europe Power Transistor Market*
| Driver | (~) % Impact on CAGR Forecast | Geographic Relevance | Impact Timeline |
|---|---|---|---|
| EV-related demand surge for SiC MOSFETs | +1.2% | Germany, France, Nordic nations | Medium term (2-4 years) |
| Renewable energy and smart-grid build-out | +1.0% | Pan-European, led by Germany and Spain | Long term (≥4 years) |
| 5G infrastructure roll-outs across Europe | +0.8% | United Kingdom, Germany, France, Italy | Short term (≤2 years) |
| EU Green-Taxonomy financing levers WBG uptake | +0.7% | EU-27, notably Germany and Netherlands | Medium term (2-4 years) |
| ISO 26262 functional-safety push to higher-voltage designs | +0.5% | Germany, France, Italy | Medium term (2-4 years) |
| Data-center PUE mandates favor high-efficiency transistors | +0.6% | Ireland, Netherlands, Germany, France | Short term (≤2 years) |
| Source: Mordor Intelligence | |||
EV-Related Demand Surge for SiC MOSFETs
European automakers increasingly specify silicon-carbide MOSFET traction inverters because these devices raise drivetrain efficiency and add 5-8% driving range compared with silicon IGBTs.[1] Euro 7 emissions rules accelerate the switch as manufacturers pursue every kilowatt-hour saved. Infineon has expanded SiC capacity in Austria and Italy, signaling clear confidence that the Europe power transistor market will keep absorbing higher volumes through 2030. As charging infrastructure migrates toward 800 V architectures, demand for 1 200 V SiC devices should intensify, locking in medium-term growth.
Renewable Energy and Smart-Grid Build-Out
The REPowerEU plan targets 1,236 GW of renewables by 2030, requiring roughly EUR 300 billion (USD 330 billion) in grid upgrades that rely on efficient high-voltage switching.[2] High-power IGBT and SiC modules enable multi-gigawatt HVDC links such as Statnett’s interconnectors, which reinforce cross-border power flow and stabilize variable generation. Grid codes rewarding lower switching losses push utilities toward wide-bandgap devices, cementing long-term demand in the European power transistor market.
5G Infrastructure Roll-Outs Across Europe
Telecom operators invested USD 60.97 billion in 2024 to deploy 5G, with power electronics accounting for about 15% of radio hardware cost. Gallium-nitride transistors deliver superior power density at C-band, enabling smaller base-stations that meet energy-efficiency mandates. Ericsson’s supply agreements with European GaN foundries illustrate the synergy between regional chip production goals and telecom modernization, generating near-term lift for the Europe power transistor market.
Data-Center PUE Mandates Favor High-Efficiency Transistors
The Energy Efficiency Directive requires European data centers to hit PUE below 1.4 by 2030, prompting hyperscalers to overhaul power supplies with GaN or SiC devices that reach 98% efficiency. CSA Catapult estimates compound semiconductors could slash facility energy use by 20%, amplifying procurement of high-efficiency switche.
Restraints Impact Analysis of Europe Power Transistor Market*
| Restraint | (~) % Impact on CAGR Forecast | Geographic Relevance | Impact Timeline |
|---|---|---|---|
| SiC substrate supply bottlenecks | -0.9% | Europe-wide | Medium term (2-4 years) |
| Premium pricing of wide-band-gap devices | -0.7% | Southern and Eastern Europe | Short term (≤2 years) |
| EU eco-design labels elongate replacement cycles | -0.4% | EU-27 consumer markets | Long term (≥4 years) |
| Gallium export-control volatility in EU-China trade | -0.5% | Germany, France, Italy | Medium term (2-4 years) |
| Source: Mordor Intelligence | |||
SiC Substrate Supply Bottlenecks
Lead times for 150 mm SiC wafers stretch to 52 weeks, constraining device output and dampening near-term revenue. Chinese vendors control 35% of global substrate capacity, leaving European fabs exposed to trade policy shocks. Infineon and STMicroelectronics signed multi-year take-or-pay deals and are co-investing in local boule growth, yet meaningful volumes will not arrive before 2027, keeping a lid on the Europe power transistor market’s upside.
Premium Pricing of Wide-Band-Gap Devices
SiC MOSFETs cost roughly three to five times more than silicon counterparts, while GaN devices price at two to three times, limiting penetration in cost-sensitive appliances and entry-level EVs. Although total-cost-of-ownership models favor wide-bandgap technology through smaller magnetics and cooling, upfront sticker shock slows adoption in Southern and Eastern Europe where purchasing power is lower. EIB financing schemes aim to bridge that gap, but price erosion remains pivotal to broadening the Europe power transistor market.
*Our forecasts treat driver/restraint impacts as directional, not additive. The impact forecasts reflect baseline growth, mix effects, and variable interactions.
Europe Power Transistor Market Segment Analysis
By Product:
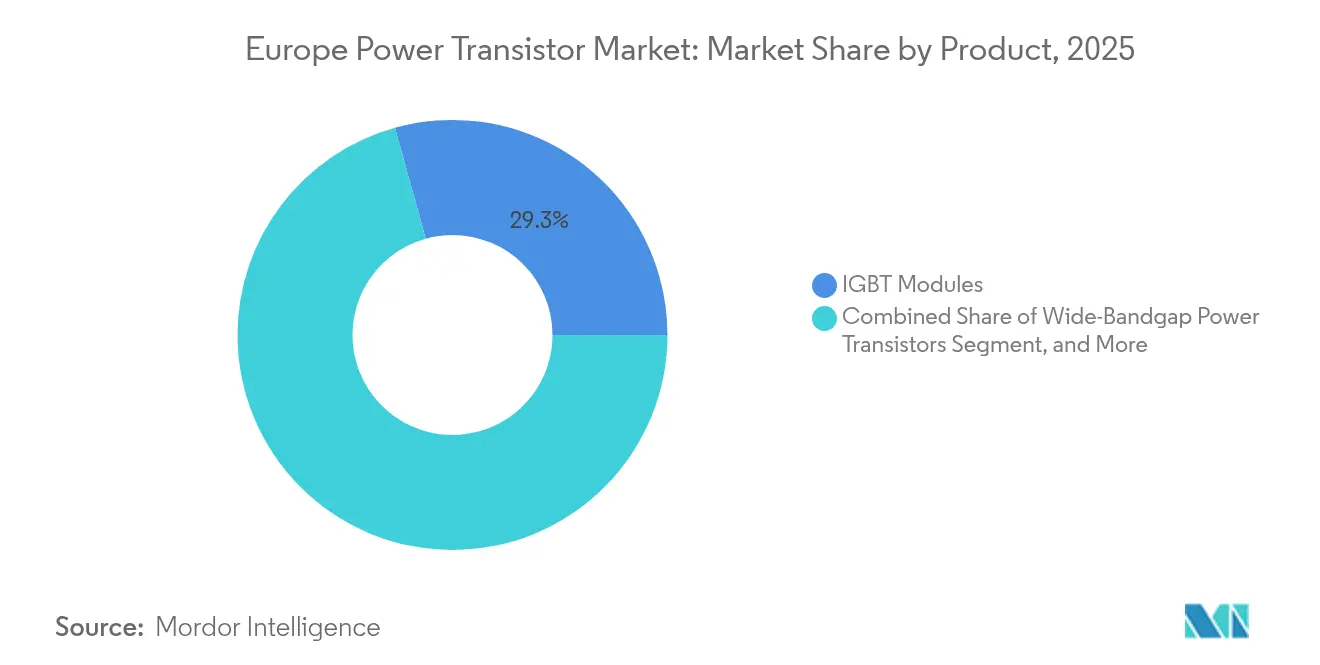
IGBT Modules Lead Industrial TransitionIGBT modules generated the largest slice of the Europe power transistor market size with 29.31% revenue in 2025. Their dominance stems from entrenched use in variable-speed drives, solar inverters, and rail traction systems that value rugged high-voltage performance. The modules pair multiple dies with optimised thermal paths, squeezing more power per cubic centimeter and fulfilling EU energy-efficiency rules. Discrete IGBTs still sell into retrofit drives, but OEMs increasingly migrate toward integrated modules that simplify assembly and improve reliability.
Wide-bandgap transistors record the quickest 7.38% CAGR and will chip away at incumbent modules, especially where every percentage-point loss impacts system economics, such as EV fast chargers. The hybrid landscape encourages vendors to co-package SiC MOSFETs with driver ICs, pushing integration advantages further. As module makers adopt direct-bonded-copper substrates and sintered silver die-attach, thermal cycles improve, extending lifetime metrics demanded by automotive traction warranties.

By Material:
Silicon Dominance Challenged by Wide-Bandgap InnovationSilicon retained 56.78% of 2025 revenue owing to its mature 200 mm fabs and cost leadership, but its share will steadily erode as designers chase higher temperature and frequency operation. Gallium nitride, growing at 6.26% CAGR, is the preferred choice for high-frequency power supplies and 5G radios where its 600 V devices outperform silicon super-junction MOSFETs. The Europe power transistor market share of SiC is also advancing as 1 200 V MOSFETs unlock EV platforms targeting 800 V battery stacks.
Strategic-autonomy policy has funneled PERTE Chip funds into Spanish and French pilot lines for GaN epitaxy, while Germany backs SiC boule growth to ease import reliance. These programs aim to shorten learning curves, drive wafer-cost parity with silicon, and reinforce local supply. Gallium arsenide and emerging oxides will remain niche, serving defense phased-array and niche scientific instrumentation.
By Type:
MOSFETs Capitalize on Switching Efficiency DemandsMOSFETs commanded 49.35% revenue in 2025. Their gate-charge efficiency and linear voltage scaling suit everything from smartphone PMICs to 350 kW traction inverters, safeguarding a broad install base. The Europe power transistor market continues to lean on MOSFET innovation, notably trench structures that cut RDS(on) below 3 mΩ.
Heterojunction bipolar transistors, advancing at 5.75% CAGR, ride the 5G tailwind where GaN HBTs deliver high gain at C-band. Bipolar junction transistors retain footholds in harsh linear regulators and welding inverters. As ISO 26262 tightens diagnostic demands, FET architectures with predictable failure modes, like normally-off SiC JFETs, pique automotive interest.
By Packaging:
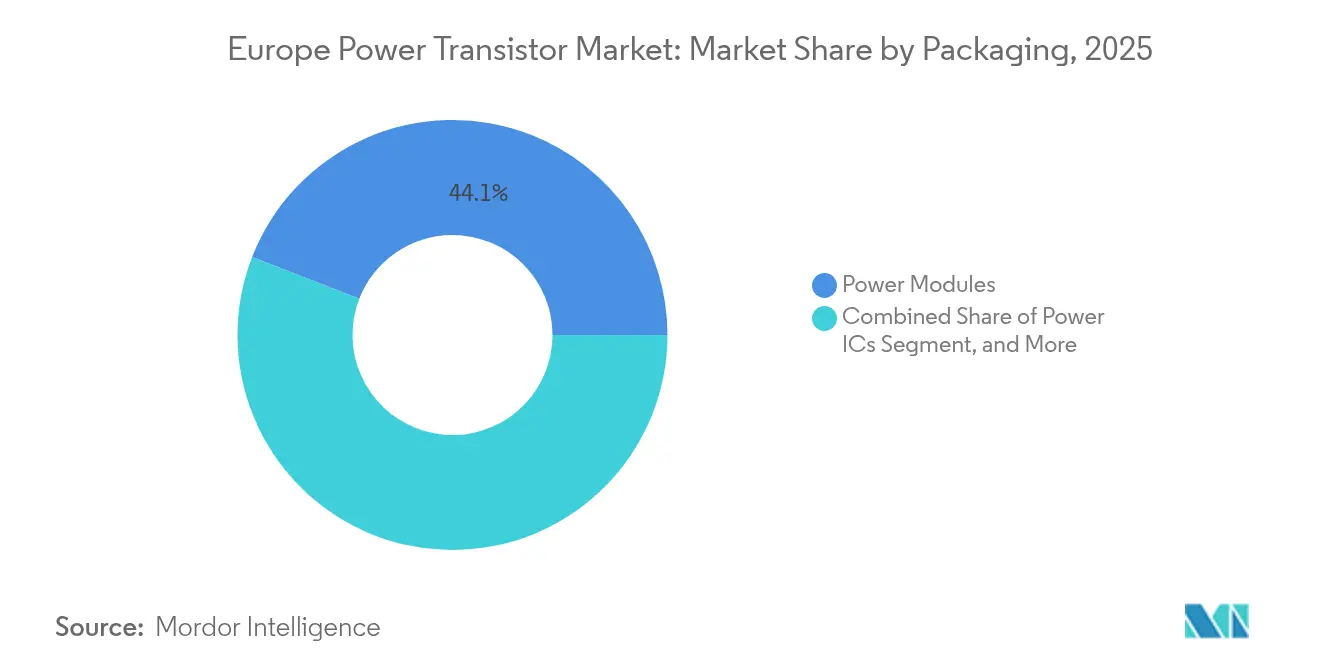
Power Modules Enable System IntegrationPower modules owned 44.10% of 2025 sales, mirroring the European shift to compact drivetrain inverters and grid-scale string inverters. Integration slashes loop inductance, boosting switching speed and cutting electromagnetic interference crucial for EV traction. The Europe power transistor market sees module vendors adding embedded current sensing to support functional safety.
Power ICs are set for a brisk 6.03% CAGR as data-center PSUs consolidate control and power stages into multi-chip modules. GaN devices favor chip-scale packaging with bottom-side cooling, while SiC half-bridge modules increasingly use silver sinter to hit 200 °C junction ratings. Discrete TO-247 devices persist in retrofit industrial drives where design flexibility and price rank higher than volumetric power density.
By Power Rating:
Medium Power Dominates Industrial ApplicationsDevices rated 40-600 V captured 45.32% of the Europe power transistor market size in 2025. This bracket aligns with 400 V AC mains, industrial DC buses, and 48 V mild-hybrid architectures, blending manageable conduction losses with affordable package options. Vendors ship super-junction MOSFETs and GaN e-mode FETs into server power supplies, slicing switching loss at hundreds of kilohertz.
High-power devices above 600 V show the fastest 5.31% CAGR. Grid operators specify 3.3-kV SiC MOSFETs for solid-state transformers that handle multi-megawatt loads without oil cooling, while 1.7-kV IGBTs dominate wind turbine converters. Low-voltage parts below 40 V stay relevant in wearables and USB-PD chargers, but volume growth hinges on handset design cycles set mostly outside Europe.
By End-User Industry:
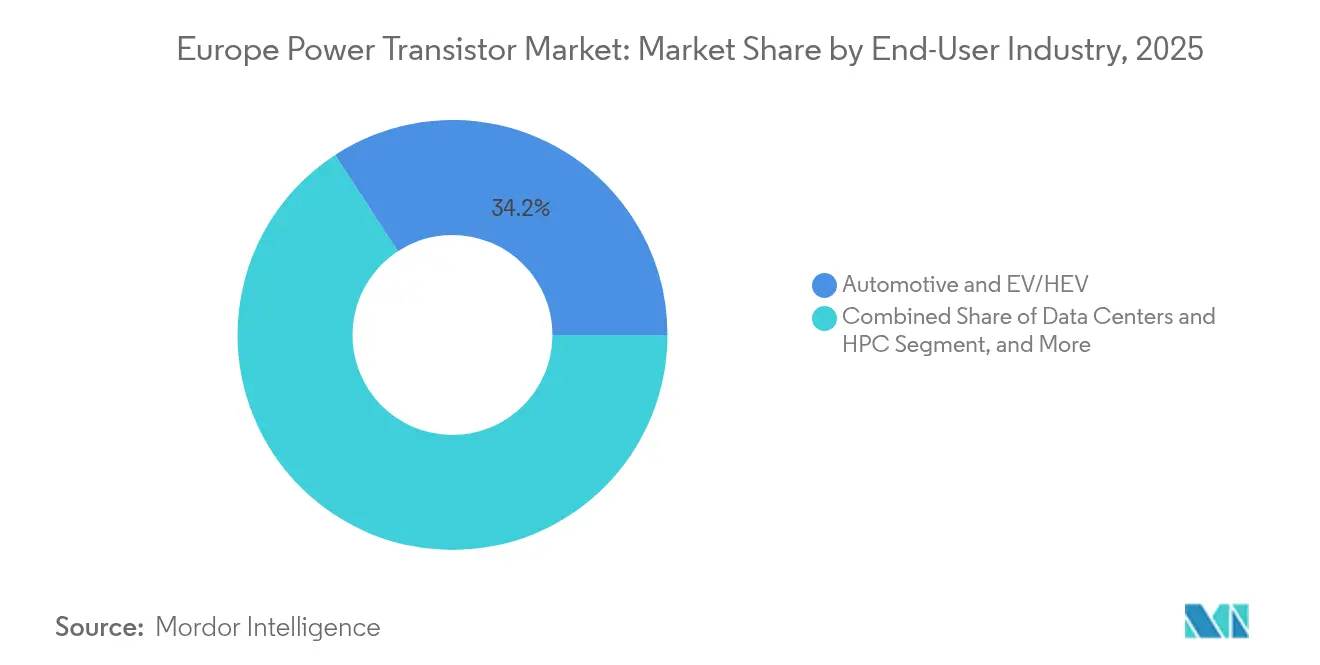
Automotive Electrification Drives GrowthAutomotive and EV/HEV captured 34.20% of the Europe power transistor market share in 2025. Volkswagen’s USD 208.97 billion electrification roadmap secures long-term pull for 750 V SiC power modules. Tier-one suppliers bundle traction inverters, DC-DC converters, and on-board chargers, inflating per-vehicle semiconductor billings.
Data centers and HPC top growth tables at 6.43% CAGR. Hyperscalers in Ireland and the Netherlands integrate GaN FET multiphase VRMs that meet stringent PUE targets. Industrial automation holds steady as plant retrofits introduce variable-speed drives. Aerospace and defense remain niche but strategic, emphasizing radiation-hard devices and sovereign sourcing.
By Application:
Inverters and Converters Lead Power ConversionInverters and converters represented 30.74% of 2025 revenue and remain the backbone of the Europe power transistor market. Solar farms, motor drives, and EV powertrains all depend on bidirectional, high-efficiency conversion. Multi-level topologies employing fast SiC switches unlock 99% efficiency in 1 MW string inverters, cutting LCOE for renewables.
RF power amplifiers, at 5.92% CAGR, rise on massive-MIMO roll-outs. GaN HEMTs push 65% drain efficiency at 3.5 GHz, slashing base-station electricity bills. Motor control continues steady expansion as EU Eco-design rules make variable-speed drives mandatory for pumps and HVAC. Battery charging tallies growth via public 350 kW stations across Trans-European Transport corridors.
Geography Analysis
Germany Power Transistor Market
Germany dominated the Europe power transistor market with 34.05% revenue in 2025. Its Energiewende-driven renewable build-out and automotive power-train shift underpin high local demand. Berlin earmarked USD 3.48 billion for semiconductor R&D through 2027, ensuring ongoing fab modernization.
Broader European Markets
France leverages STMicroelectronics’ cluster in Grenoble and Tours and dedicates USD 6.97 billion under France 2030 to power devices, elevating domestic output. The United Kingdom pursues resilience via its USD 19.28 million power-electronics grant scheme, emphasizing automotive SiC substrate onshoring. Italy benefits from Catania’s 200 mm SiC line while championing renewable installations to decarbonize heavy industry. Spain posts the swiftest 7.64% CAGR, buoyed by the USD 14.23 billion PERTE Chip program that lures IMEC’s first non-Belgian site to Málaga. The Nordic region’s hydropower surplus translates into aggressive HVDC projects that consume high-voltage modules. Eastern European states modernize grids and attract automotive tier-ones, yet weaker purchasing power tempers short-term volume.
Mordor Intelligence provides coverage of the power transistor market across other key regional markets, including Asia, each with their regulatory frameworks and demand patterns. Detailed country-level analysis extends to China and Japan incorporating local coverage and market participation, as required.
Regulatory Landscape
The Europe power transistor market is shaped by EU-wide product and sustainability rules that influence materials selection and lifecycle documentation. RoHS (2011/65/EU and its phthalates amendment 2015/863) and REACH (EC) 1907/2006 affect bill-of-materials decisions for discrete devices, modules, and packaging chemistries, while the Ecodesign for Sustainable Products Regulation (ESPR) and the Corporate Sustainability Reporting Directive (CSRD) increase expectations for energy-efficiency and environmental-impact disclosures across electronics supply chains.
On industrial policy, the European Commission proposed Chips Act 2.0 in June 2026 (COM/2026/504), building on the Semicon Coalition Declaration signed by 27 EU Member States on 29 September 2025. The proposal aims to close semiconductor value-chain gaps and strengthen strategic autonomy, with governance mechanisms such as the European Semiconductor Board supporting cross-member-state coordination for supply monitoring and crisis response. This policy backdrop reinforces capacity-building and localization programs relevant to power devices (Si, SiC, and GaN).
Value Chain Analysis
Europe’s power transistor value chain covers raw materials and substrates (including silicon wafers and wide-bandgap inputs such as SiC substrates and GaN epitaxy), device design and process IP, wafer fabrication at mature nodes, and assembly and test for power modules and advanced packaging. Channel delivery then runs to OEMs and tier suppliers across automotive, industrial drives, energy infrastructure, telecom, and data centers. Regional IDMs and module specialists support manufacturing and packaging know-how, while substrate availability and qualification cycles remain decisive for wide-bandgap scale-up.
Public programs are increasingly linked to activities across the chain from R&D through industrialization. Frameworks such as IPCEI ME/CT support semiconductor investments, while the European Chips Act architecture emphasizes design capacity and pilot lines. The June 2026 Chips Act 2.0 proposal also points to reinforcement tools such as a Chips for Europe Initiative 2.0 and financing mechanisms intended to improve access to capital for startups and SMEs, strengthening coverage from design through packaging and test.
Competitive Landscape
The Europe power transistor market shows moderate concentration. Infineon, STMicroelectronics, and Nexperia anchor integrated device manufacturing, collectively supplying over half the continent’s Si and SiC output. U.S. multinationals Texas Instruments and onsemi maintain European design centers, expanding wide-bandgap portfolios through acquisitions such as onsemi’s purchase of Qorvo’s SiC JFET assets in 2024.[4]
Strategic thrusts revolve around vertical integration of substrates and advanced packaging. Wolfspeed’s planned Saarland SiC fab and Infineon’s Villach expansion signal race-to-capacity. Module suppliers differentiate via embedded digital current sensors and prognostic health monitoring aligned with ISO 26262. Start-ups focus on GaN-on-Si e-mode FETs and integrated gate drivers that shave PCB area for notebook chargers. Supply-chain risk triggers cooperative EU-funded pilot lines, nudging the market toward regional self-sufficiency.
Europe Power Transistor Industry Leaders
-
Infineon Technologies AG
-
Renesas Electronics Corporation
-
Texas Instruments Incorporated
-
ON Semiconductor Corporation
-
Mitsubishi Electric Corporation
- *Disclaimer: Major Players sorted in no particular order

Europe Power Transistor Market Companies Covered in this Report
- Infineon Technologies AG
- STMicroelectronics N.V.
- ON Semiconductor Corporation
- Nexperia B.V.
- ROHM Co., Ltd.
- Toshiba Electronic Devices and Storage Corporation
- Mitsubishi Electric Corporation
- Vishay Intertechnology, Inc.
- Renesas Electronics Corporation
- Texas Instruments Incorporated
- Analog Devices, Inc.
- IXYS LLC
- Littelfuse, Inc.
- Microchip Technology Inc.
- Wolfspeed, Inc.
- GeneSiC Semiconductor LLC
- UnitedSiC LLC
- Semikron Danfoss GmbH and Co. KG
- Dialog Semiconductor Limited
- Alpha and Omega Semiconductor Limited
Market Opportunities and Future Outlook
A key opportunity is Europe-based scale manufacturing and integration around power semiconductors for AI data centers and electrified mobility, especially where customers prioritize shorter lead times, multi-sourcing, and compliance-ready traceability. Infineon’s opening of its Smart Power Fab in Dresden on 2 July 2026, a EUR 5 billion investment, is a specific signal of regional capacity build-out tied to power semiconductors and analog/mixed-signal technologies. It also opens room for local suppliers in equipment services, assembly and test, power-module substrates, and thermal-interface and interconnect solutions that support automotive-grade and data-center-grade qualification.
Technology-driven opportunities cluster in wide-bandgap adoption and system-level integration, including GaN-based high-efficiency power stages for data centers and telecom, and SiC devices for high-voltage traction, charging, and grid conversion. onsemi’s June 2026 GaNEXUS portfolio launch (40 V to 650 V) and Mitsubishi Electric’s June 2026 sampling of 5th-generation SiC-MOSFET bare dies for xEV applications illustrate ongoing productization and design-in activity that supports demand for co-packaged power stages, gate drivers, and reliability-focused packaging. Policy workstreams around Chips Act 2.0 and the European Semiconductor Board’s supply-chain monitoring reinforce unmet needs in resilient substrate sourcing and localized pilot-to-volume pathways for power devices.
Recent Industry Developments in Europe Power Transistor Market
- July 2026: Infineon Technologies AG opened the 5 billion euro Smart Power Fab in Dresden, doubling manufacturing capacity for power semiconductors and analog/mixed-signal technologies. The opening expands the European manufacturing footprint and improves EU supply-chain resilience for SiC and GaN devices.
- June 2026: onsemi launched the GaNEXUS power portfolio, GaN FETs from 40V to 650V for AI data centers and energy infrastructure. The capacity addition expands Europe\'s wide-bandgap device portfolio and supports higher-efficiency power conversion in data centers and grid infrastructure.
- June 2026: Mitsubishi Electric Corporation shipped samples for 5th-generation SiC-MOSFETs in bare die form for xEV applications. The move shows continued progress in EU-relevant SiC tech adoption and supplier diversification.
Europe Power Transistor Market Report Scope and Research Methodology
Market Definition and Coverage
This market covers the value of power transistors sold and used across Europe in power conversion and power control circuits, including automotive electrification, industrial drives, energy infrastructure, and electronics where switching and power handling are core requirements.
Scope exclusions: The sizing excludes standalone passive components and unrelated power management ICs that do not function as power transistors.
Segments Covered in This Report
- By Product
- Low-Voltage FETs
- High-Voltage FETs
- Discrete IGBT
- IGBT Modules
- Super-Junction MOSFETs
- RF and Microwave Transistors
- Wide-Bandgap Power Transistors (SiC, GaN)
- By Material
- Silicon
- Silicon Carbide (SiC)
- Gallium Nitride (GaN)
- Gallium Arsenide (GaAs)
- Other Materials
- By Type
- Bipolar Junction Transistor (BJT)
- Field-Effect Transistor (MOSFET, JFET)
- Heterojunction Bipolar Transistor (HBT)
- By Packaging
- Discrete Devices
- Power Modules
- Power ICs / Integrated Power Stages
- By Power Rating
- Low Power (< 40 V)
- Medium Power (40–600 V)
- High Power (> 600 V)
- By End-User Industry
- Automotive and EV/HEV
- Consumer Electronics and Mobile
- Industrial Automation and Motor Drives
- Energy and Power (Renewables, Smart Grid)
- Data Centers and HPC
- Telecom and 5G Infrastructure
- Aerospace and Defense
- By Application
- Inverters and Converters
- Motor Control and Drives
- Power Supplies and Adapters
- Battery Charging and BMS
- RF Power Amplifiers
- Lighting and Display Drivers
- By Country
- Germany
- United Kingdom
- France
- Italy
- Spain
- Nordics (Denmark, Sweden, Norway, Finland)
- Rest of Europe
Data Sources, Market Sizing, and Validation
Desk Research
Desk research starts by building a Europe demand and supply context for power electronics, then narrows it to power transistor shipments, pricing, and use cases. Public sources help anchor fundamentals such as semiconductor production and trade flows, manufacturing output, and energy transition investments.
Typical reference points include Eurostat (industry output and trade), the European Commission and EU energy transition publications, the International Energy Agency for power and grid investment indicators, ENTSO-E for electricity system and interconnection signals, and EPO patent databases to sanity check technology direction. We also review annual reports, regulatory filings, and investor materials from relevant manufacturers and large buyers, plus credible press and association updates. For targeted cross-checks, paid databases are used in limited ways, such as company financials and patent analytics, along with shipment-level import and export records where available. The desk sources listed here are illustrative rather than exhaustive, and other public documents were used for data collection, validation, and clarification.
Primary Interviews and Surveys
Primary work is used to confirm what the desk signals cannot fully explain, particularly how pricing, product mix (silicon versus wide bandgap), and application demand are moving across Europe. We speak with manufacturers, distributors, OEM power electronics teams, and industry experts in major European demand centers, then recheck assumptions when responses show large differences by country or end use.
Distribution of primary research fieldwork respondents
| Company type | Respondent position |
|---|---|
| Top tier: 30% | CXOs: 15% |
| Mid tier: 52% | Functional/Unit leaders: 33% |
| Smaller Players: 18% | Managers: 52% |
Market-Sizing & Forecasting
Our sizing logic starts from a top-down reconstruction of demand using Europe-side production and trade indicators, then narrows that pool using application adoption signals linked to power conversion needs. Once the initial total is shaped, selective bottom-up checks are added, such as sampled ASP x volume for key device families and channel feedback on mix shifts, which helps correct overstatements from any single proxy.
Inputs used in the model include EV and charging buildout indicators, renewable additions and grid upgrade activity that increase power conversion content, industrial motor drive and automation trends, data center power density related demand signals, and observed shifts in device mix toward SiC and GaN for higher efficiency designs. When gaps appear in country-level visibility, we apply conservative allocation keys tied to manufacturing output and end-market footprints, followed by a second review using interview guidance.
Forecasts are developed using scenario analysis. The base case links demand to the drivers above, and then expected ASP movement is applied based on mix and qualification cycles. Scenario ranges are discussed with experts so the final curve remains practical and consistent with how buyers plan power electronics programs.
Data Validation & Update Cycle
Validation is done through triangulation across multiple checkpoints, including macro signals, application-level demand indicators, and pricing and mix feedback from interviews. Outliers are flagged, and the drivers behind the variance are reviewed, followed by a second analyst check before the numbers are finalized.
Reports are refreshed annually, and interim updates are made when material events can change demand or supply assumptions. Before delivery, a final pass is completed so the model reflects the latest public data releases and the most recent expert feedback.
Mordor Intelligence's Europe Power Transistor Market Sizing Compared With Other Published Estimates
Published market sizes for Europe power transistors often differ because scope boundaries are not always consistent, and because product mix and pricing can move quickly when wide bandgap devices gain share. Differences also come from the choice of base year, the currency conversion timing used for Europe-wide totals, and how much validation is completed against real end-market activity.
EV production signals, renewable and grid investment indicators, and cross-checks against trade movement are the evidence used to keep Mordor Intelligence's estimate aligned to the Europe demand pool, rather than to a broader power discrete bucket. Gaps usually show up when adjacent modules, broader discrete semiconductors, or non-European revenue are blended in, or when ASP progression assumes a faster premium mix shift without enough channel confirmation.
Benchmark comparison
| Source | Market Size | Gaps in Research Methodology |
|---|---|---|
| Mordor Intelligence | USD 5.77 B (2025) | |
| Trade Journal A | USD 17.03 B (2024) | Uses a much broader regional scope and category definition that reads closer to a global power transistor view, and the Europe cut is not clearly separated from non-European revenue and adjacent power semiconductor content. |
| Industry Research Portal B | USD 4.50 B (2034) | Focuses on a long-dated endpoint and applies a simplified growth path, which can understate near-term shifts in SiC and GaN mix and related ASP changes across automotive and energy applications. |
The spread across publishers mainly comes from what is counted as a power transistor market in Europe and how the path from demand drivers to revenue is constructed. By tying the model to observable adoption signals and then sanity checking pricing and mix through expert feedback, the final estimate stays traceable to clear inputs and repeatable steps.
Key Questions Answered in the Report
What is the projected revenue for Europe’s power transistor space by 2031?
The Europe power transistor market size is forecast to reach USD 7.92 billion by 2031.
Which device category currently dominates shipments in Europe?
IGBT modules hold the largest share at 29.31% thanks to widespread use in industrial drives and renewable inverters.
How fast are gallium-nitride devices growing across the region?
GaN transistors are projected to rise at a 6.26% CAGR between 2026 and 2031 as data-center and 5G applications scale.
Why is Spain considered a key growth hotspot?
Spain’s PERTE Chip program funnels USD 14.23 billion into domestic semiconductor capacity, pushing a 7.64% CAGR through 2031.
What supply risks could moderate market expansion?
Limited SiC substrate availability and possible gallium export controls remain the most significant headwinds for European producers.